Copyright
©The Author(s) 2025.
World J Diabetes. May 15, 2025; 16(5): 102994
Published online May 15, 2025. doi: 10.4239/wjd.v16.i5.102994
Published online May 15, 2025. doi: 10.4239/wjd.v16.i5.102994
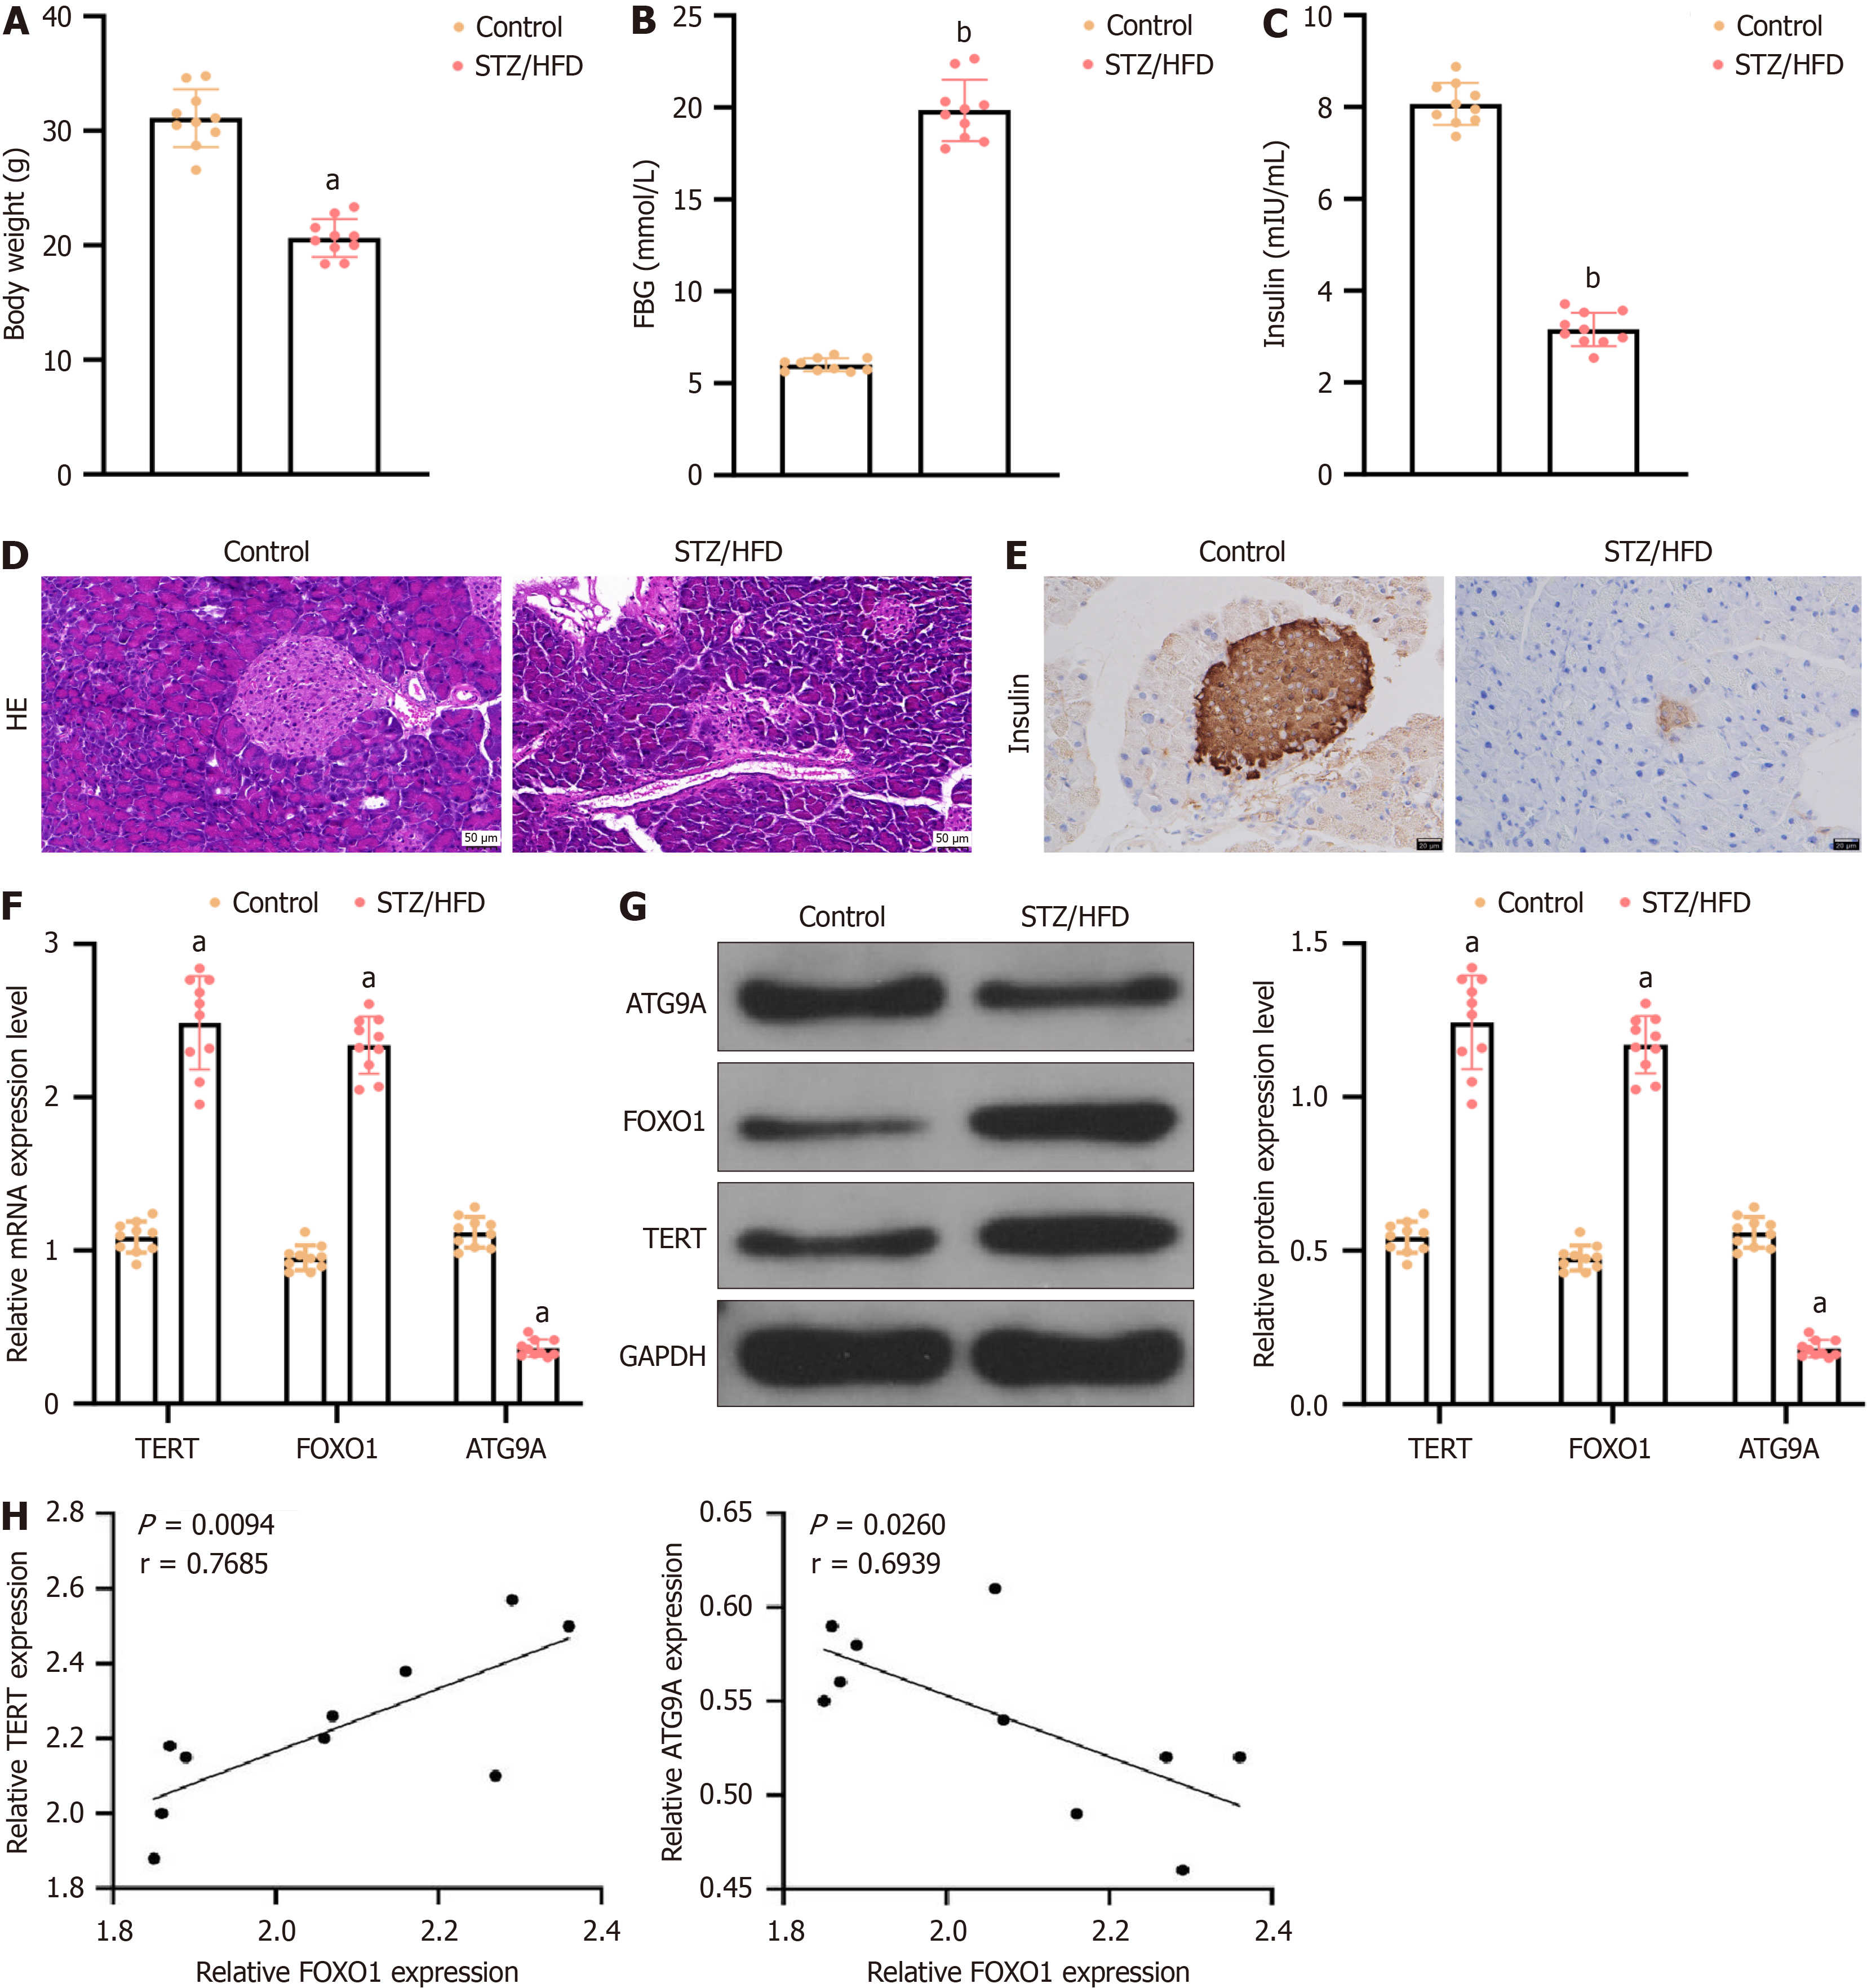
Figure 1 Altered expression of TERT, FOXO1 and ATG9A was found in the pancreatic tissues of type 2 diabetes mellitus model mice.
A type 2 diabetes mellitus model was generated by feeding mice a high-fat diet and administering intraperitoneal injections of streptozotocin. A and B: Mouse body weight and fasting blood glucose; C: Plasma insulin levels were measured using ELISAs; D: H&E staining was used to assess morphological changes in islet tissues (× 200); E: Immunohistochemistry was used to assess changes in insulin levels(× 400); F and G: TERT, FOXO1 and ATG9A mRNA and protein expression levels were analyzed via reverse transcription quantitative polymerase chain reaction and western blotting; H: Pearson correlation analysis was used to determine the correlations among TERT, FOXO1 and ATG9A. The data are expressed as mean ± SD. n = 10 for in vivo experiments. aP < 0.05 vs control group, bP < 0.01 vs control group. FBG: Fasting blood glucose; HFD: High-fat diet; STZ: Streptozotocin.
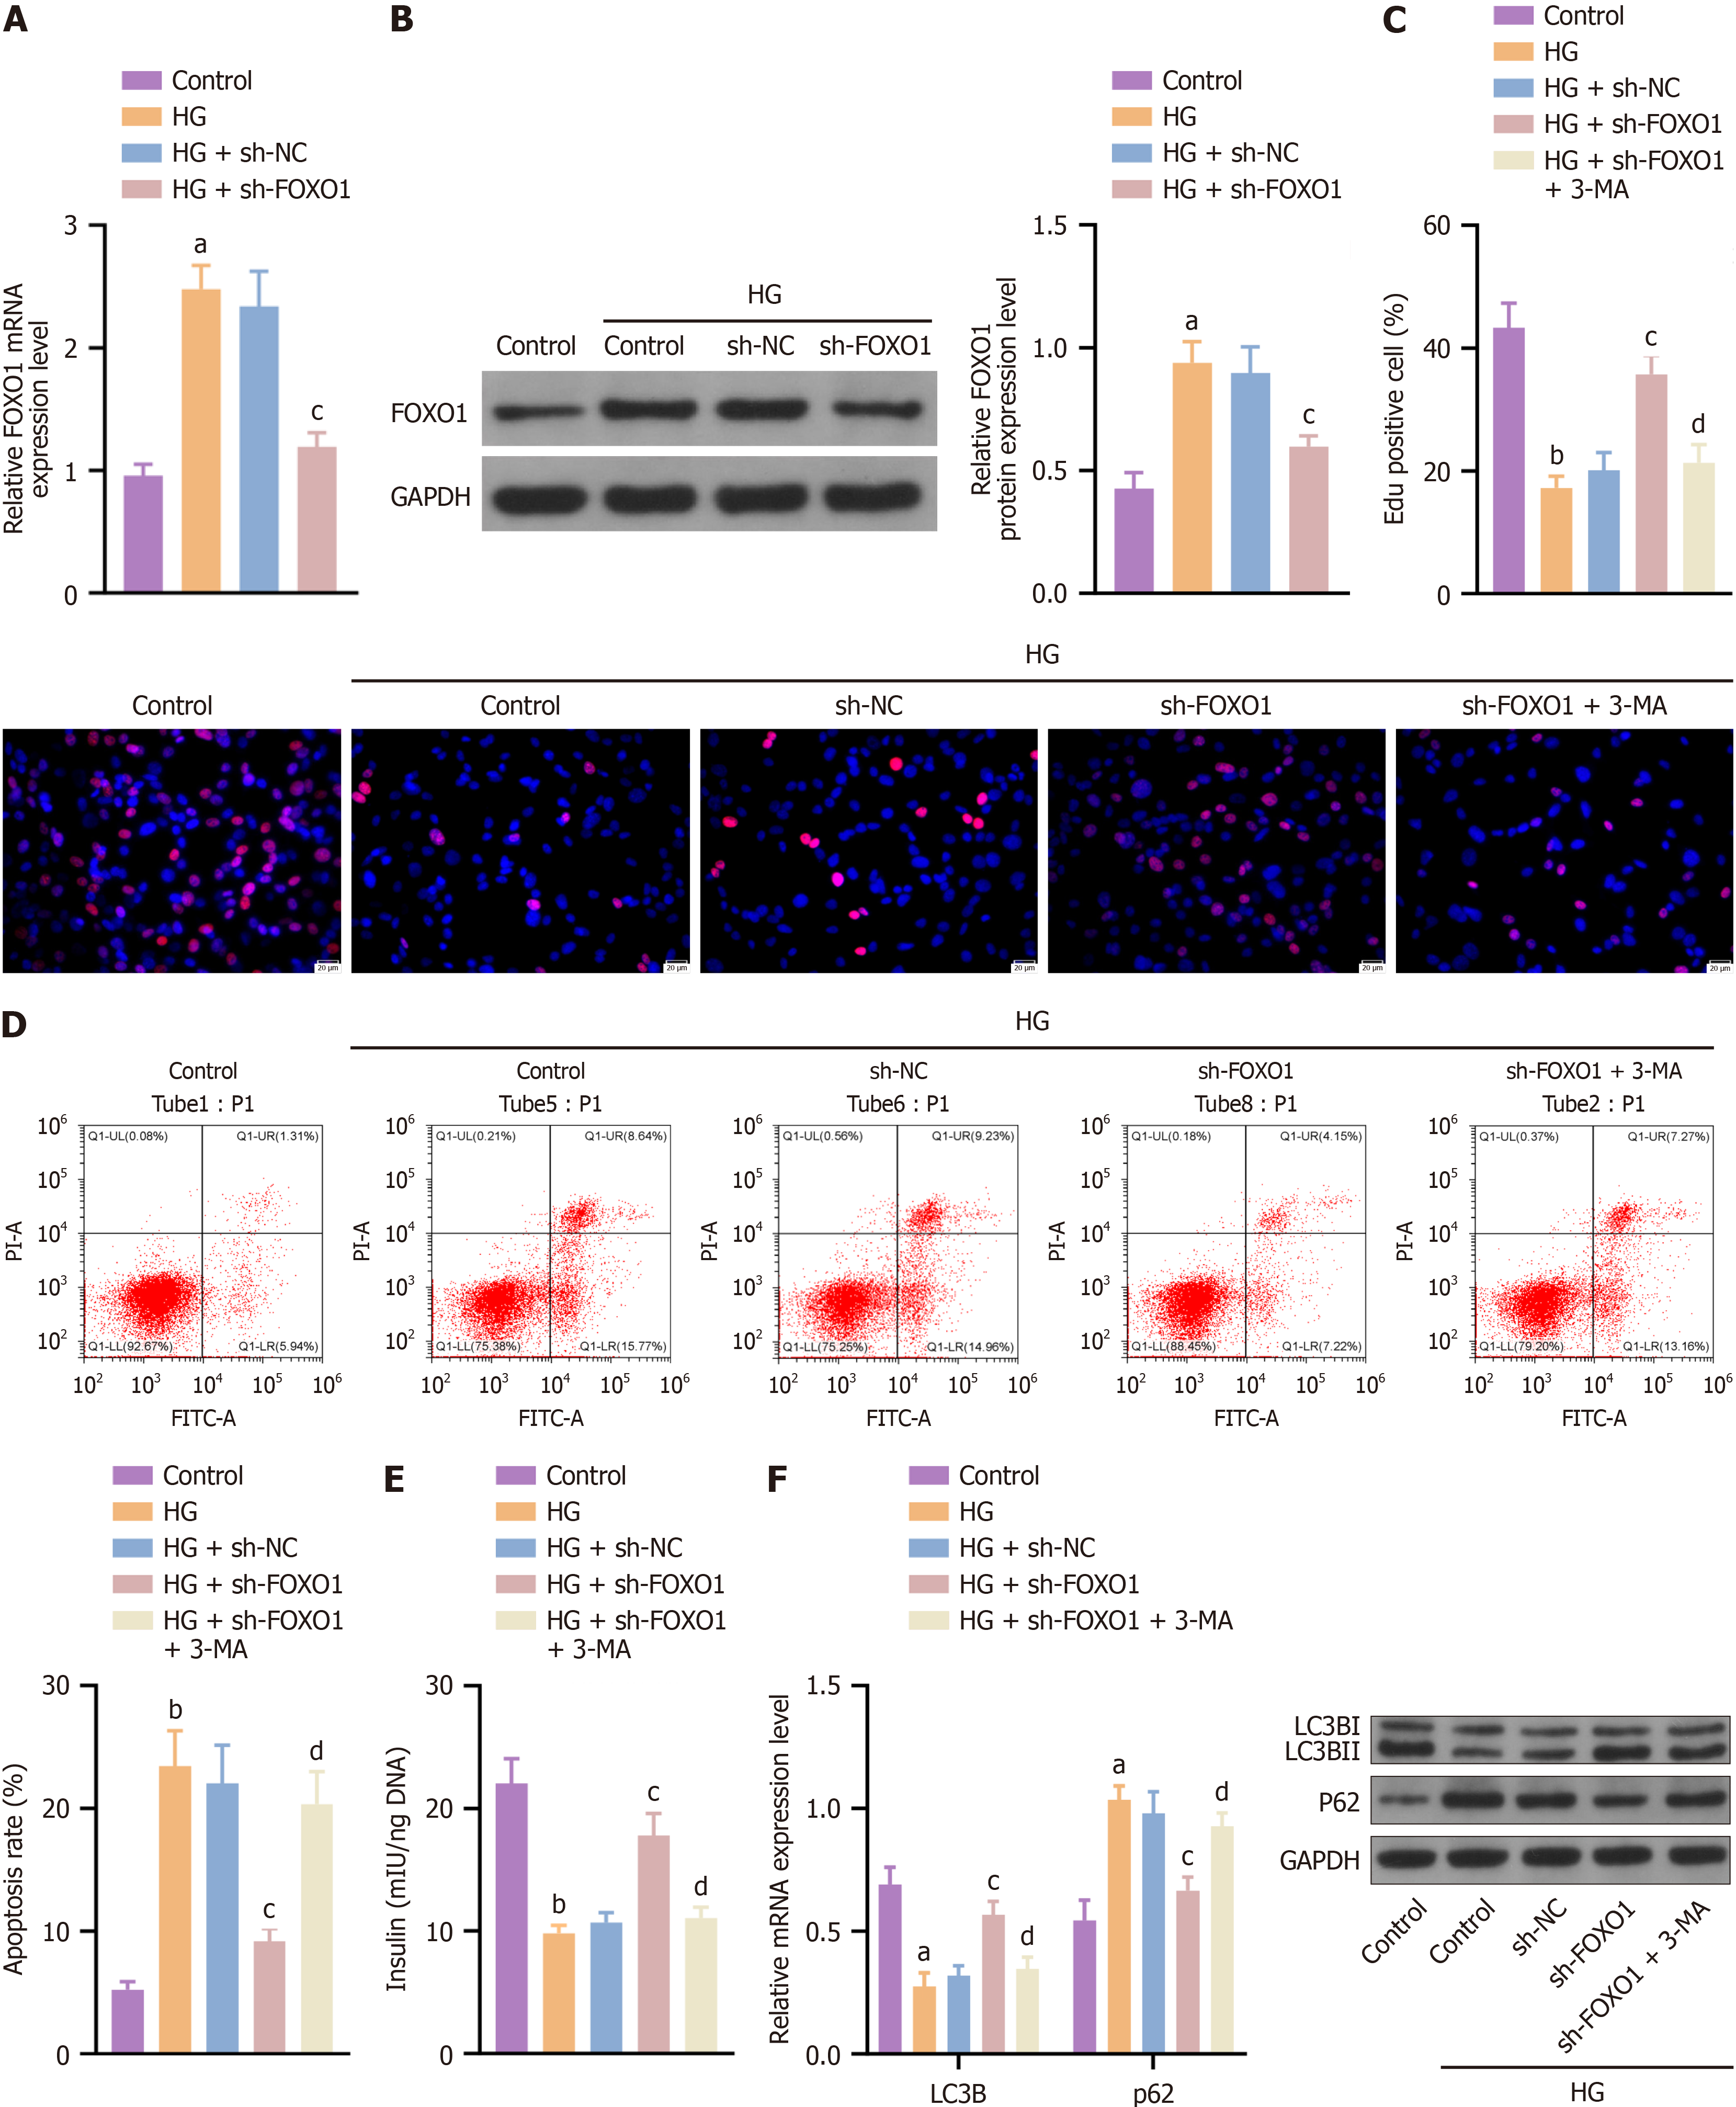
Figure 2 FOXO1 knockdown activates autophagy to protect β-cells against high glucose-induced dysfunction.
sh-FOXO1 and/or the autophagy inhibitor 3-MA were used to treat high glucose-treated MIN6 cells. A and B: Reverse transcription quantitative polymerase chain reaction and western blotting were used to analyze FOXO1 mRNA and protein expression; C: EdU staining was used to analyze cell proliferation ability (red staining: the labeled proliferating cells, blue staining: the nuclei); D: Flow cytometry was used to assess the cell apoptosis rate; E: Insulin levels were measured via ELISA; F: The expression of the autophagy proteins LC3B and p62 was analyzed via western blotting. The data are expressed as mean ± SD. Each experiment was conducted in triplicate. aP < 0.05 vs control group, bP < 0.05 vs control group, cP < 0.05 vs HG + sh-NC group, dP < 0.05 vs HG + sh-FOXO1 group. HG: High glucose.
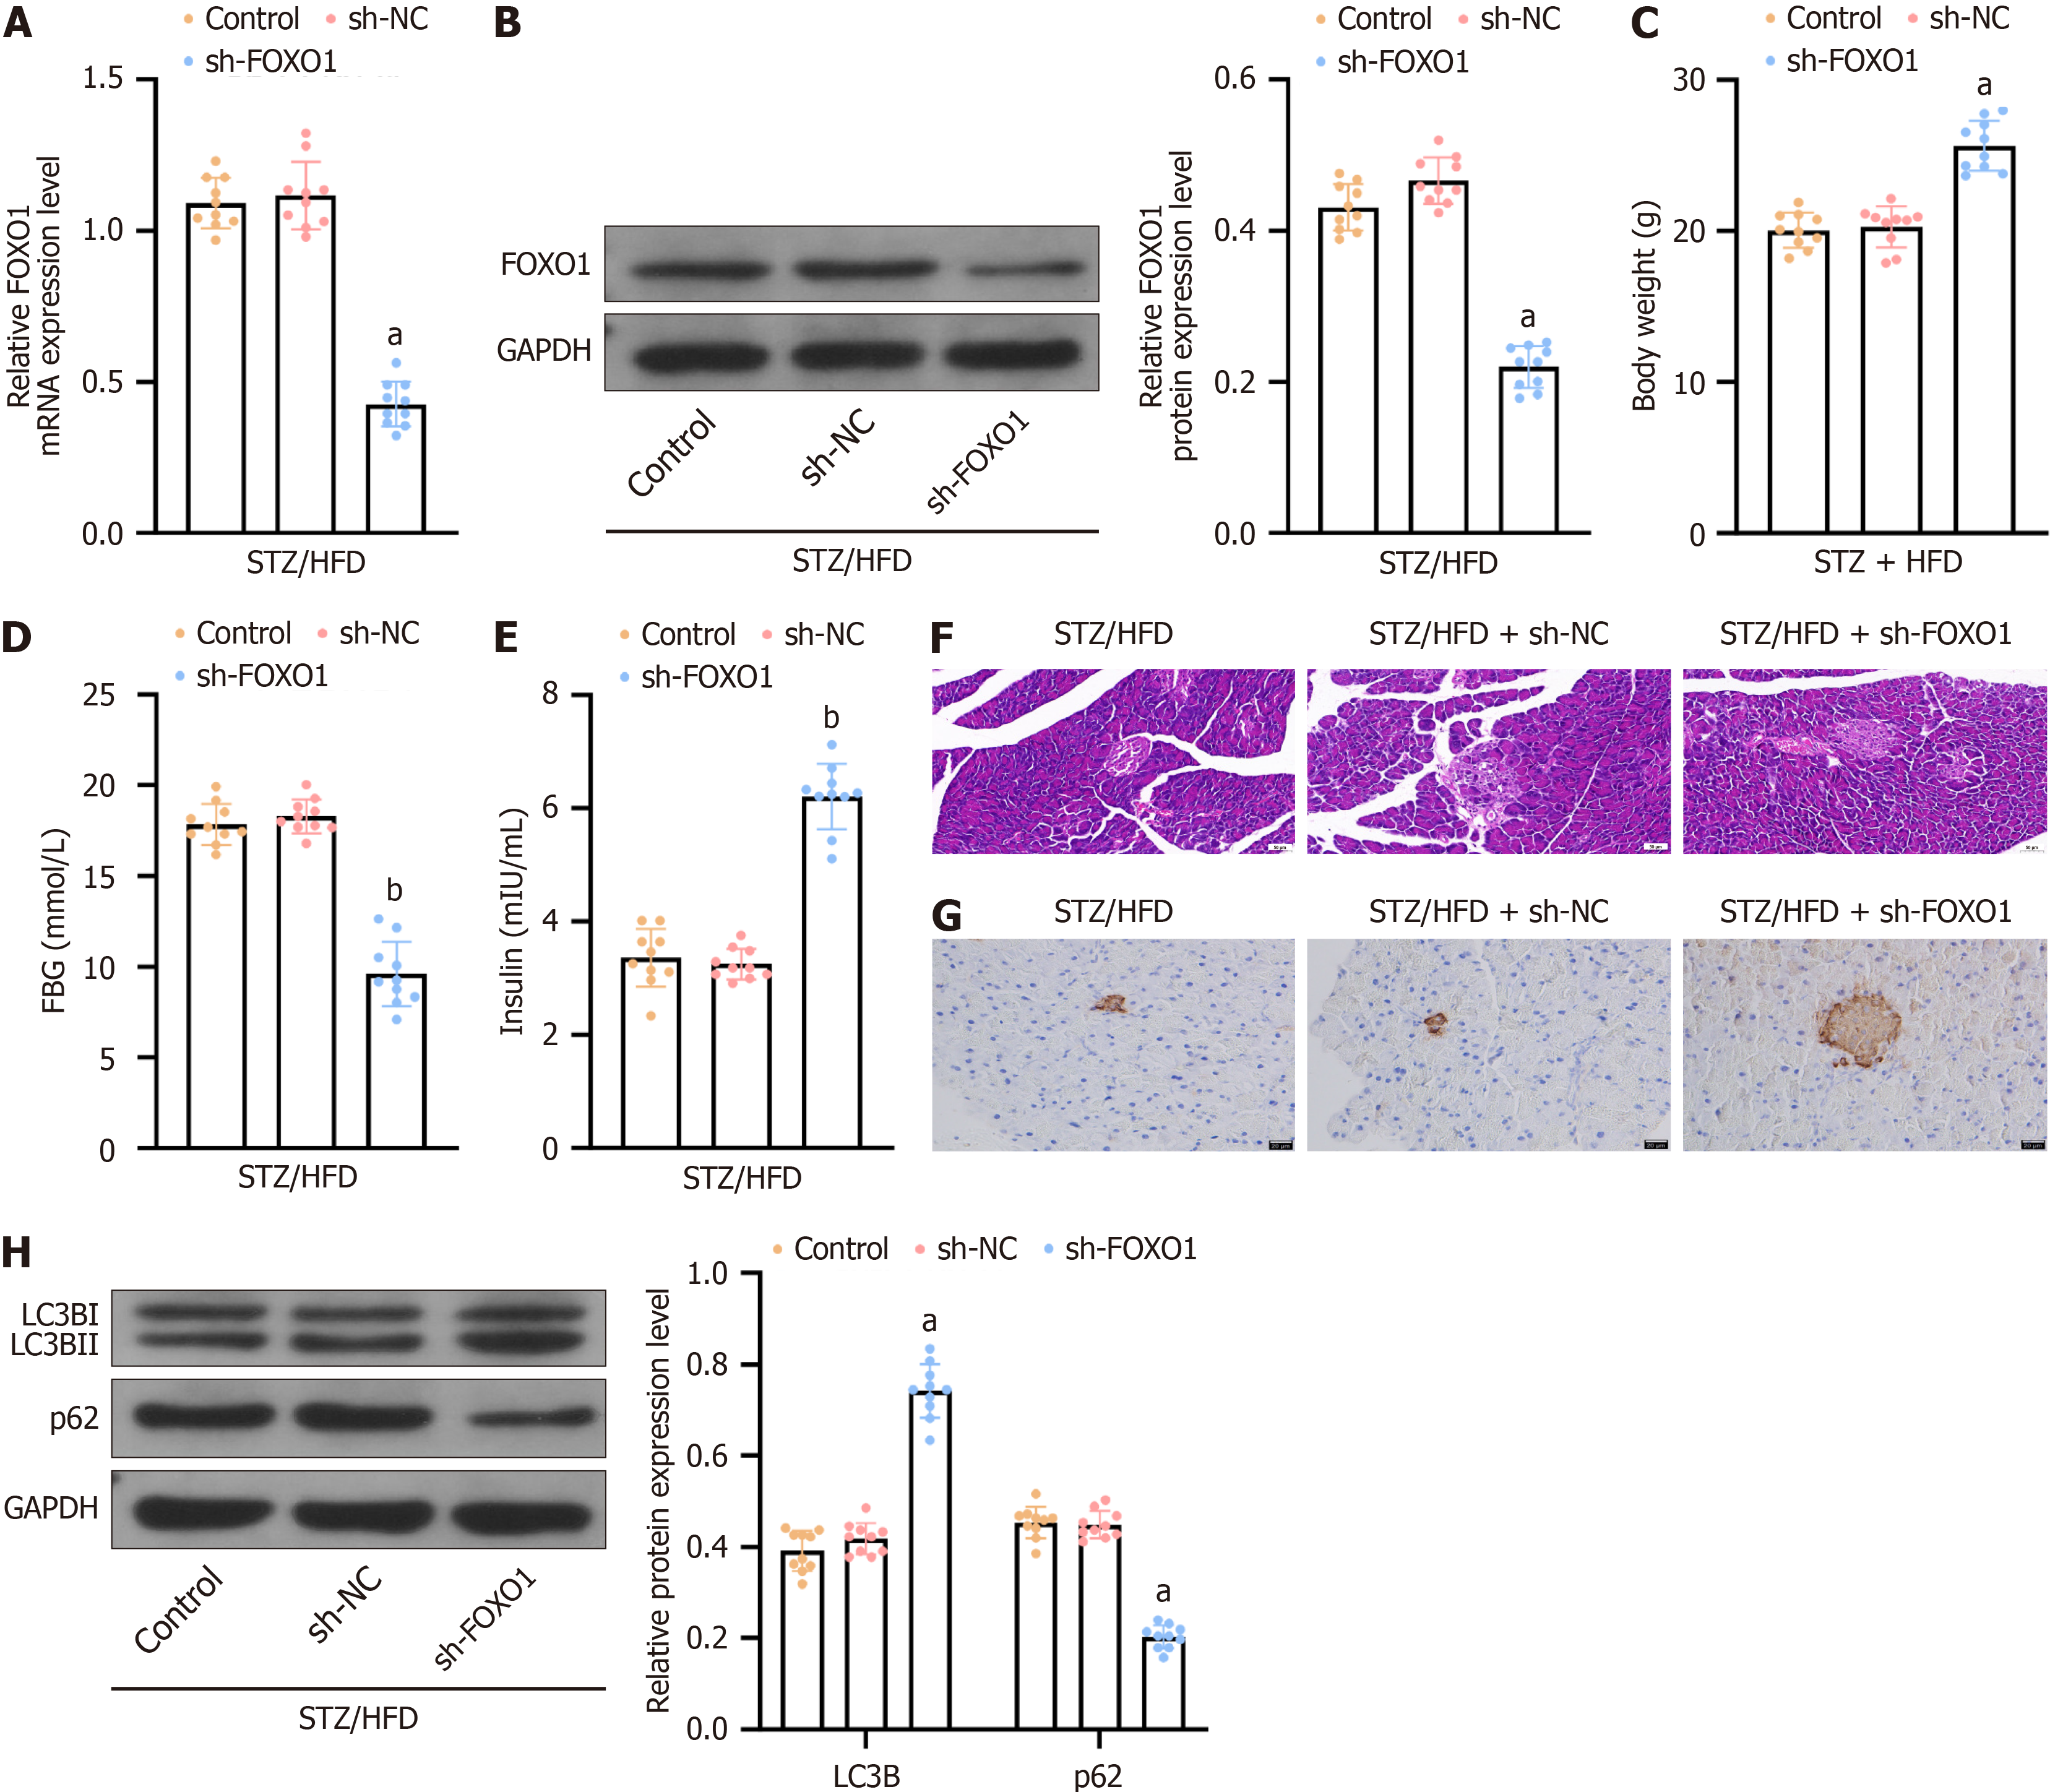
Figure 3 FOXO1 knockdown suppresses type 2 diabetes mellitus progression in mice.
sh-FOXO1 was injected into type 2 diabetes mellitus mice. A and B: FOXO1 mRNA and protein expression was analyzed via reverse transcription quantitative polymerase chain reaction and western blot; C and D: Body weight and fasting blood glucose; E: Insulin levels were measured via ELISAs; F: Morphology of islet tissues via H&E staining (× 200); G: Insulin levels were analyzed via immunohistochemistry (× 200); H: Western blotting was used to assess the expression of LC3B and p62. The data are expressed as means ± SD. n = 10 for in vivo experiments. aP < 0.05 vs STZ/HFD + sh-NC group, bP < 0.01 vs STZ/HFD + sh-NC group. FBG: Fasting blood glucose; HFD: High-fat diet; STZ: Streptozotocin.
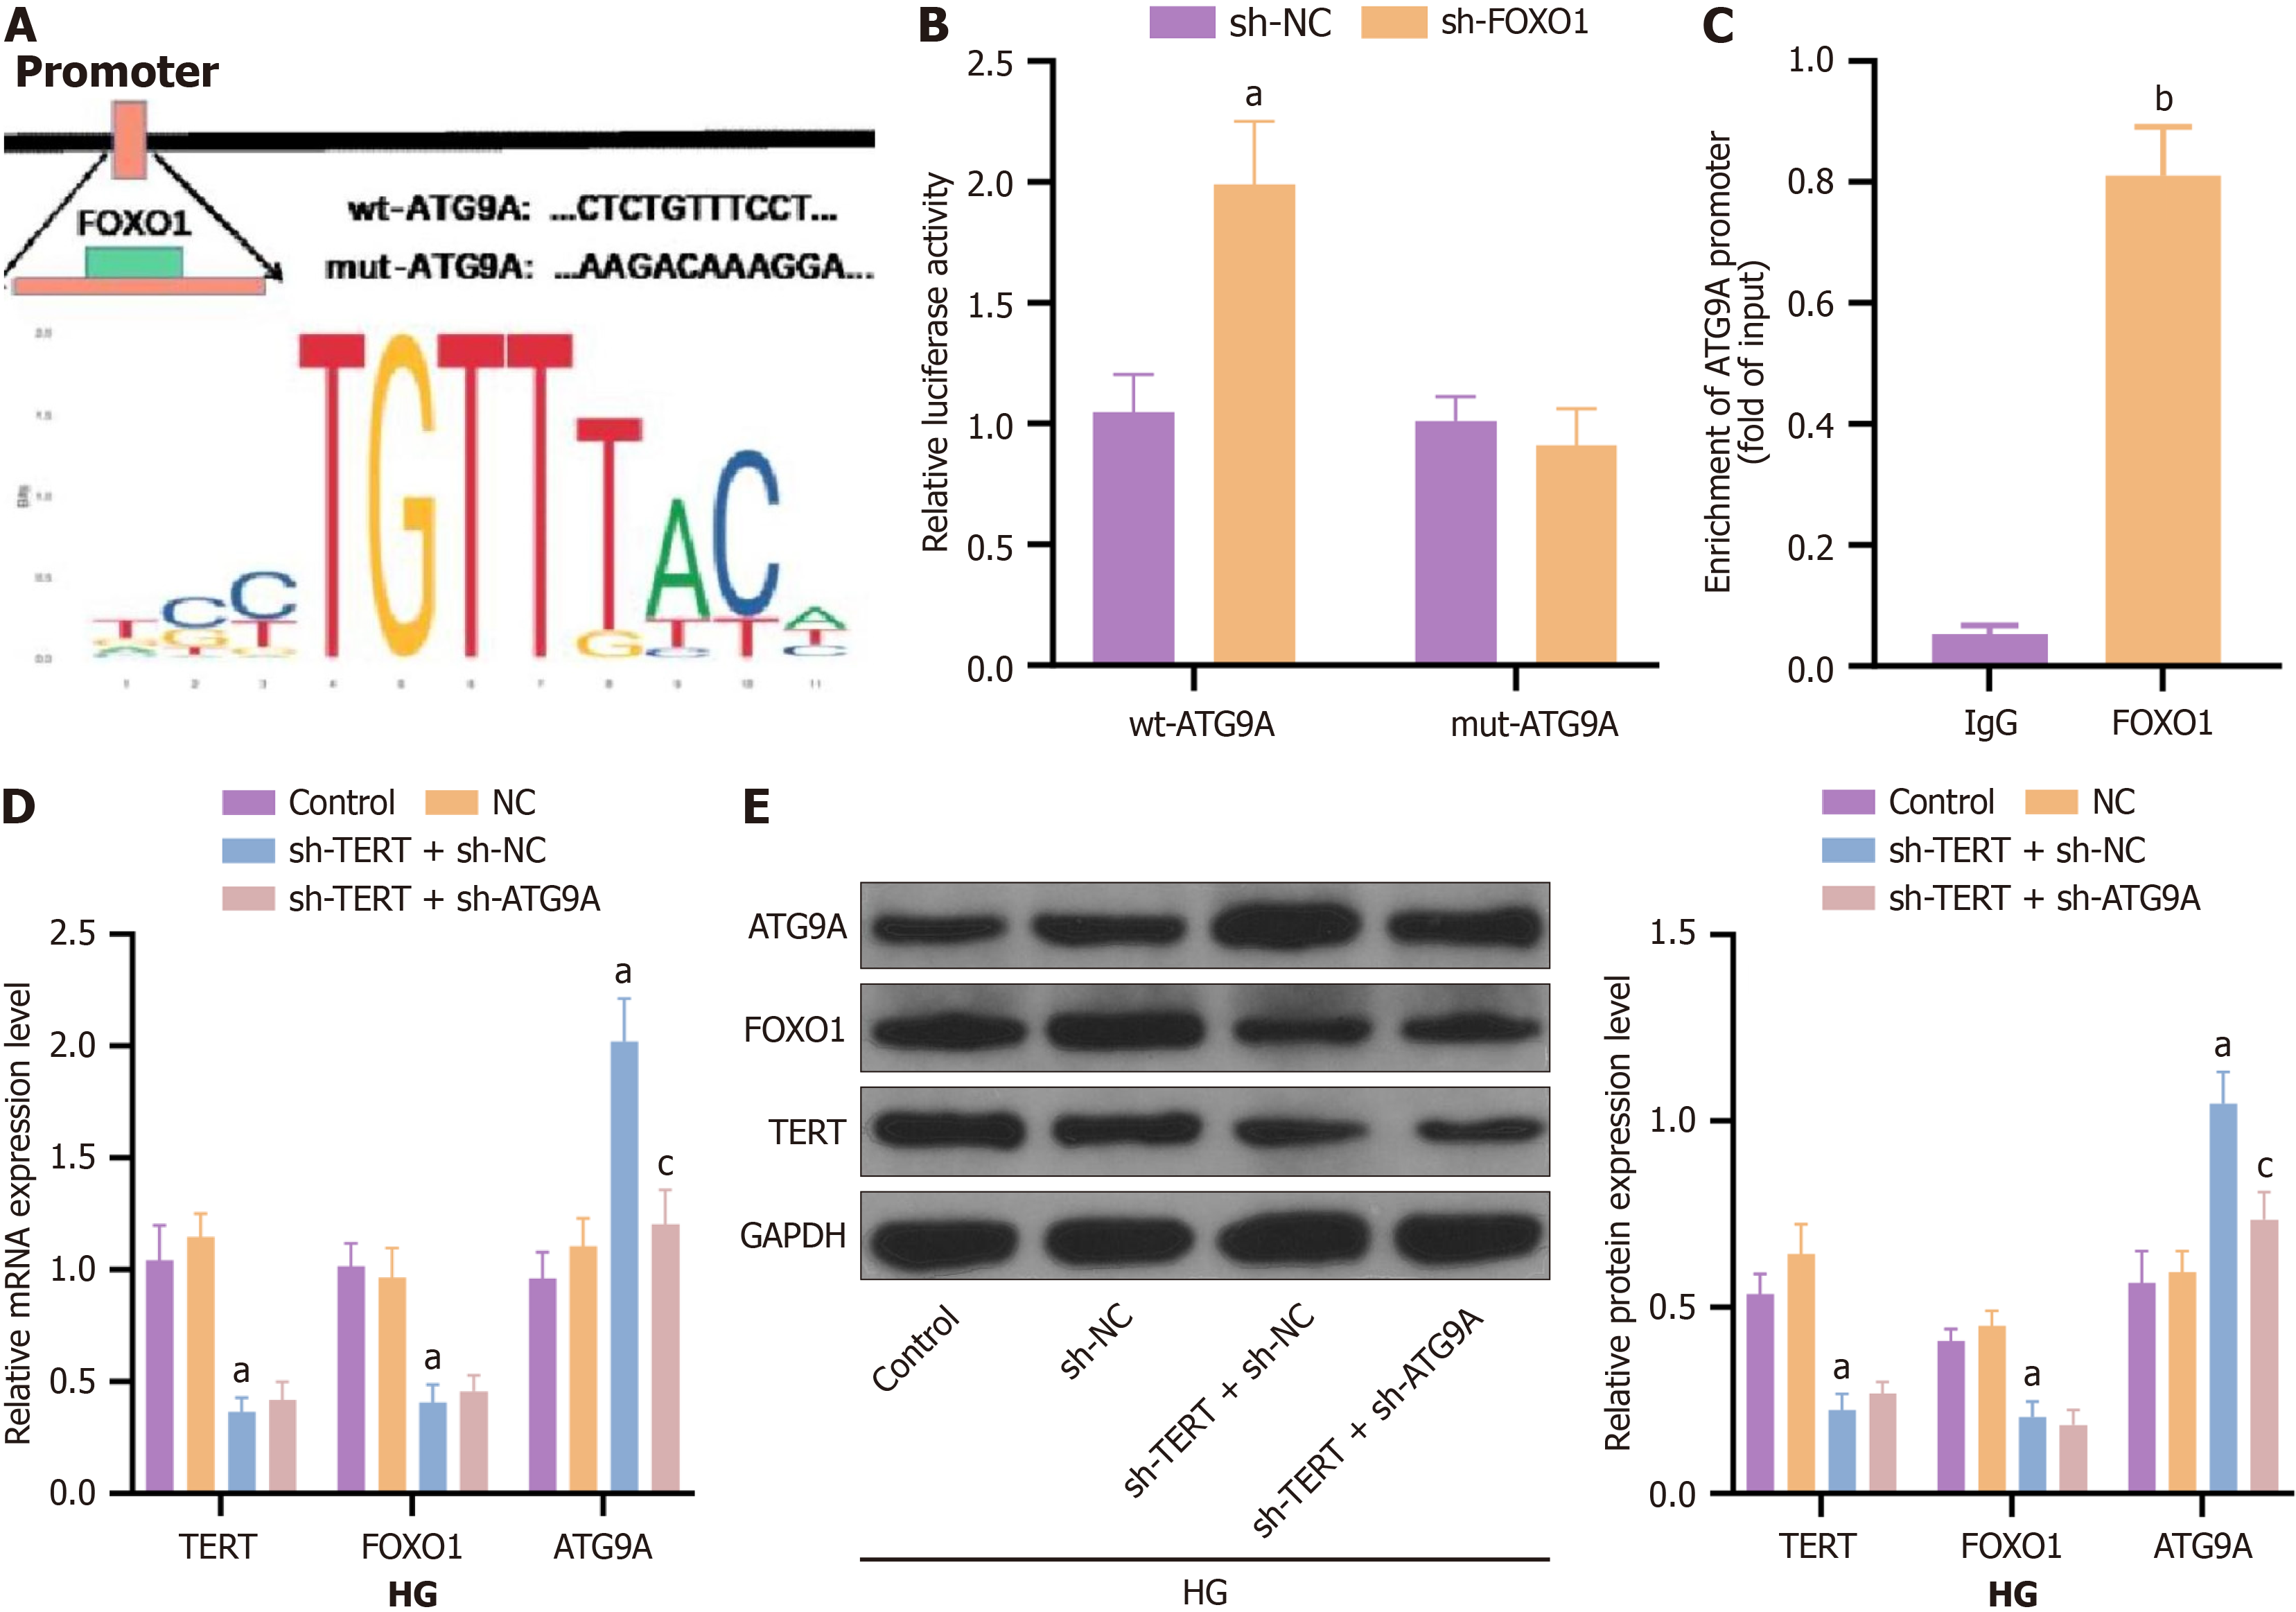
Figure 4 TERT activates FOXO1 transcription to inhibit ATG9A expression.
A: JASPAR was used to analyze the binding of FOXO1 to the ATG9A promoter; B and C: Dual-luciferase reporter gene and ChIP assays were used to verify the targeting of FOXO1 to ATG9A; D and E: Reverse transcription quantitative polymerase chain reaction and western blotting were used to analyze the expression of TERT, FOXO1 and ATG9A in cells after the cells were transfected with sh-TERT or/and sh-ATG9A. The data are expressed as mean ± SD. Each experiment was conducted in triplicate. aP < 0.05 vs sh-NC, IgG, and NC groups, bP < 0.05 vs sh-NC, IgG, and NC groups, cP < 0.05 vs sh-TERT + sh-NC group. HG: High glucose.
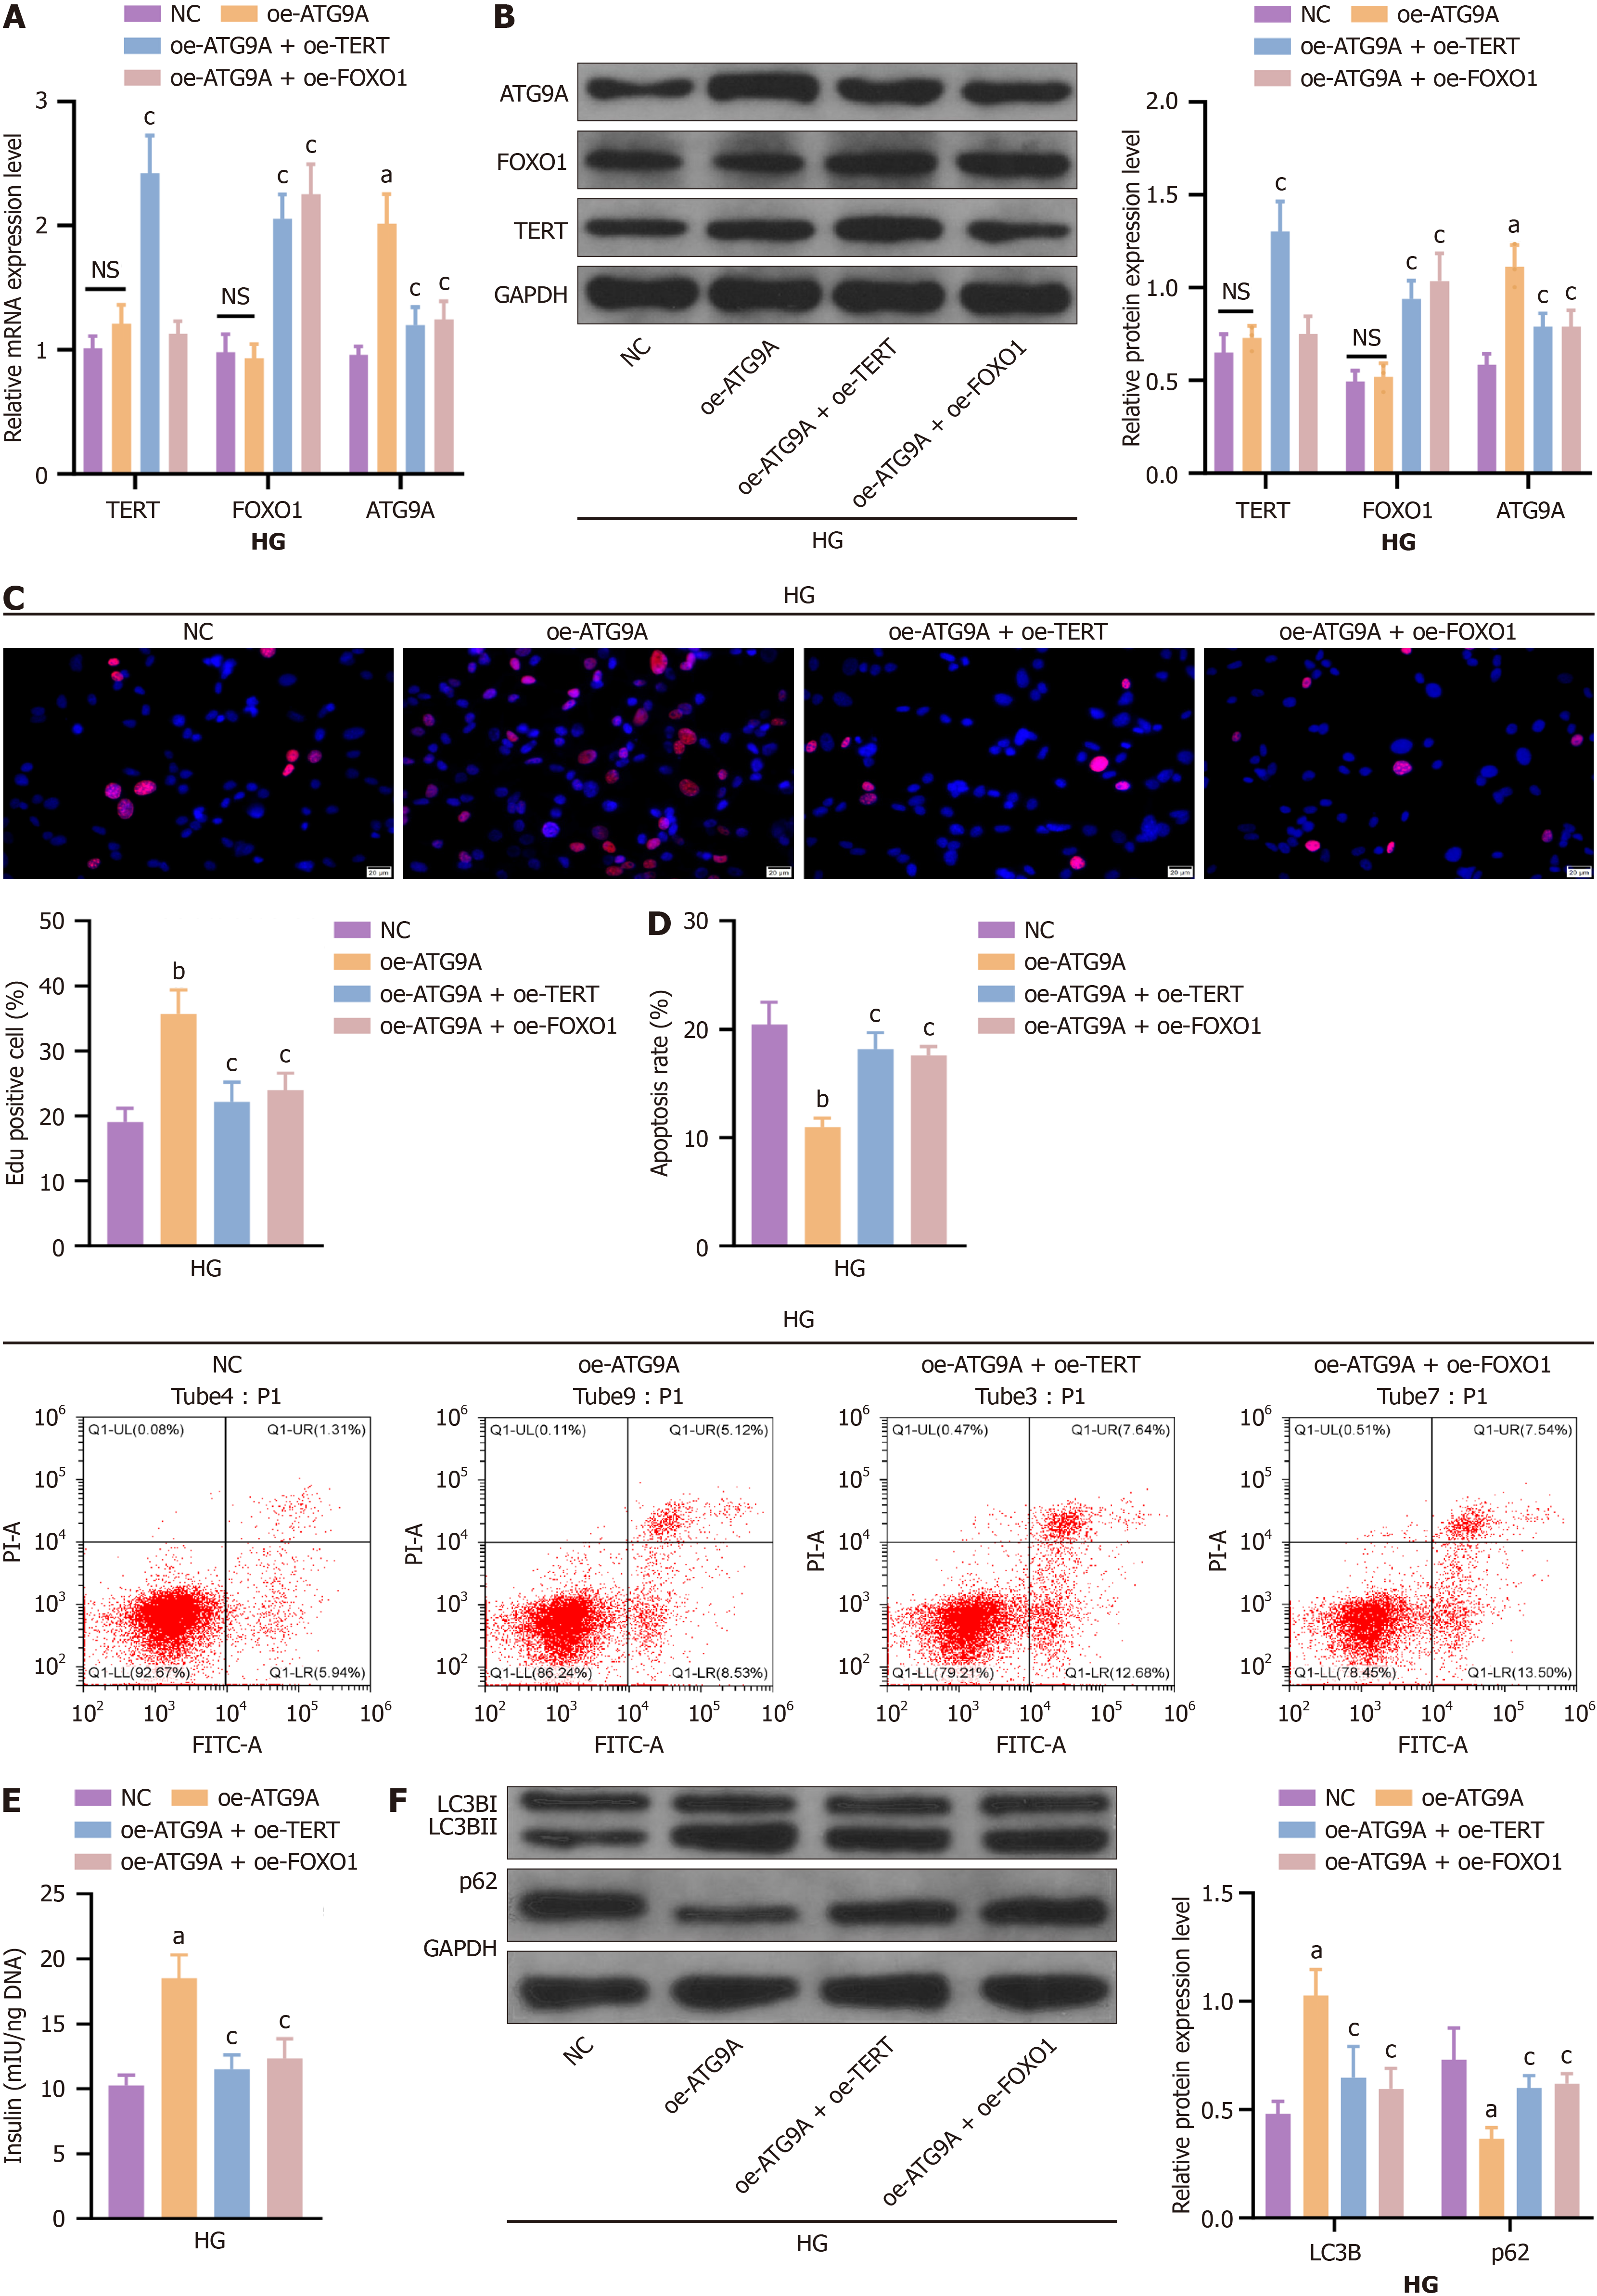
Figure 5 TERT/FOXO1 suppresses ATG9A-mediated autophagy to increase high glucose-induced islet β-cell dysfunction.
oe-ATG9A was transfected or cotransfected with oe-TERT and oe-FOXO1 into high glucose-treated MIN6 cells. A and B: Reverse transcription quantitative polymerase chain reaction and western blotting were used to analyze TERT, FOXO1 and ATG9A mRNA and protein expression; C: EdU staining was used to analyze cell proliferation ability (red staining: the labeled proliferating cells, blue staining: the nuclei); D: Flow cytometry was used to assess the cell apoptosis rate; E: Insulin levels were measured via ELISAs; F: The expression of the autophagy proteins LC3B and p62 was analyzed via western blotting. The data are expressed as mean ± SD. Each experiment was conducted in triplicate. aP < 0.05 vs NC group, bP < 0.05 vs NC group, cP < 0.05 vs the oe-ATG9A group. NS: No significance; HG: High glucose.
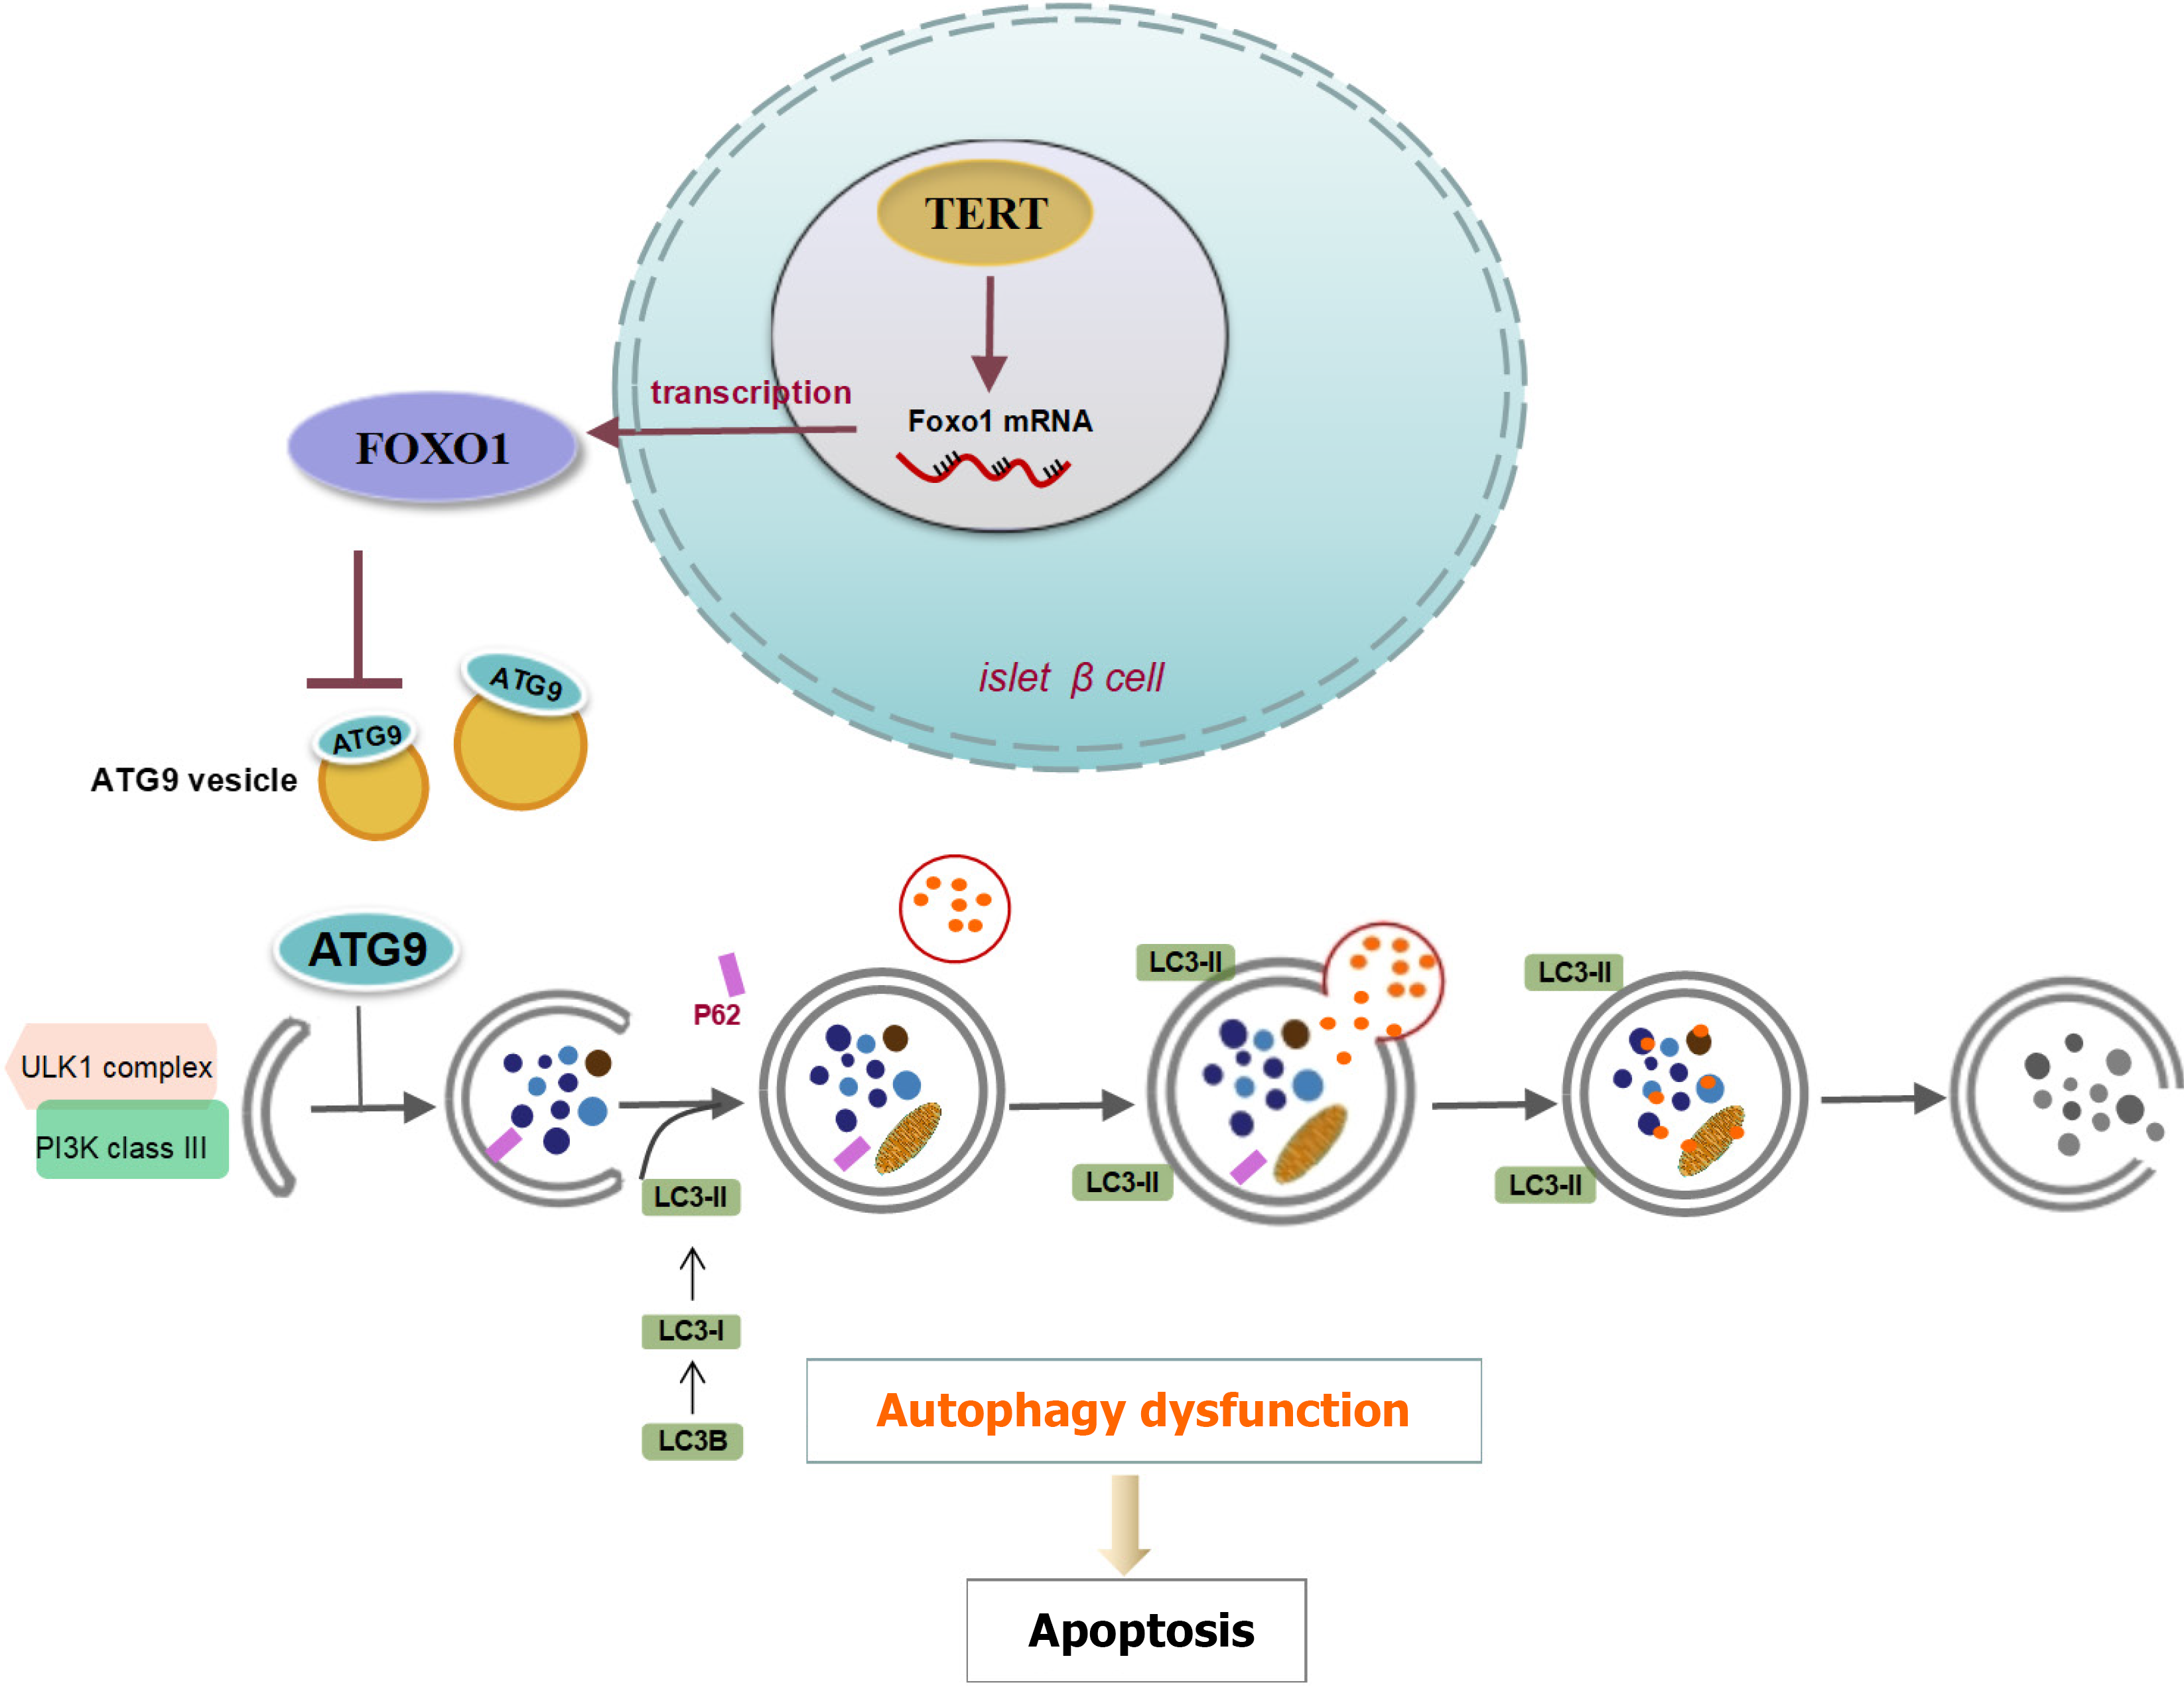
Figure 6 Par-4/TET/FOXO1 and autophagy dysfunction/apoptosis of islet β cells.
Par-4 inhibits TERT interact with FOXO1 after nuclear entry, suppresses its expression at the transcriptional level, induces autophagy dysfunction, and leads to islet β cell apoptosis.
- Citation: Lei XT, Chen XF, Qiu S, Tang JY, Geng S, Yang GY, Wu QN. TERT/FOXO1 signaling promotes islet β-cell dysfunction in type 2 diabetes mellitus by regulating ATG9A-mediated autophagy. World J Diabetes 2025; 16(5): 102994
- URL: https://www.wjgnet.com/1948-9358/full/v16/i5/102994.htm
- DOI: https://dx.doi.org/10.4239/wjd.v16.i5.102994


