Copyright
©The Author(s) 2025.
World J Diabetes. May 15, 2025; 16(5): 102141
Published online May 15, 2025. doi: 10.4239/wjd.v16.i5.102141
Published online May 15, 2025. doi: 10.4239/wjd.v16.i5.102141
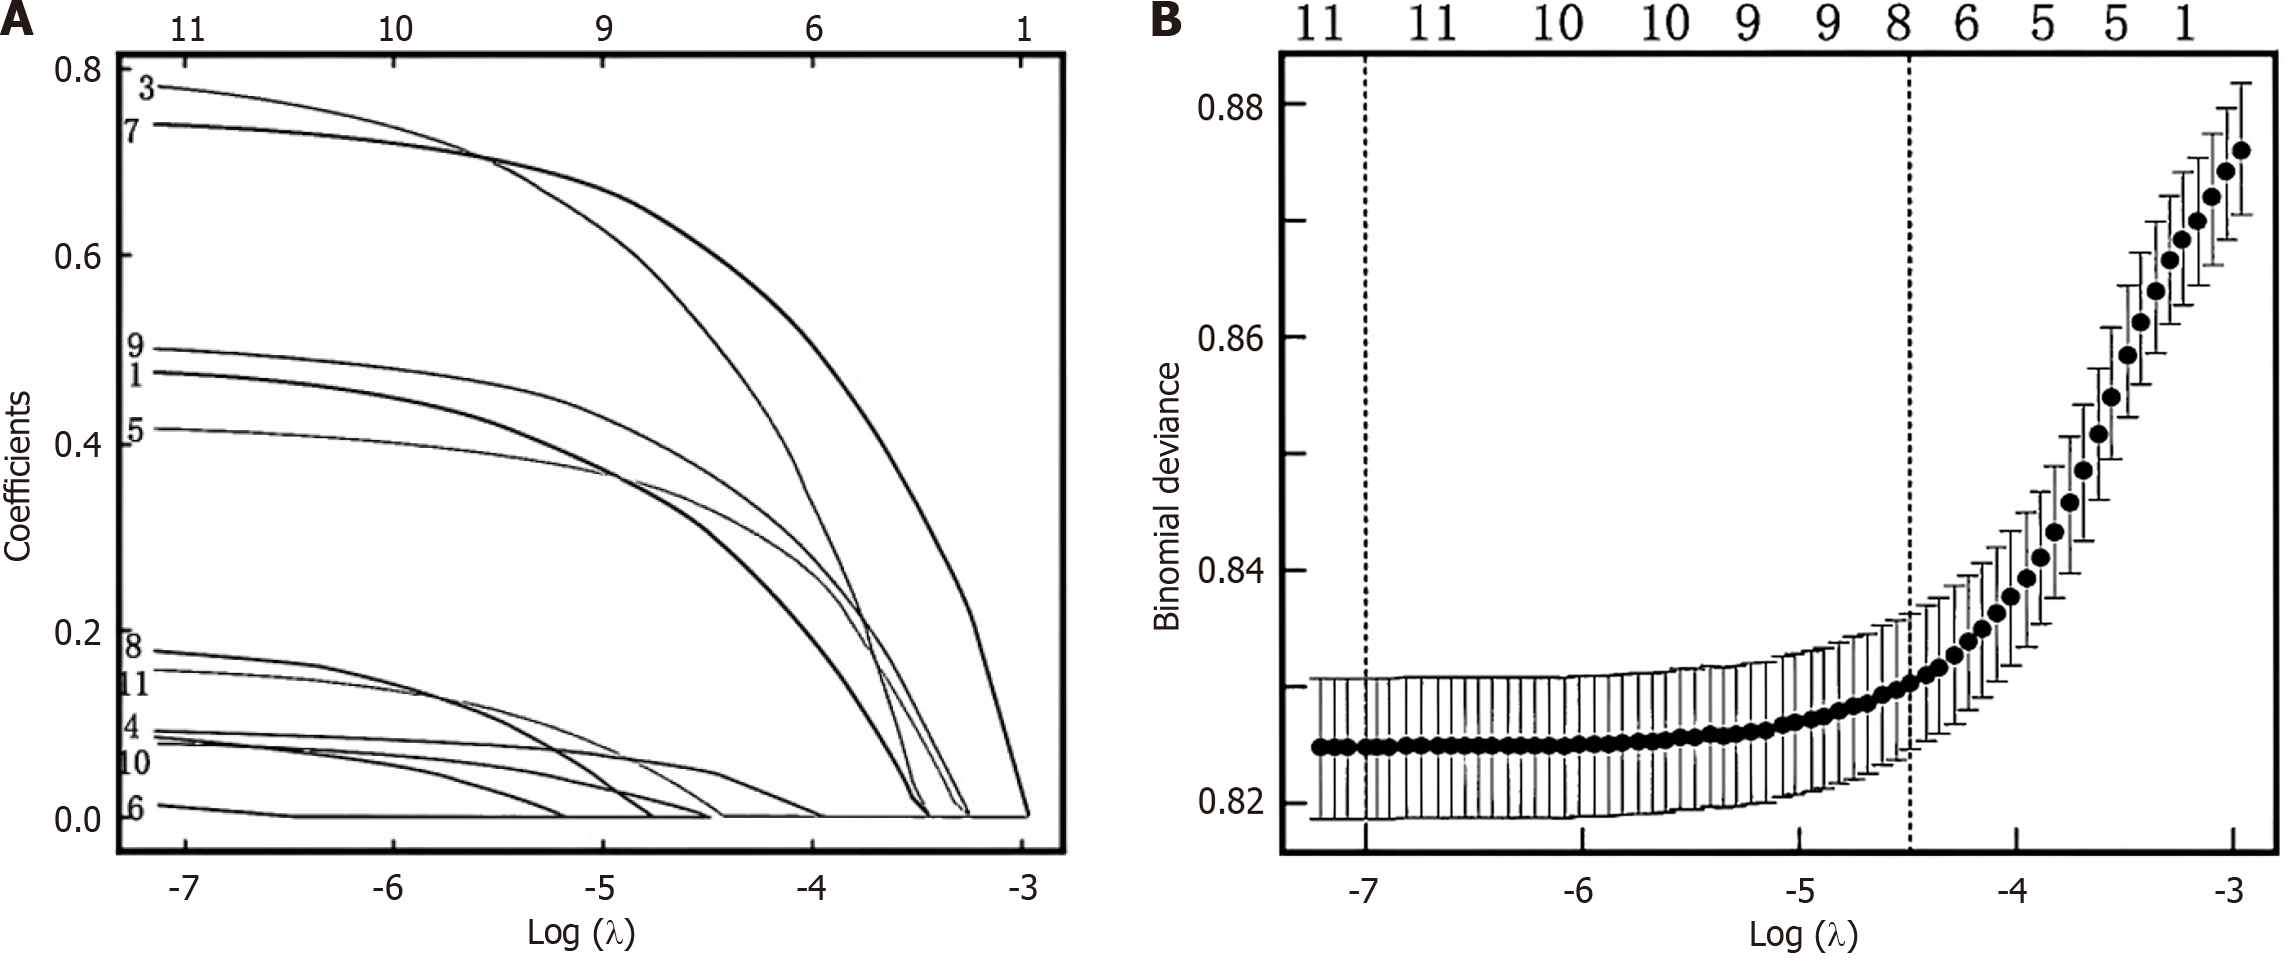
Figure 1 Screening of predictor variables using the LASSO regression model.
A: Distribution of the LASSO coefficients of predictor factors; B: Selection of the optimal parameter λ in the LASSO model).
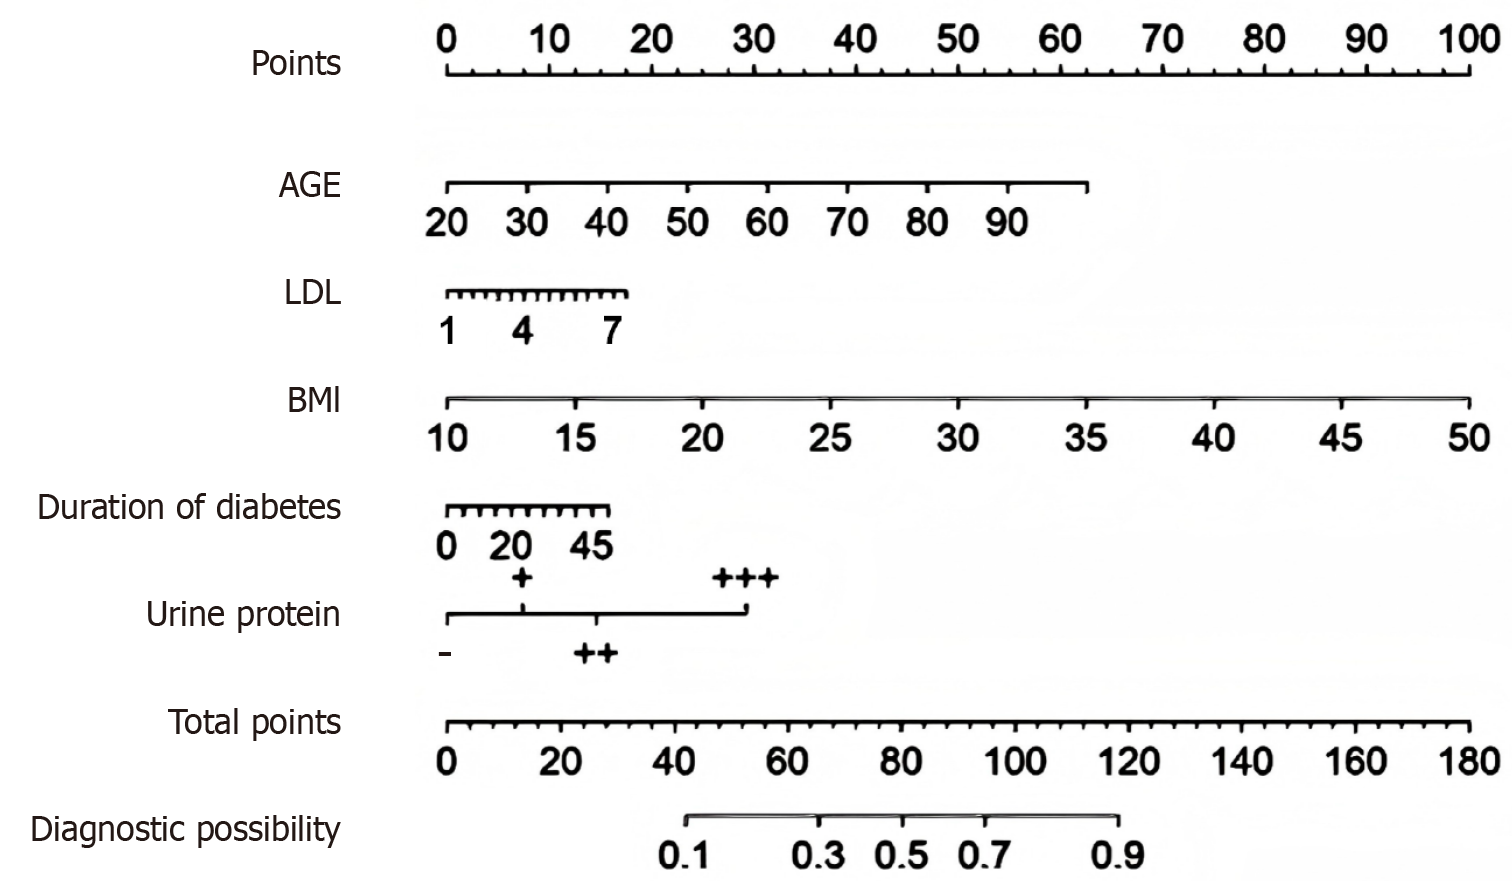
Figure 2 Risk prediction nomogram.
LDL: Low-density lipoprotein; BMI: Body mass index.
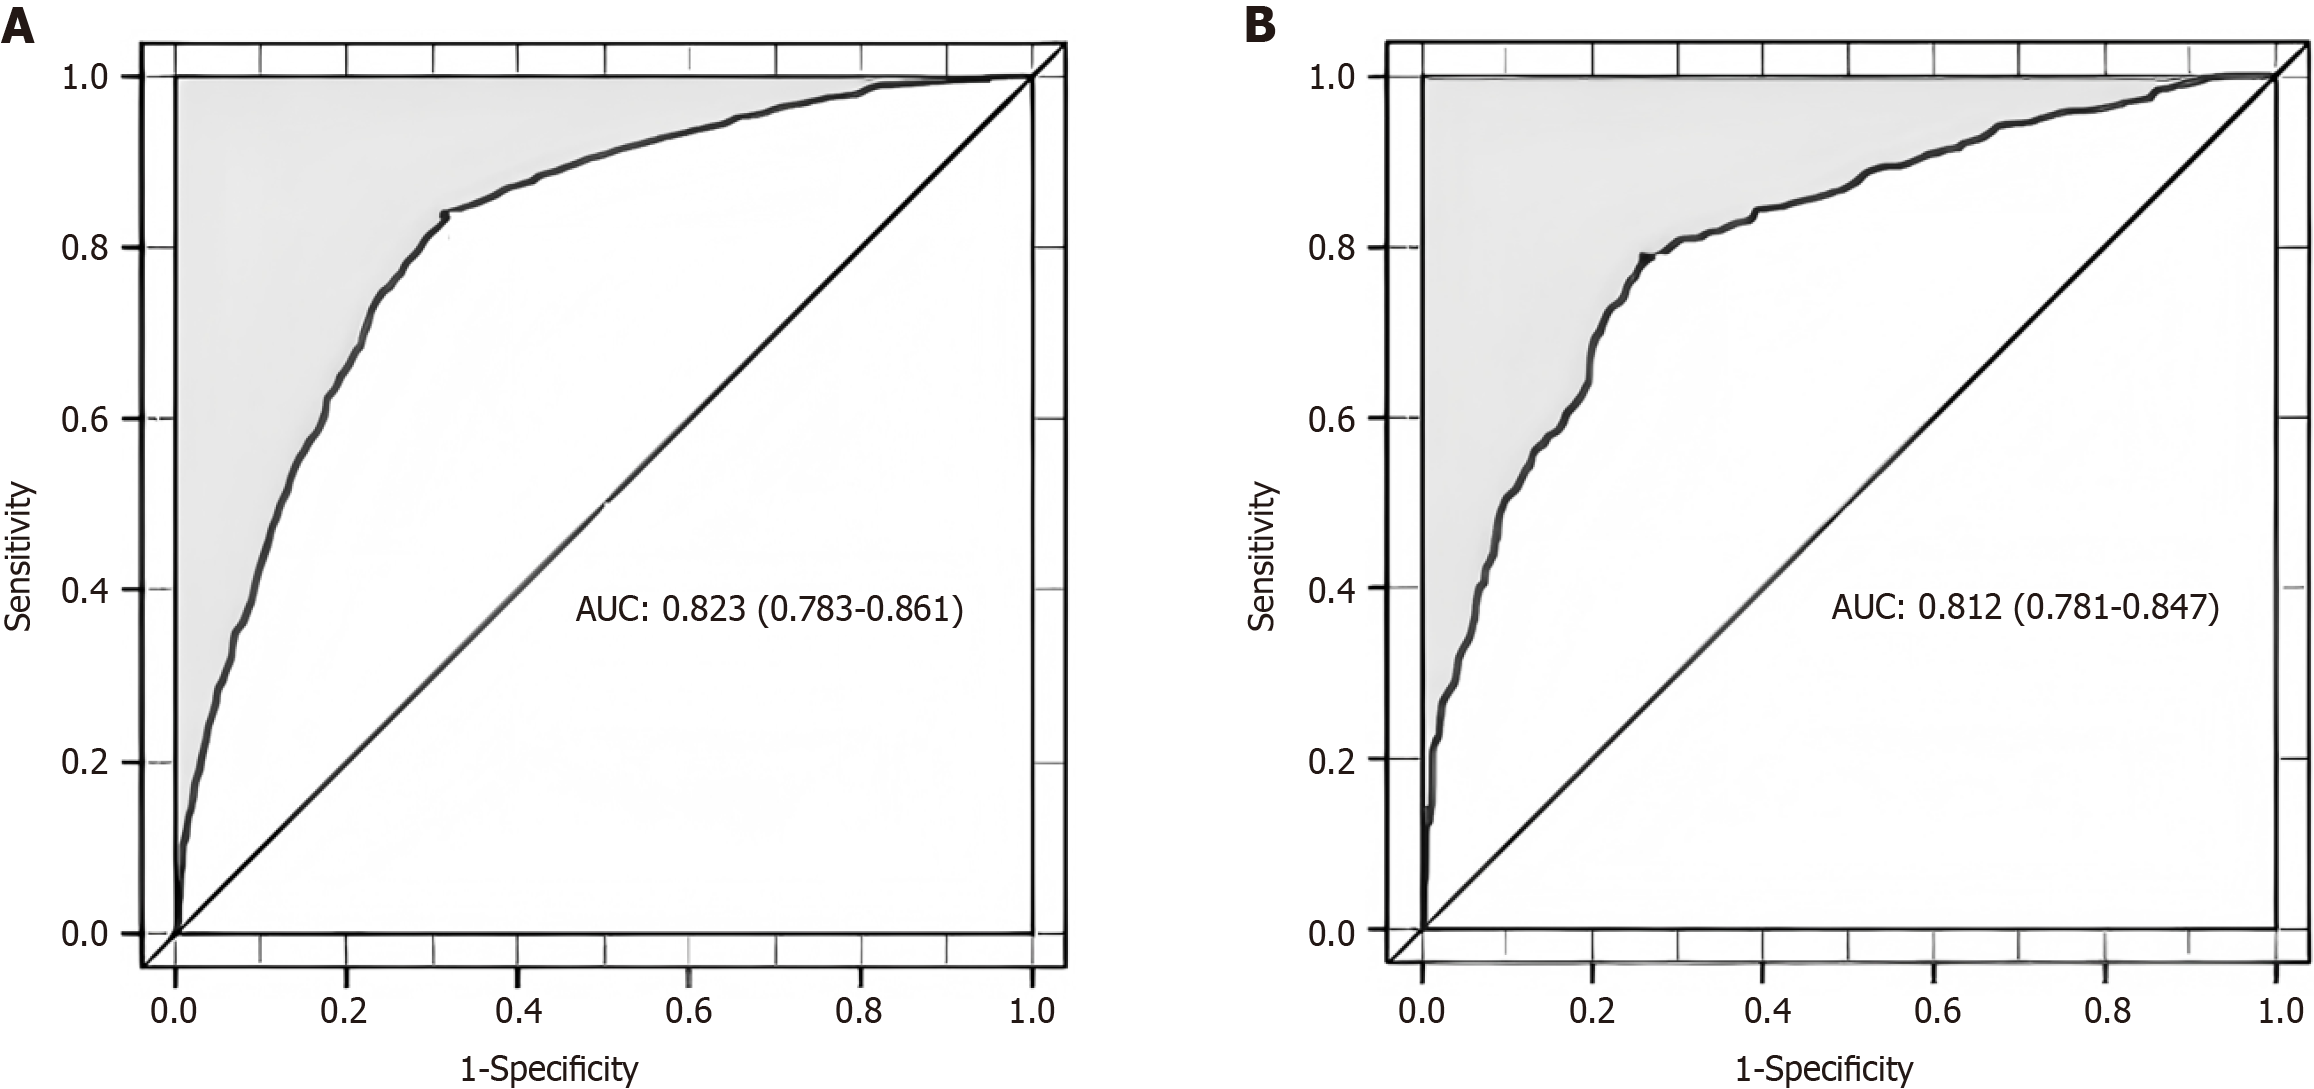
Figure 3 receiver operating characteristic curve of diabetes with hypertension risk.
A: Training group, B: Validation group. AUC: Area under the receiver operating characteristic curve.
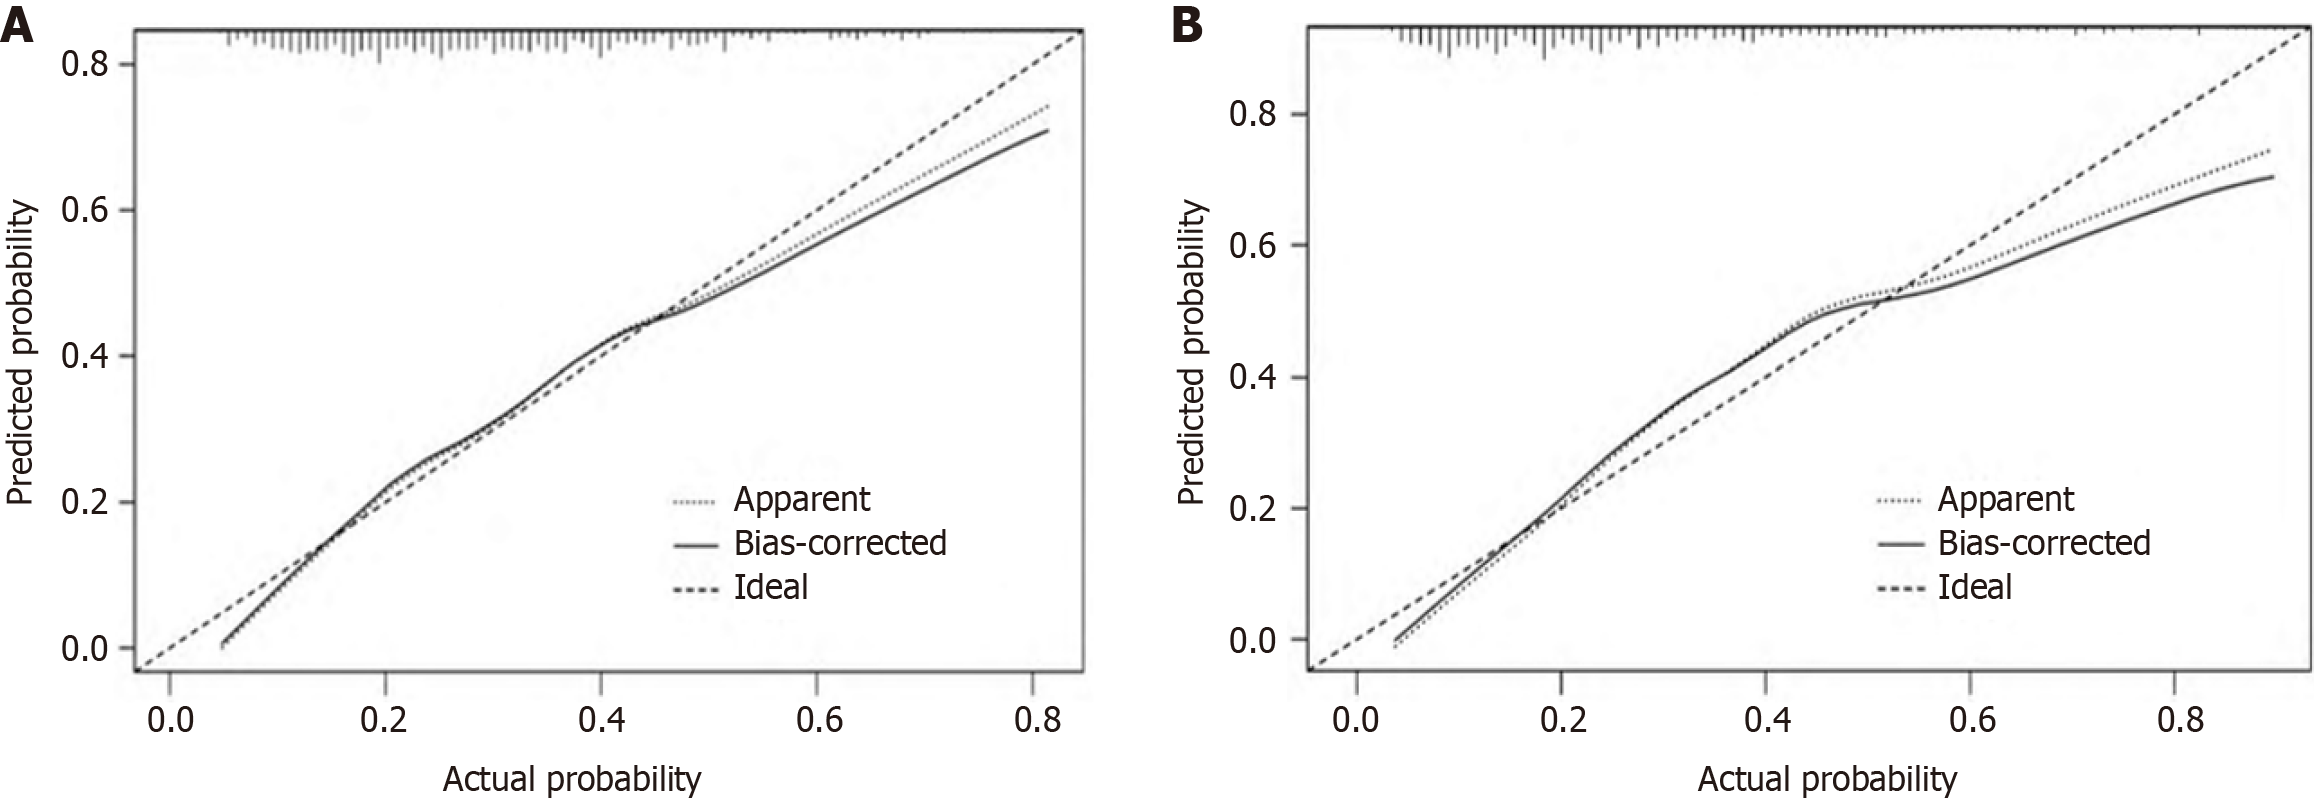
Figure 4 Calibration curve of the nomogram for predicting diabetes with hypertension risk.
A: Training group, B: Validation group.
Figure 5
Decision curve of diabetes with hypertension nomogram prediction model.
- Citation: Zhao JY, Dou JQ, Chen MW. Construction of a risk prediction model for hypertension in type 2 diabetes: Independent risk factors and nomogram. World J Diabetes 2025; 16(5): 102141
- URL: https://www.wjgnet.com/1948-9358/full/v16/i5/102141.htm
- DOI: https://dx.doi.org/10.4239/wjd.v16.i5.102141


