Copyright
©The Author(s) 2025.
World J Diabetes. Mar 15, 2025; 16(3): 98590
Published online Mar 15, 2025. doi: 10.4239/wjd.v16.i3.98590
Published online Mar 15, 2025. doi: 10.4239/wjd.v16.i3.98590
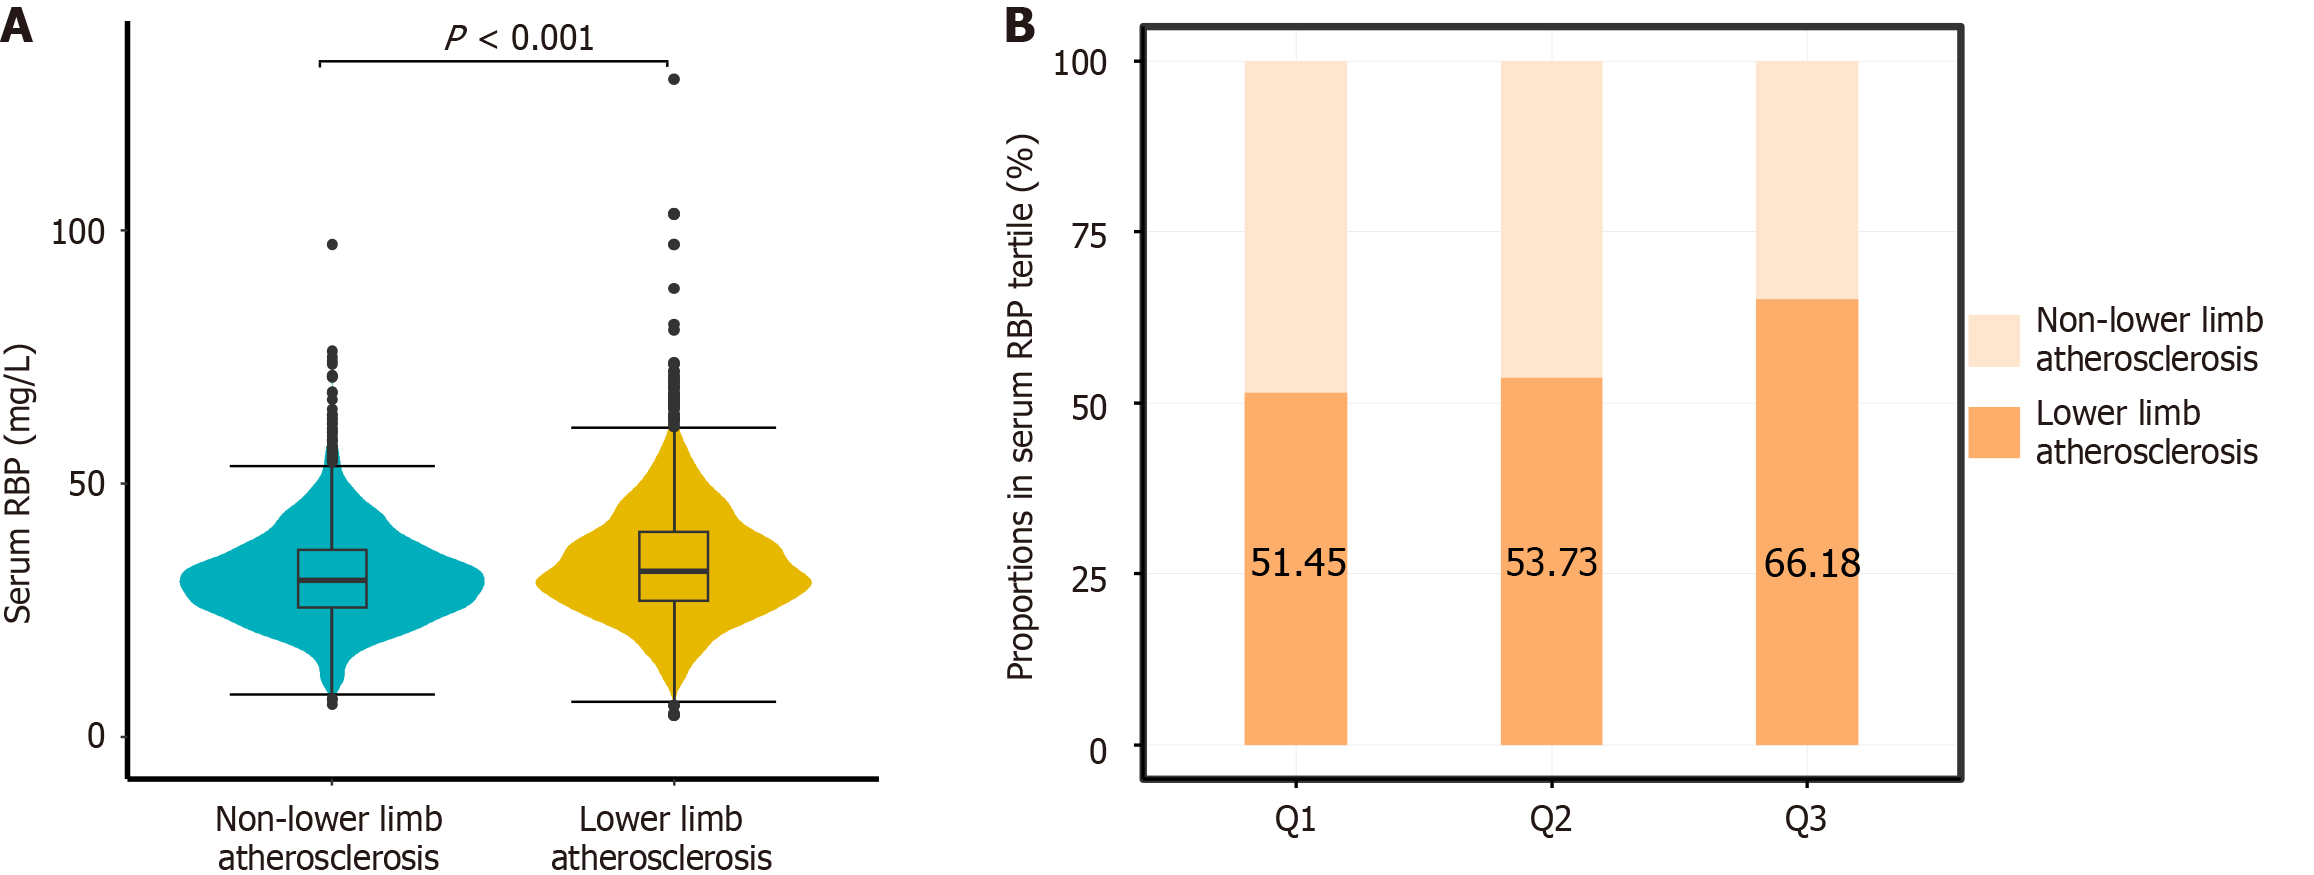
Figure 1 Serum retinol-binding protein levels and retinol-binding protein tertile proportions in lower limb atherosclerosis and non-lower limb atherosclerosis patients with type 2 diabetes mellitus.
A: Comparison of serum retinol-binding protein levels in the non-lower limb atherosclerosis and lower limb atherosclerosis group type 2 diabetes mellitus patients; B: Percentage of type 2 diabetes mellitus patients with lower limb atherosclerosis in different serum retinol-binding protein tertiles. RBP: Retinol-binding protein.
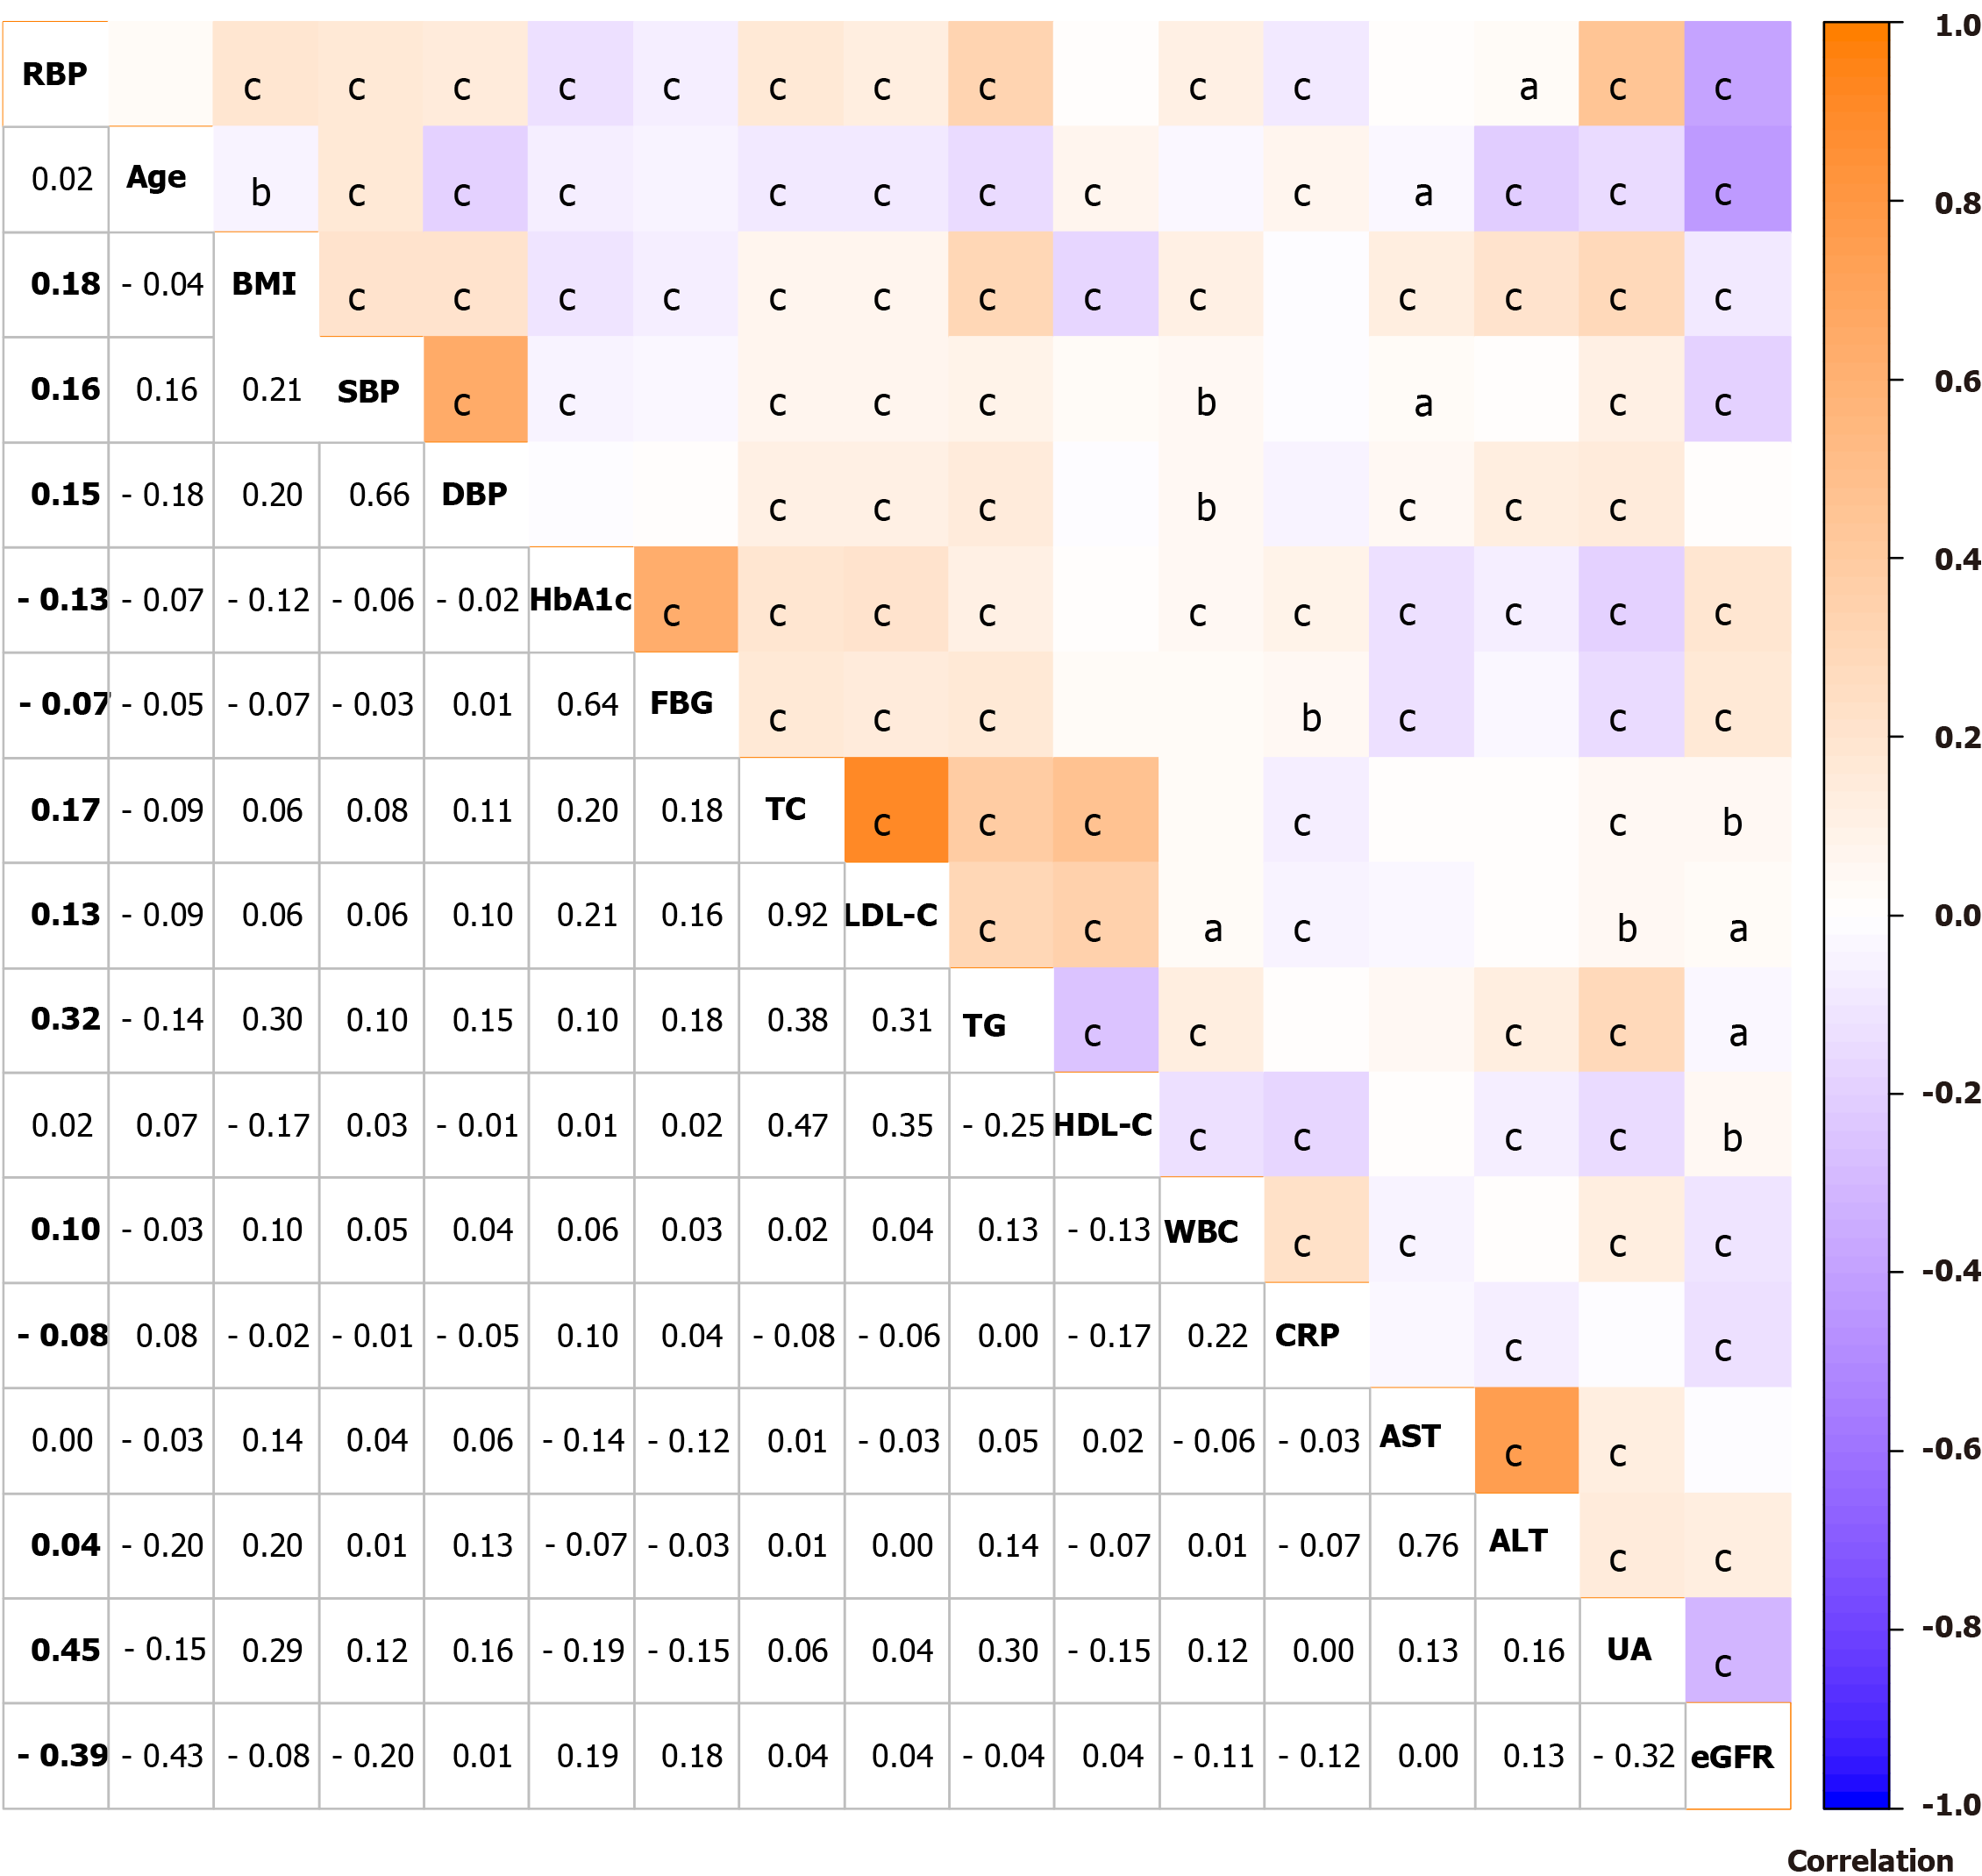
Figure 2 Correlation between serum retinol-binding protein level and type 2 diabetes mellitus patient clinical indicators.
Orange indicates a positive correlation, whereas blue indicates a negative correlation. aP < 0.05; bP < 0.01; cP < 0.001. RBP: Retinol-binding protein; BMI: Body mass index; SBP: Systolic blood pressure; DBP: Diastolic blood pressure; HbA1c: Glycated hemoglobin; FBG: Fasting blood glucose; TC: Total cholesterol; LDL-C: Low-density lipoprotein cholesterol; TG: Triglycerides; HDL-C: High-density lipoprotein cholesterol; WBC: White blood cell; CRP: C-reactive protein; AST: Aspartate aminotransferase; ALT: Alanine aminotransferase; UA: Uric acid; eGFR: Estimated glomerular filtration rate.
Figure 3 Dose-response relationship between serum retinol-binding protein level and lower limb atherosclerosis risk in type 2 diabetes mellitus patients.
OR: Odds ratio; CI: Confidence interval; RBP: Retinol-binding protein.
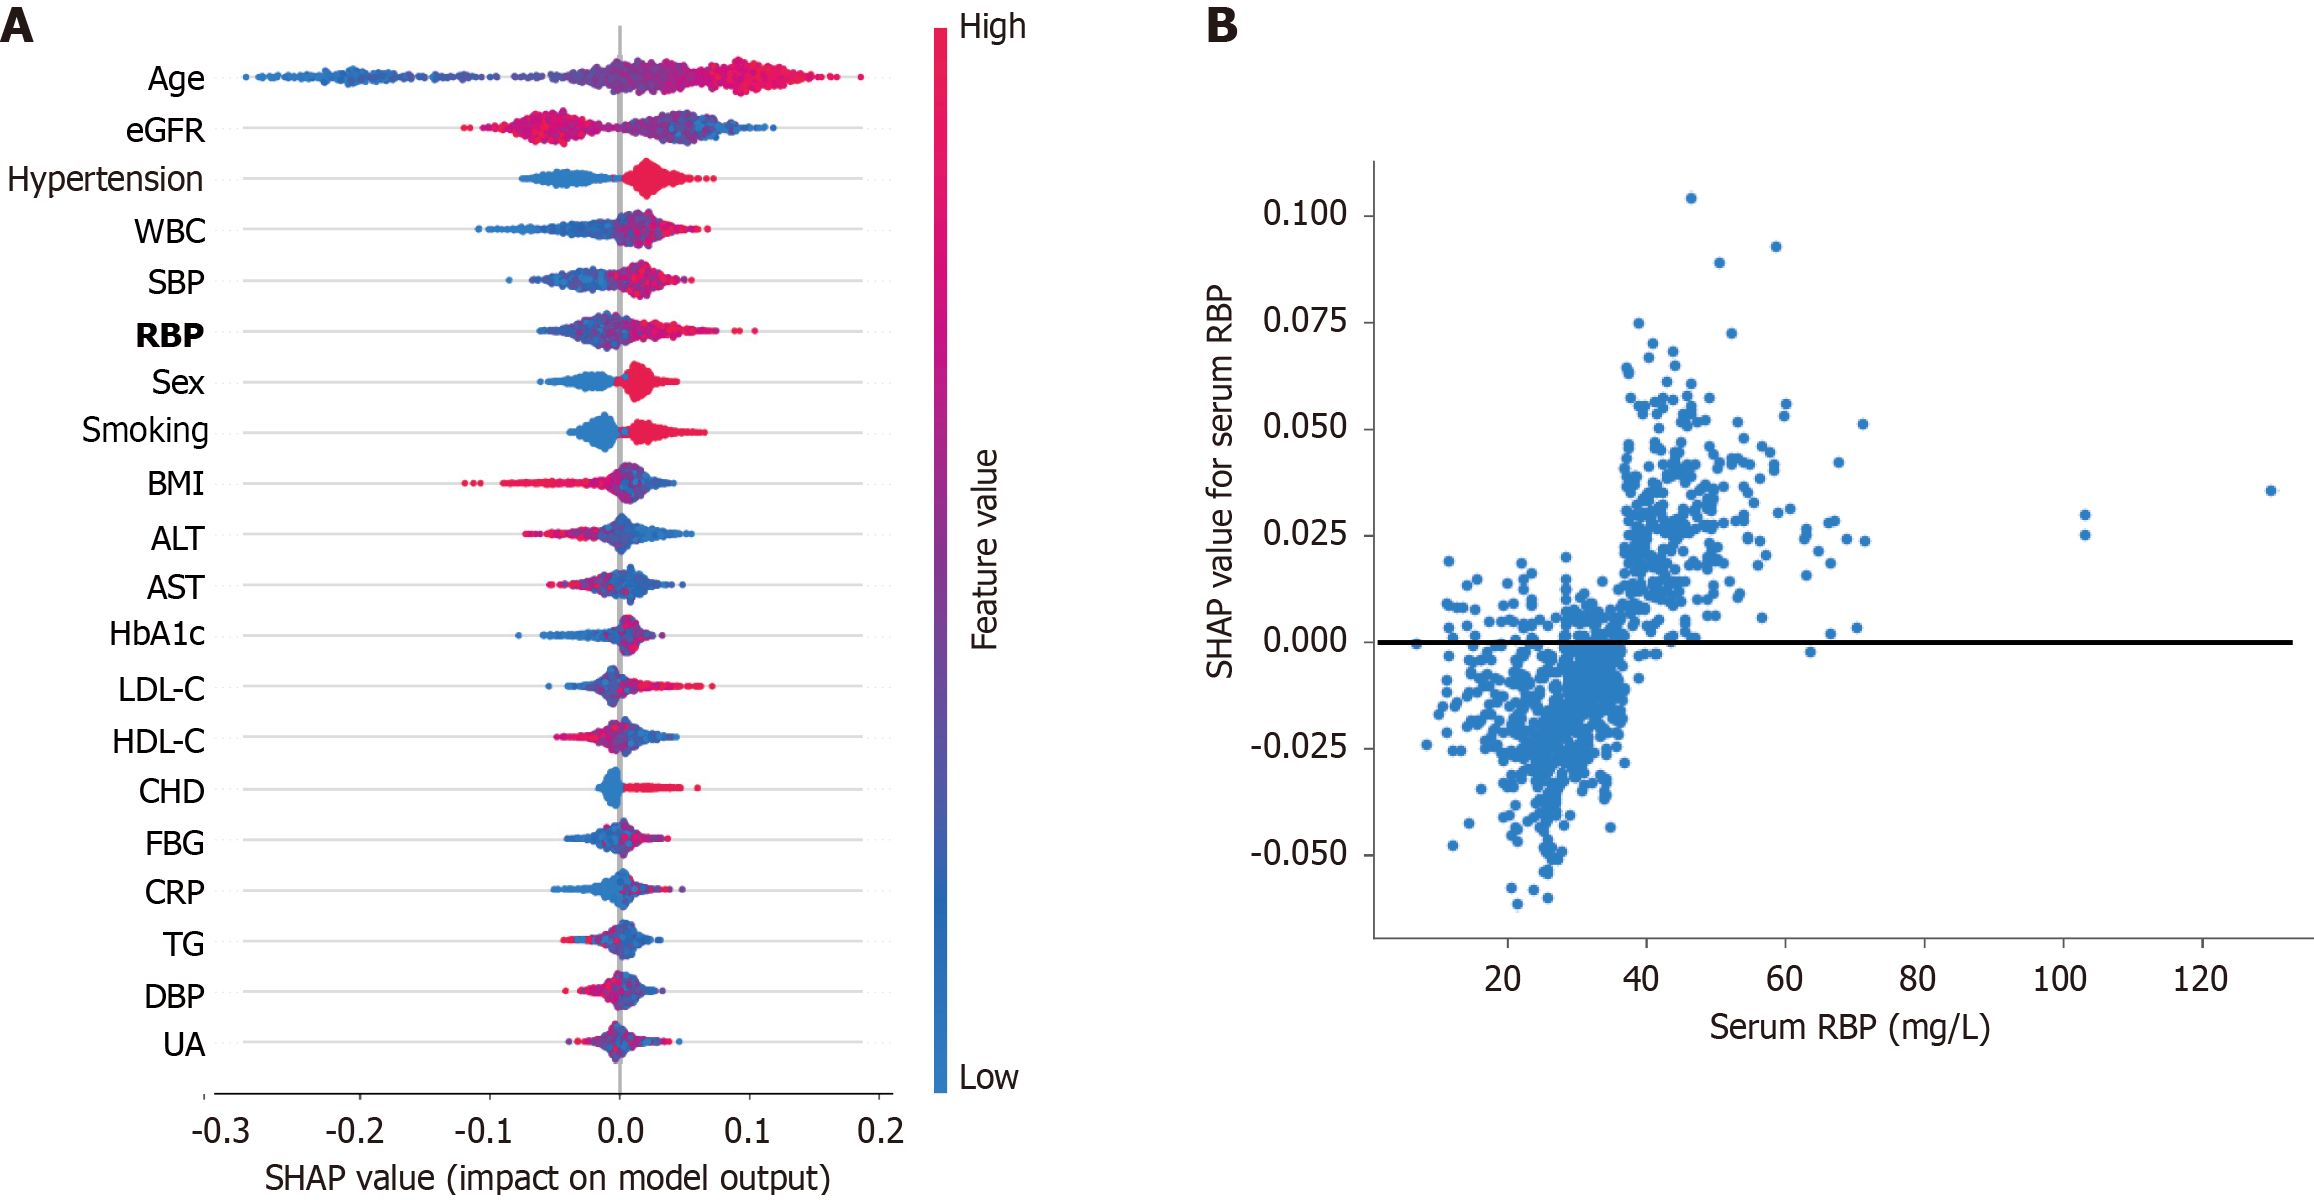
Figure 4 Shapley Additive Explanations analysis results of the random forest model.
A: Shapley Additive Explanations (SHAP) summary plot. The X-axis represents the SHAP value and the Y-axis represents the feature contributions ranked by importance. The higher the SHAP value, the greater the risk of lower limb atherosclerosis. A pink dot indicates a higher predicted value and a blue dot indicates a lower predicted value; B: SHAP force plot. eGFR: Estimated glomerular filtration rate; WBC: White blood cell count; SBP: Systolic blood pressure; RBP: Retinol-binding protein; BMI: Body mass index; ALT: Alanine aminotransferase; AST: Aspartate aminotransferase; HbA1c: Glycated hemoglobin; LDL-C: Low-density lipoprotein cholesterol; HDL-C: High-density lipoprotein cholesterol; CHD: Coronary heart disease; FBG: Fasting blood glucose; CRP: C-reactive protein; TG: Triglycerides; DBP: Diastolic blood pressure; UA: Uric acid; SHAP: Shapley Additive Explanations.
- Citation: Zhang YL, Peng GL, Leng WL, Lian Y, Cheng LQ, Li X, Wang YL, Zhou L, Long M. Association between serum retinol-binding protein and lower limb atherosclerosis risk in type 2 diabetes mellitus. World J Diabetes 2025; 16(3): 98590
- URL: https://www.wjgnet.com/1948-9358/full/v16/i3/98590.htm
- DOI: https://dx.doi.org/10.4239/wjd.v16.i3.98590


