©The Author(s) 2025.
World J Diabetes. Mar 15, 2025; 16(3): 95092
Published online Mar 15, 2025. doi: 10.4239/wjd.v16.i3.95092
Published online Mar 15, 2025. doi: 10.4239/wjd.v16.i3.95092
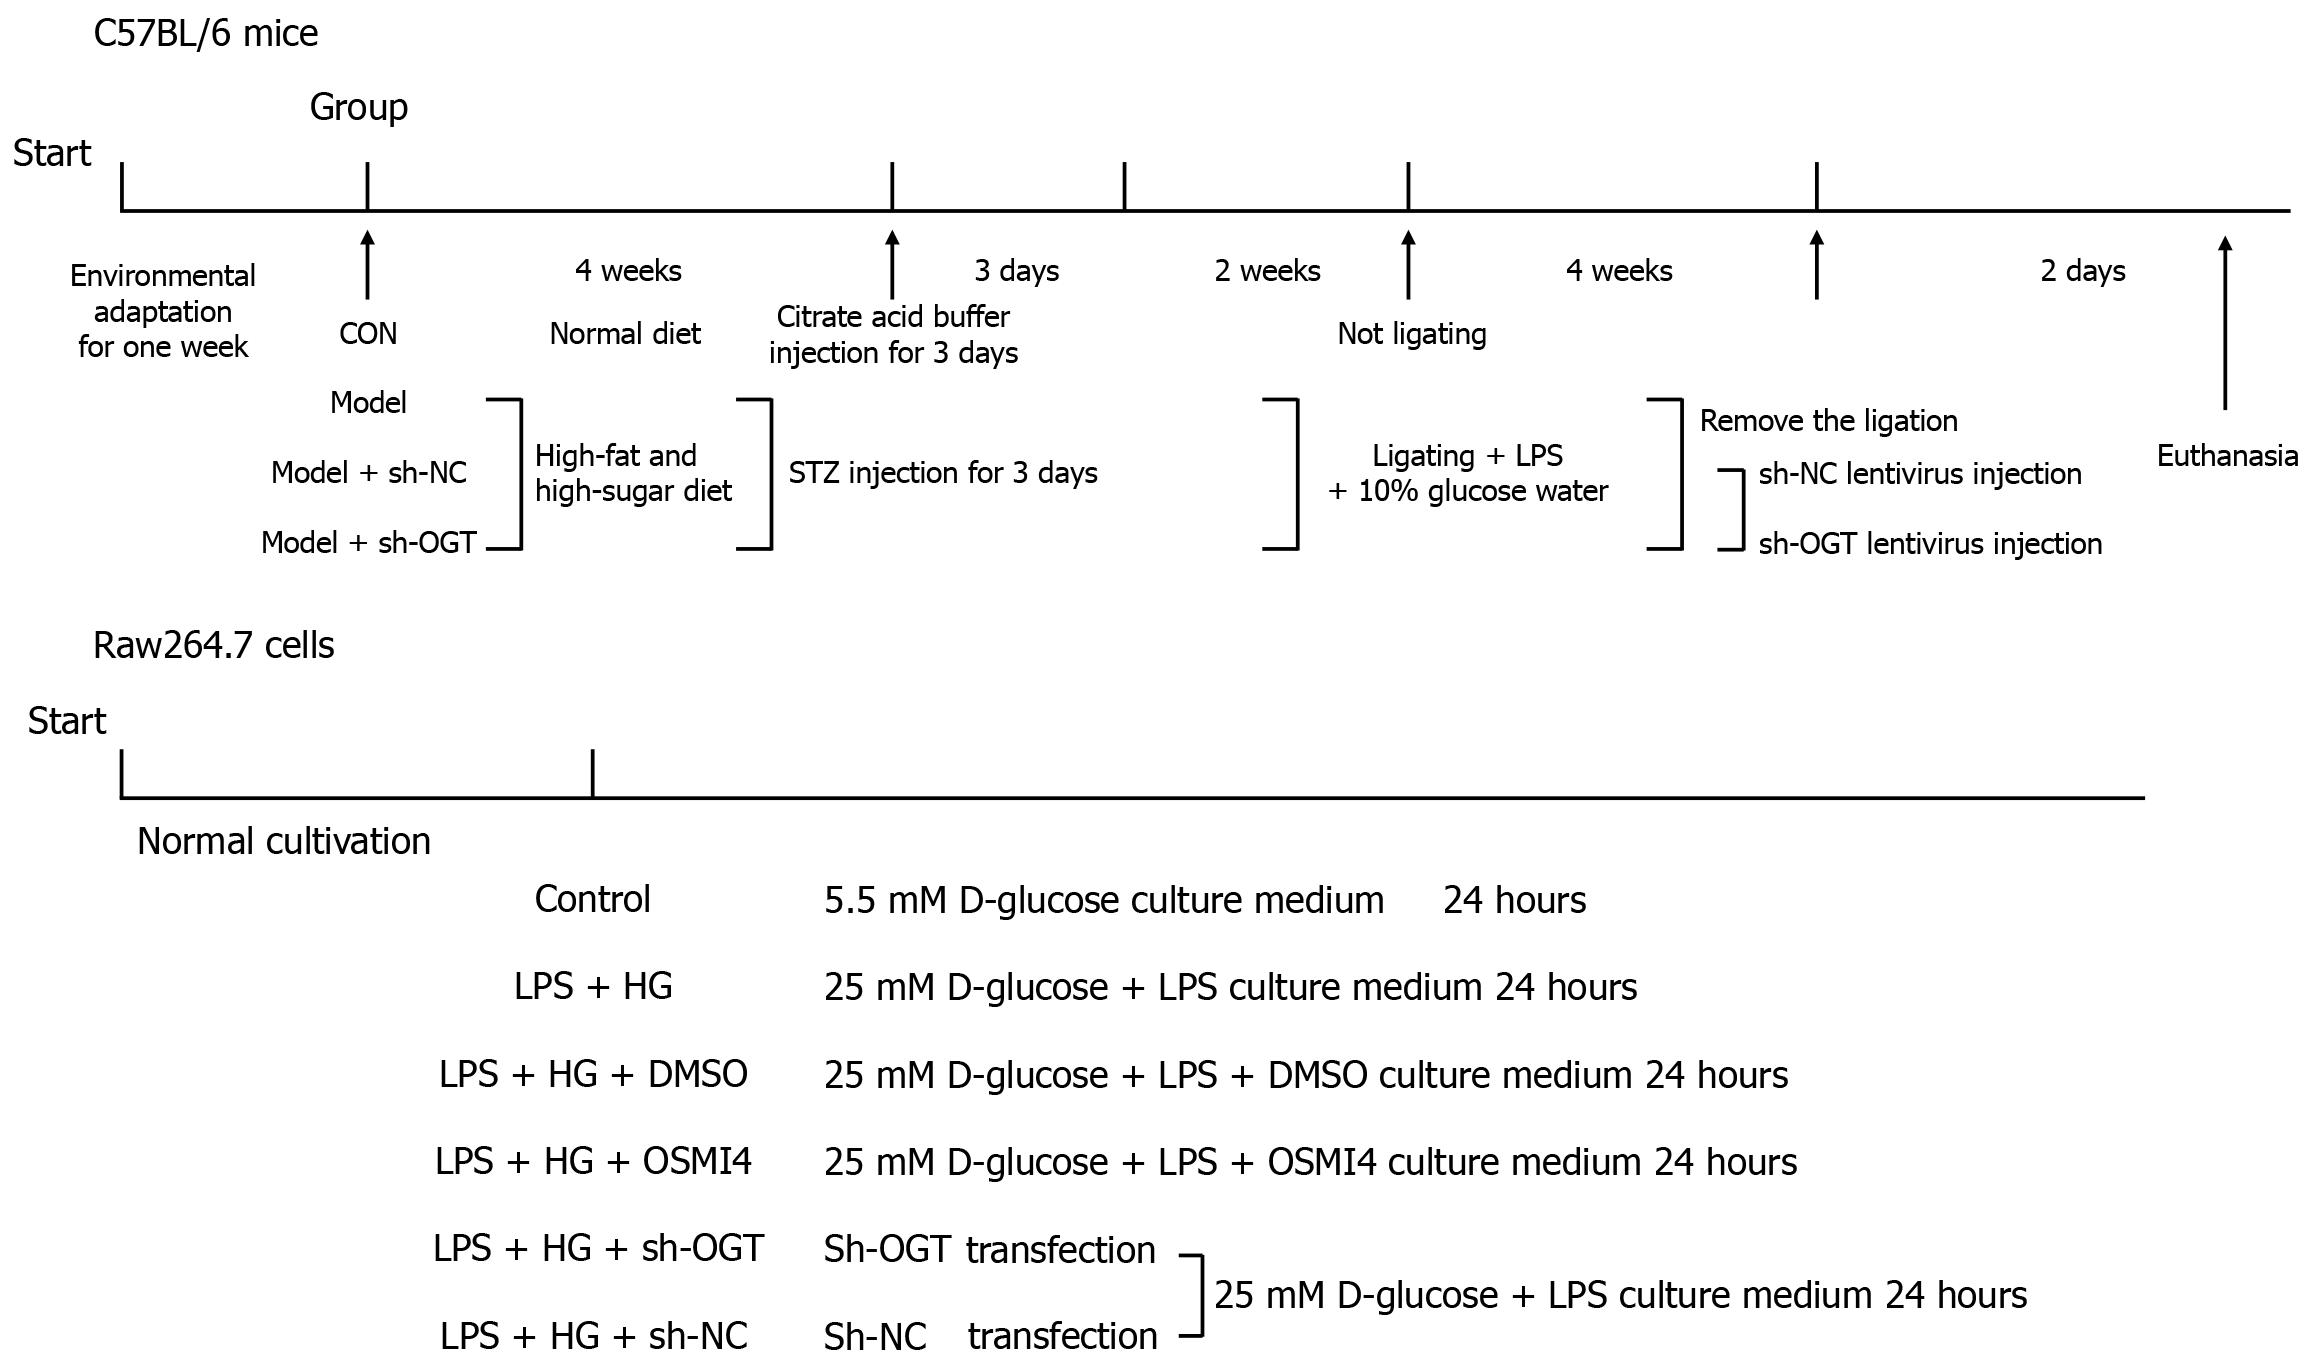
Figure 1 Design of in vivo and in vitro experiments.
CON: Control; sh-NC: Short hairpin RNA-negative control; sh-OGT: Short hairpin RNA targeting O-GlcNAc transferase; STZ: Streptozotocin; LPS: Lipopolysaccharide; HG: High glucose; DMSO: Dimethyl sulfoxide; OSMI4: O-GlcNAc transferase inhibitor.
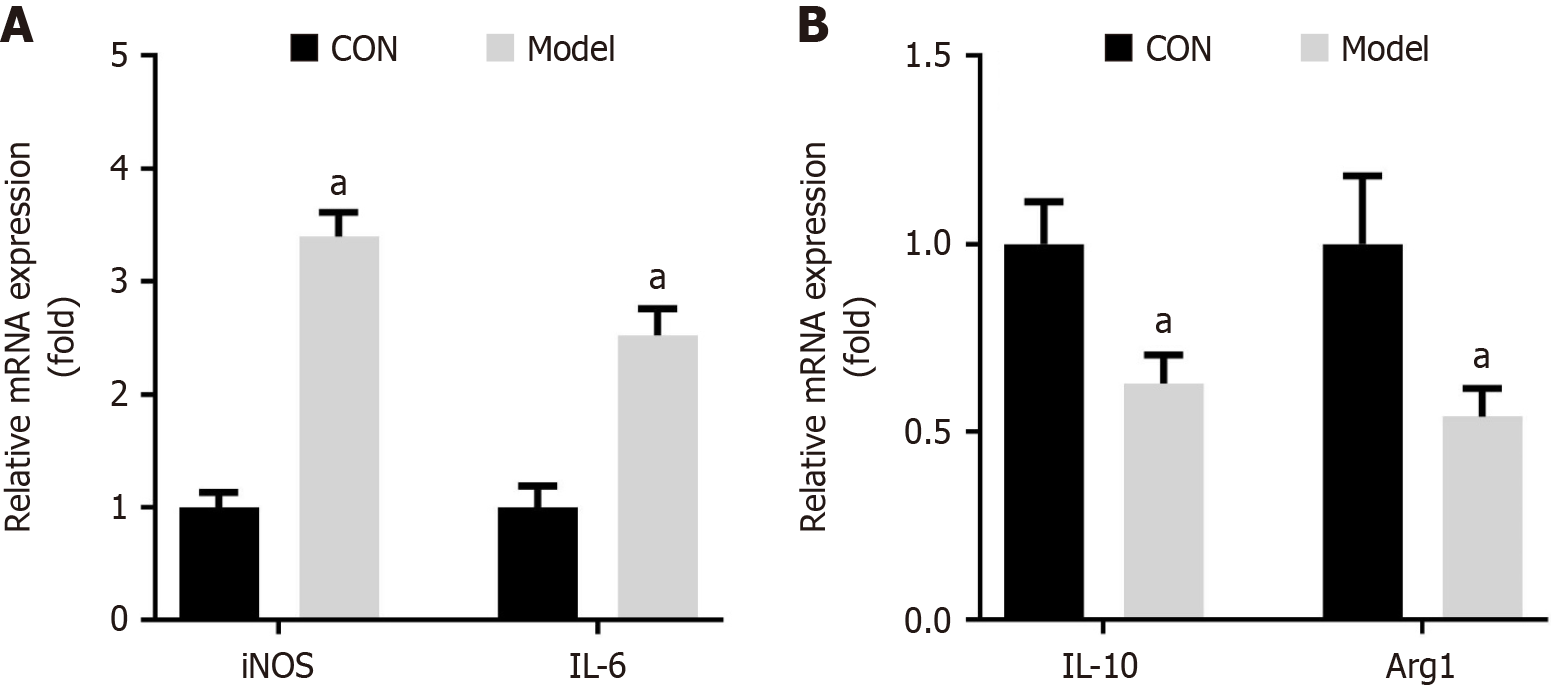
Figure 2 M1 macrophage polarization occurs in diabetic periodontitis mice.
A: mRNA expression of M1-type macrophage markers (inducible nitric oxide synthase and interleukin-6); B: M2-type macrophage markers (interleukin-10 and arginase 1) was detected using quantitative real-time polymerase chain reaction. aP < 0.05. P value calculated vs control. iNOS: Inducible nitric oxide synthase; IL: Interleukin; Arg1: Arginase 1; CON: Control.
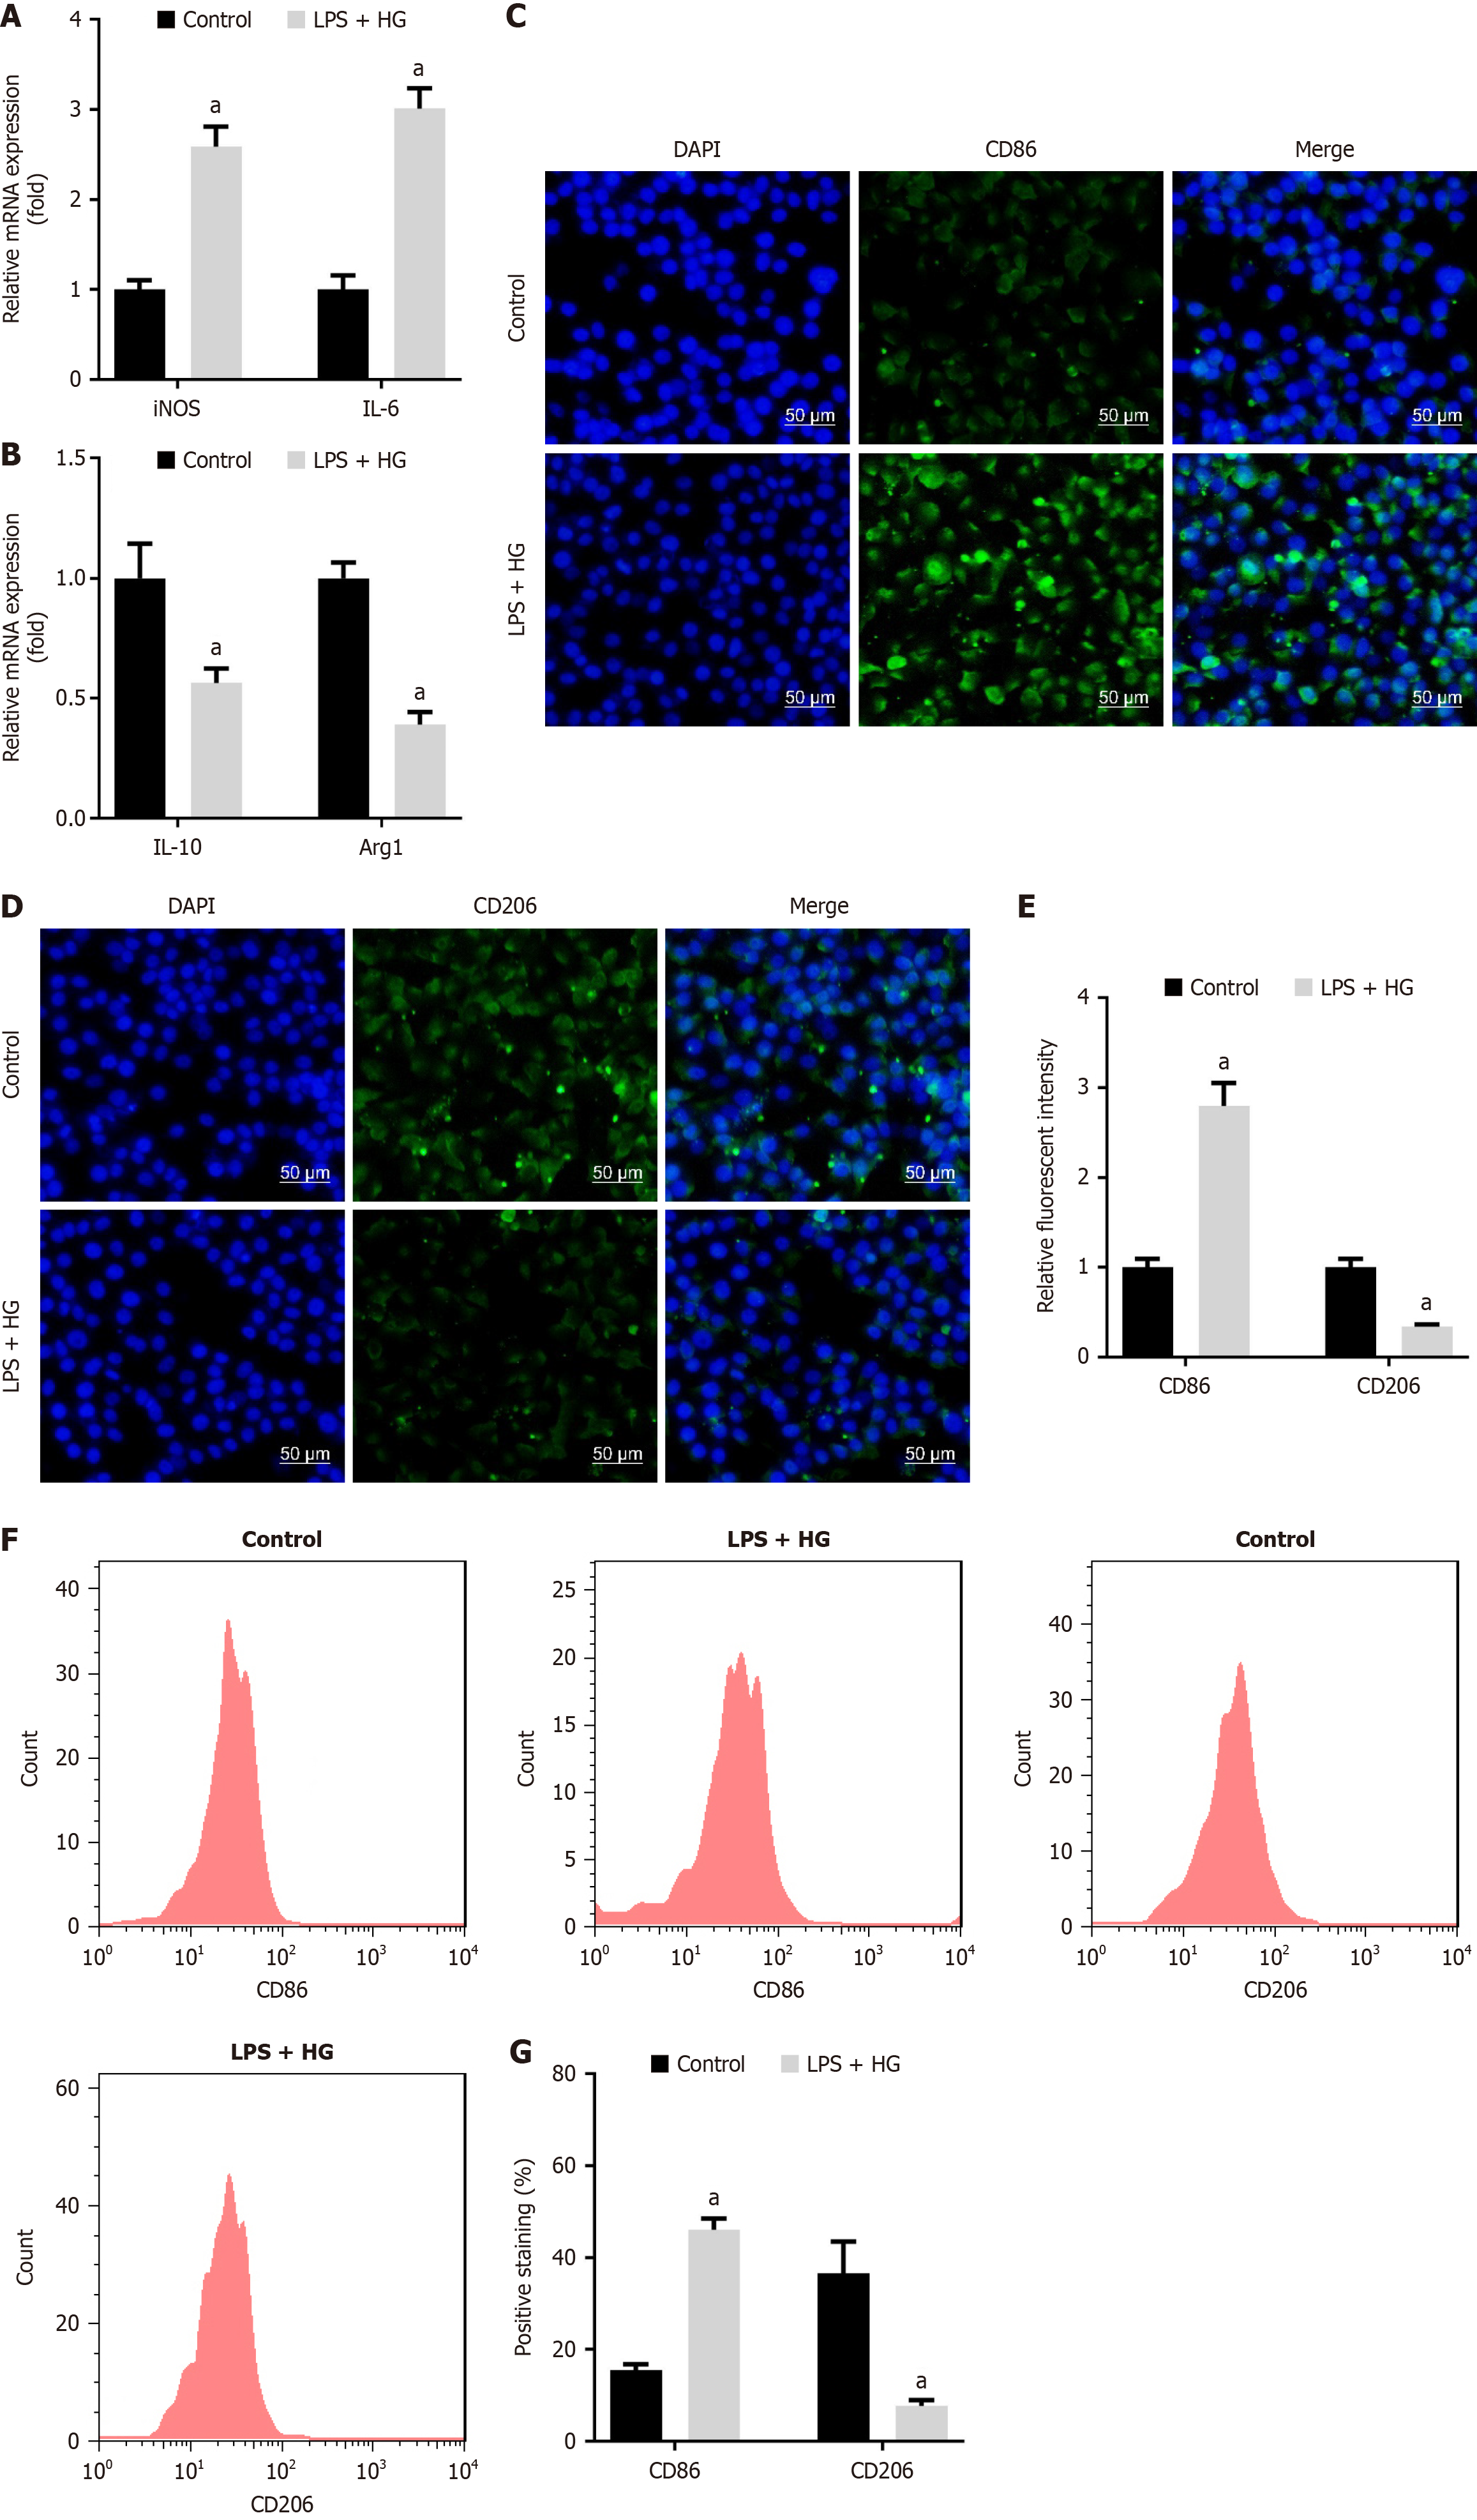
Figure 3 Lipopolysaccharide and high glucose promote macrophage polarization to M1 phenotype.
A: mRNA expression of inducible nitric oxide synthase and interleukin-6; B: Interleukin-10 and arginase 1 was measured using quantitative real-time polymerase chain reaction; C: Cluster of differentiation (CD) 86; D: CD206 levels were examined using immunofluorescence staining (Scale bar: 50 μm); E: Relative fluorescent intensity of CD86 and CD206 was quantified; F and G: CD86 and CD206 levels were detected and quantified using flow cytometry. aP < 0.05. P value calculated vs control. LPS: Lipopolysaccharide; HG: High glucose; iNOS: Inducible nitric oxide synthase; IL: Interleukin; Arg1: Arginase 1; CD: Cluster of differentiation; DAPI: 4’,6-Diamidino-2-phenylindole.
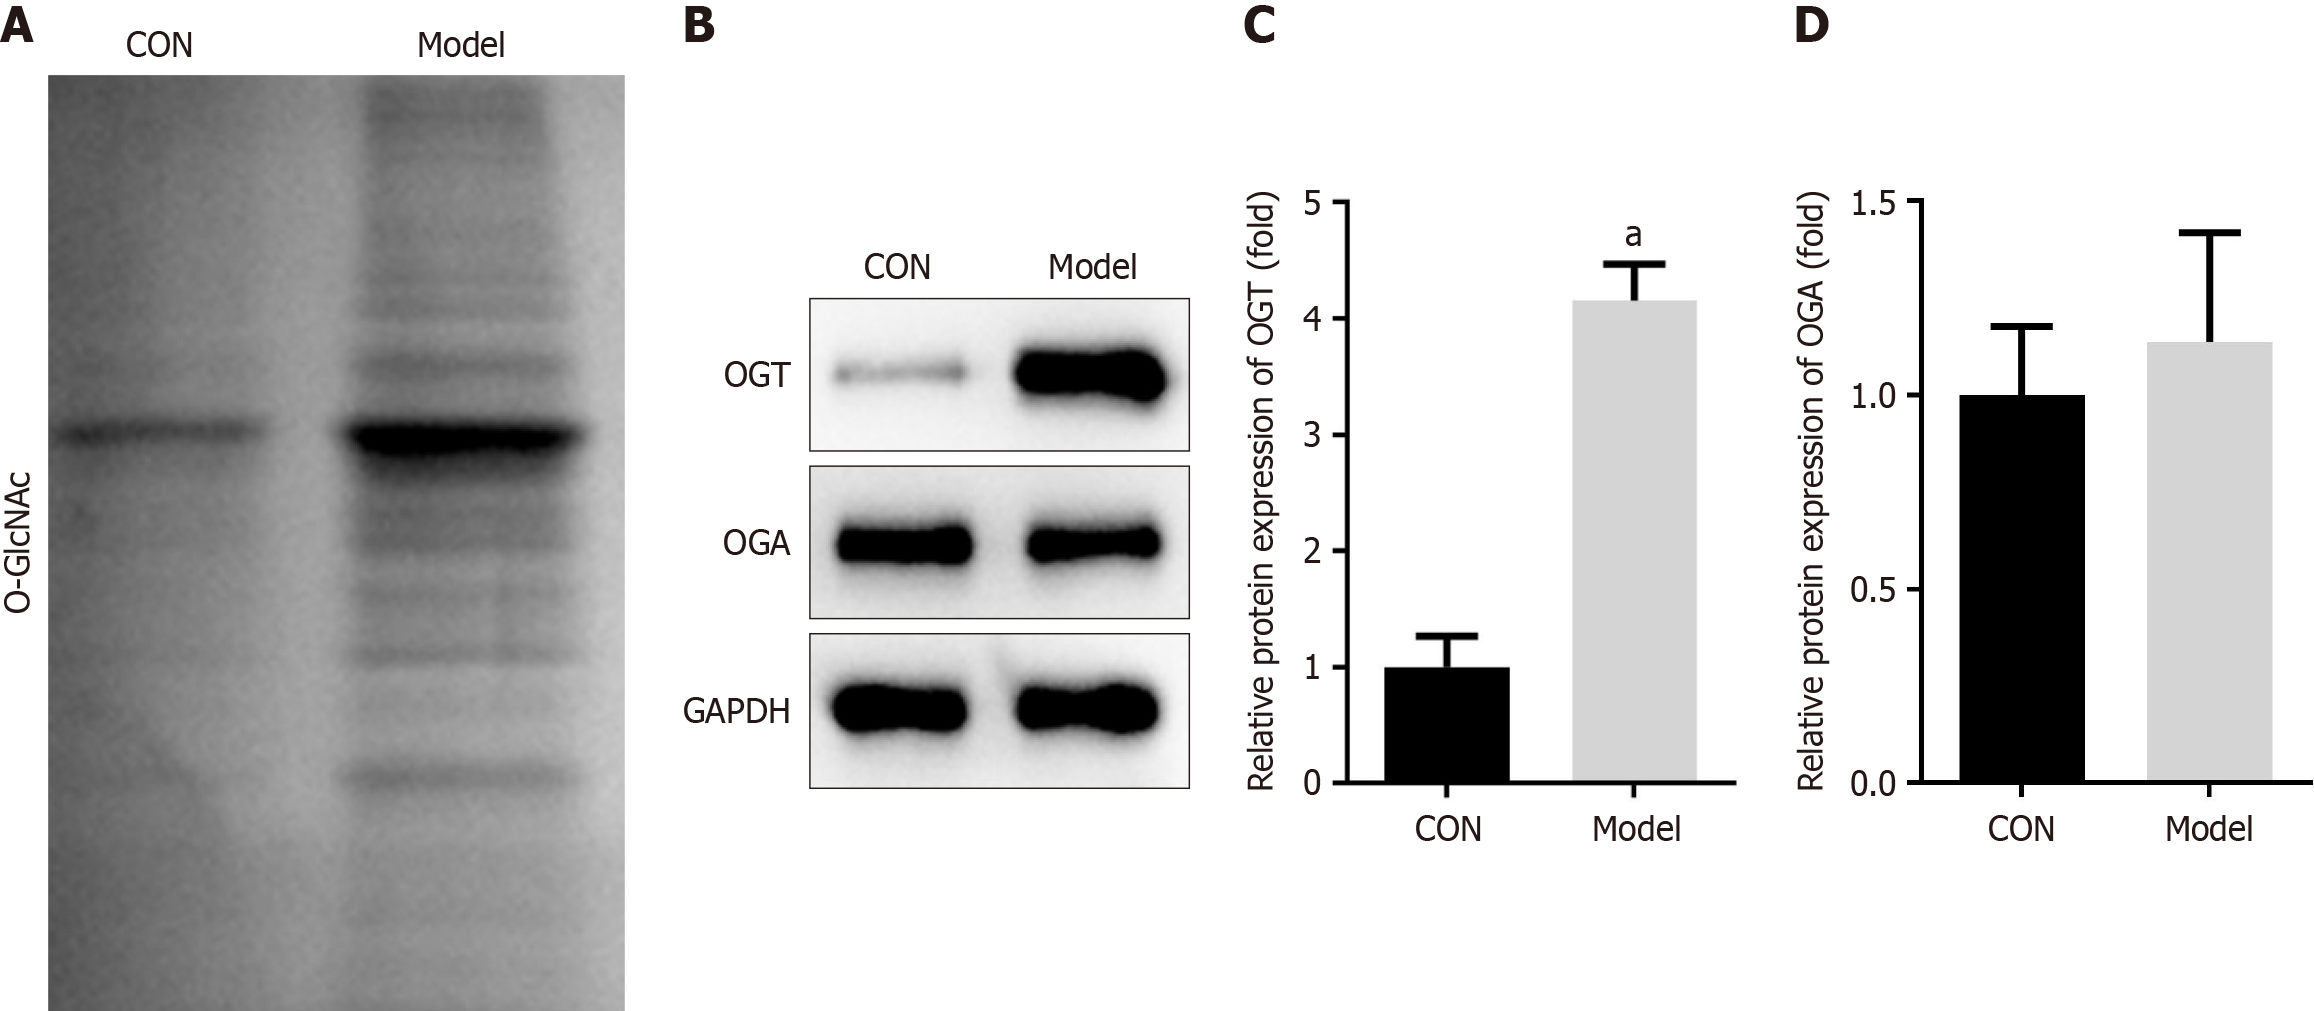
Figure 4 O-linked β-N-acetylglucosamine in diabetic periodontitis mice.
A: Total O-linked β-N-acetylglucosamine levels in the maxillary bone of mice; B: Protein levels of O-GlcNAc transferase (OGT) and O-GlcNAcase (OGA) in the maxillary bone were detected using Western blot; C and D: Protein levels of OGT and OGA were quantified. aP < 0.05. P value calculated vs control. OGT: O-GlcNAc transferase; OGA: O-GlcNAcase; CON: Control; GAPDH: Glyceraldehyde-3-phosphate dehydrogenase.
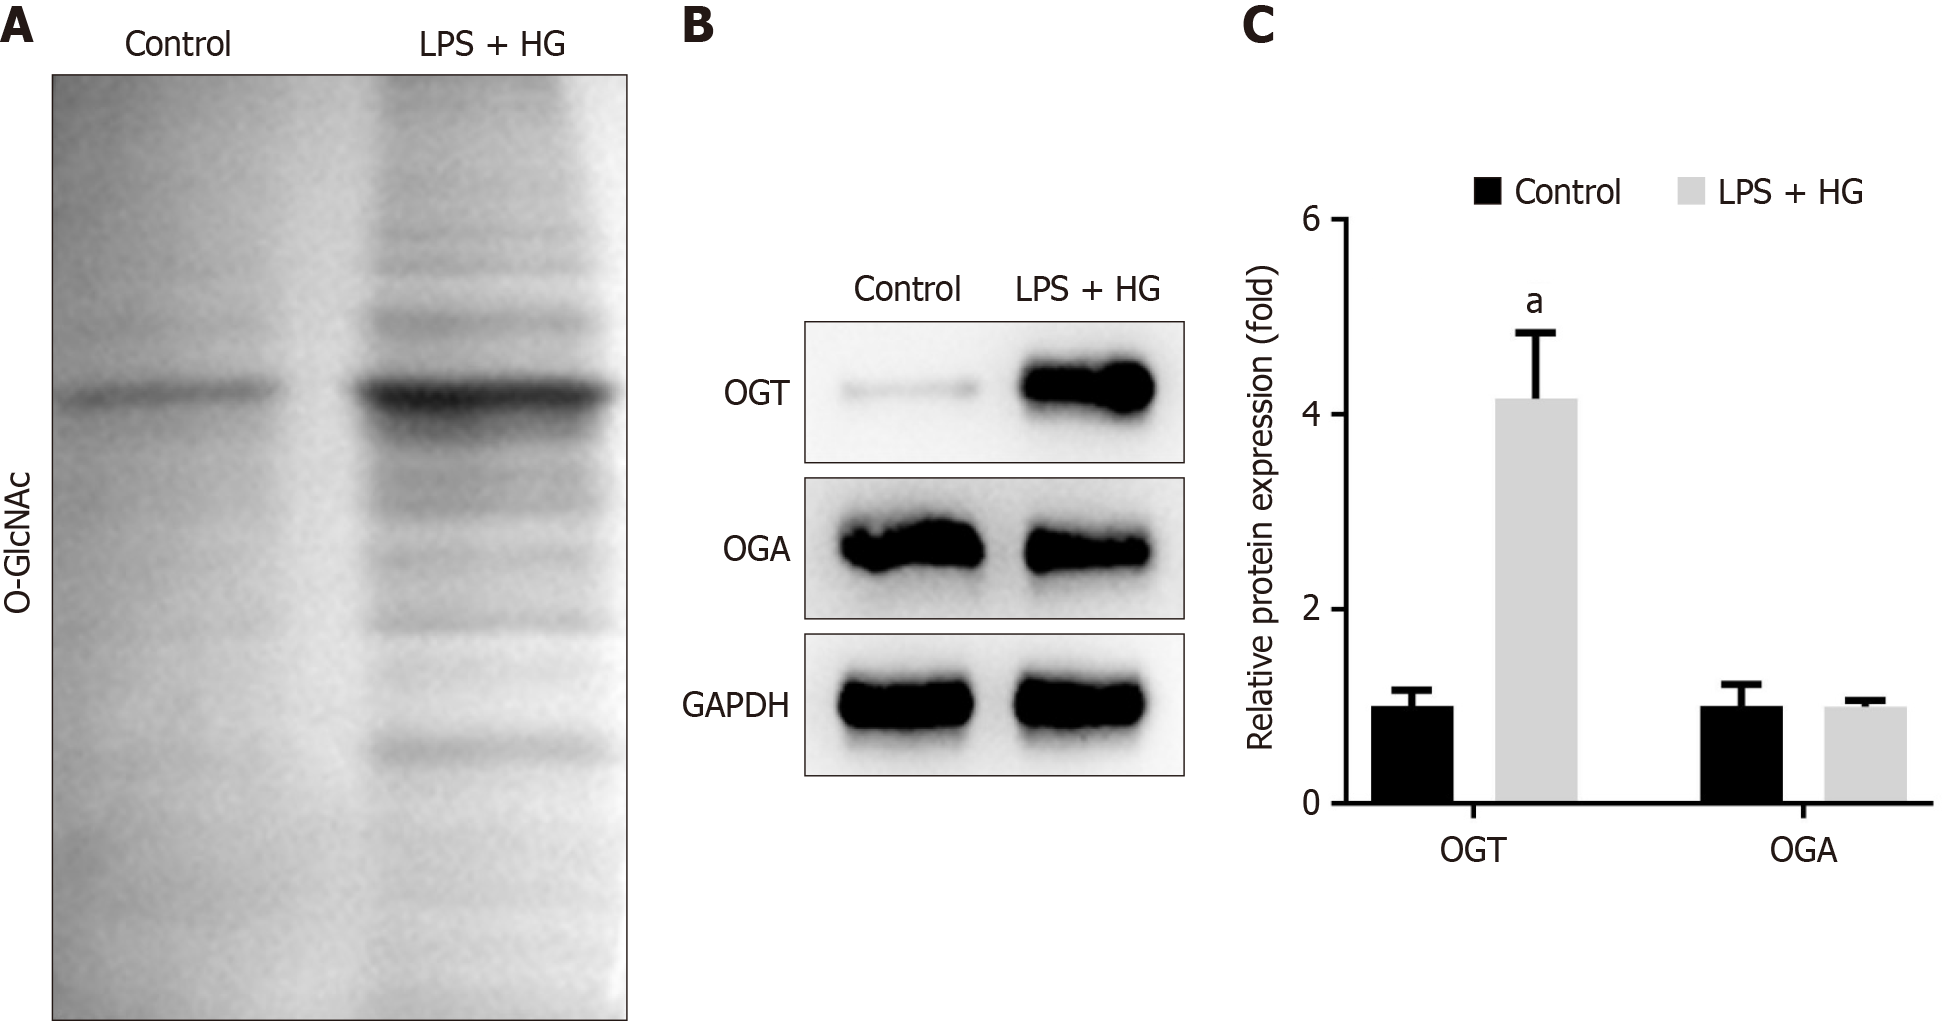
Figure 5 O-linked β-N-acetylglucosamine in RAW264.
7 Cells Treated with high glucose and lipopolysaccharide. A: Total O-linked β-N-acetylglucosamine levels; B: Protein levels of O-GlcNAc transferase (OGT) and O-GlcNAcase (OGA) were measured by Western blot; C: Protein levels of OGT and OGA were quantified. aP < 0.001. P value calculated vs control. LPS: Lipopolysaccharide; HG: High glucose; OGT: O-GlcNAc transferase; OGA: O-GlcNAcase; GAPDH: Glyceraldehyde-3-phosphate dehydrogenase.
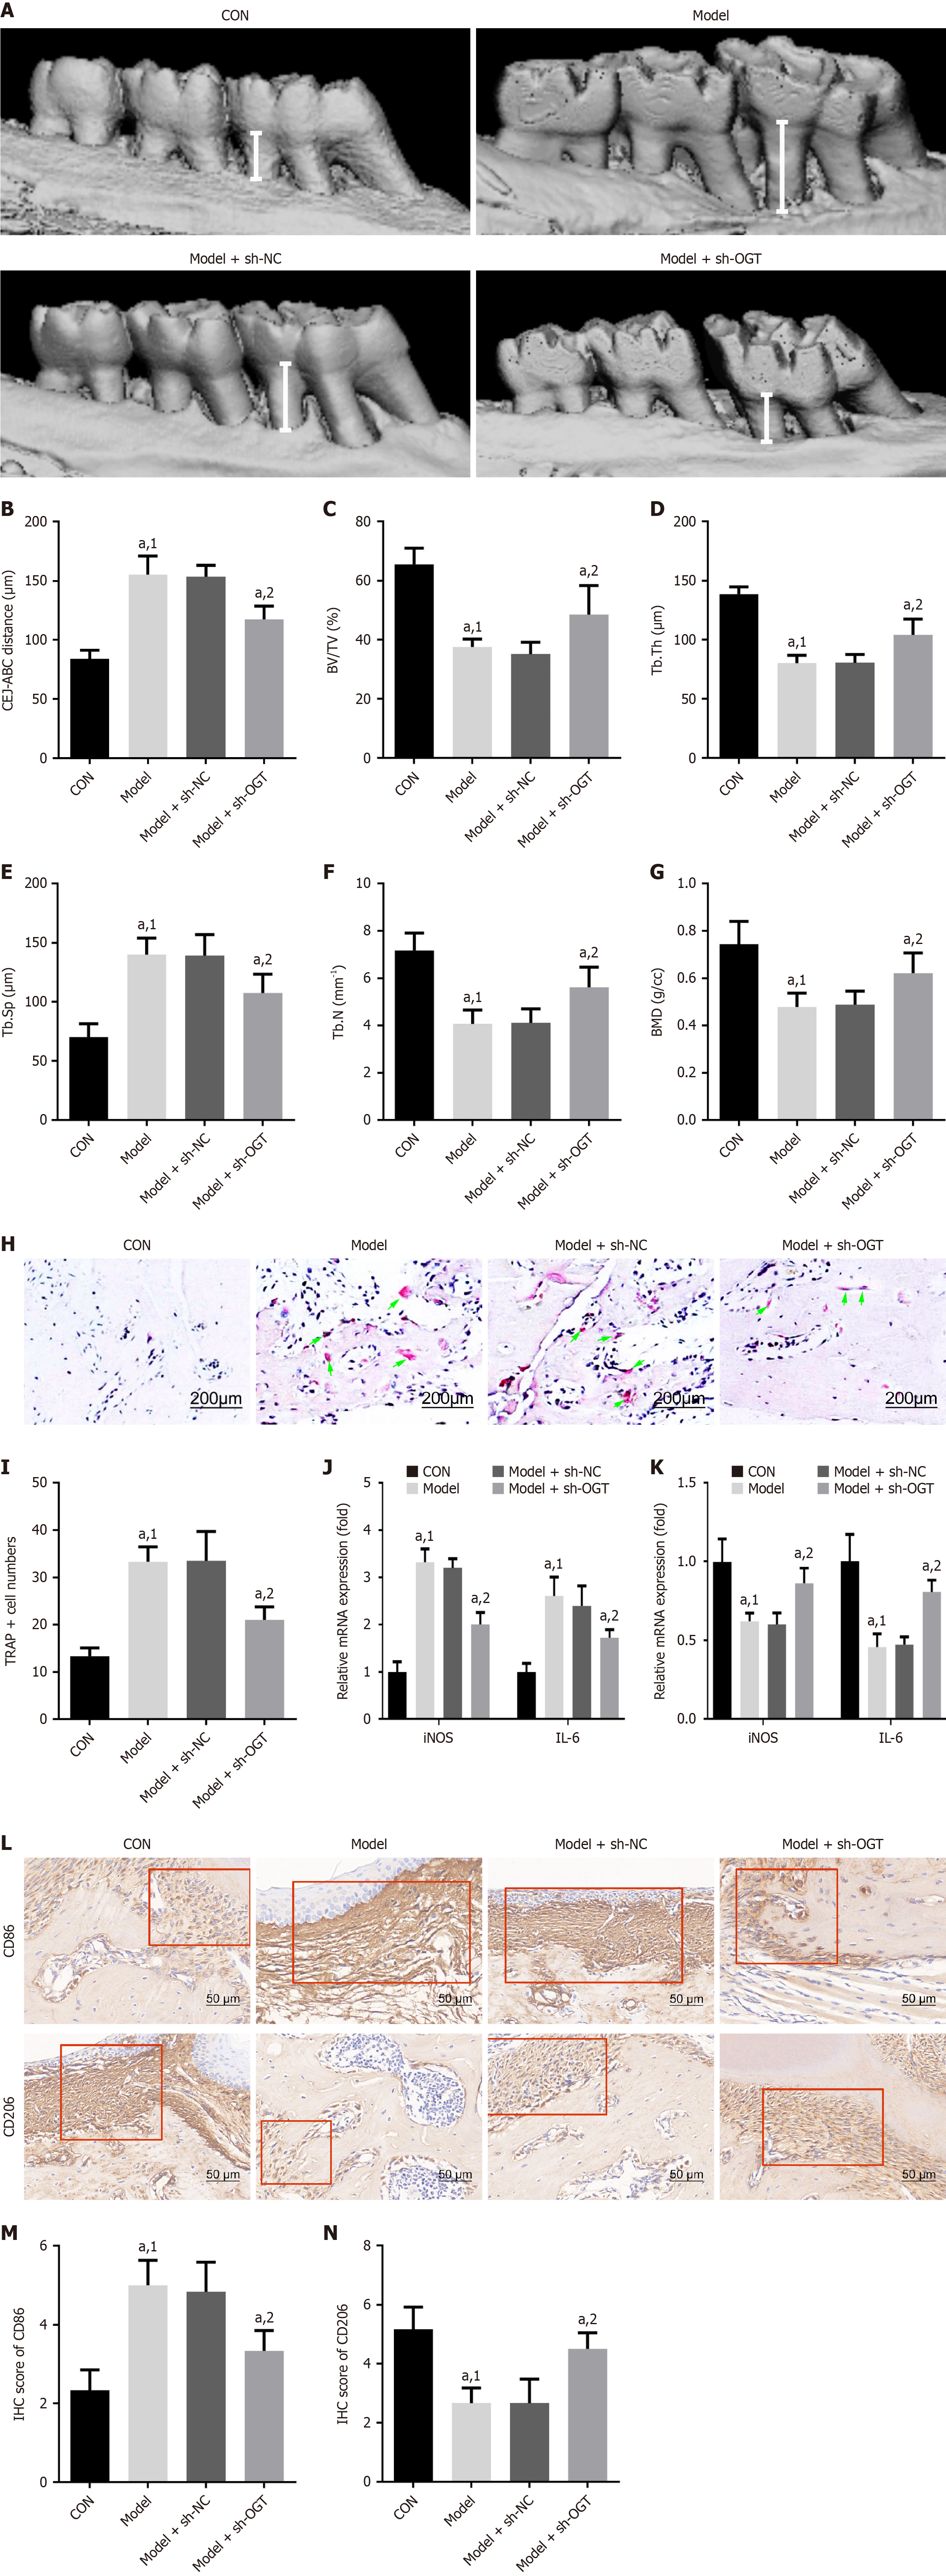
Figure 6 O-GlcNAc transferase knockdown modulates M1/M2 polarization to decelerate diabetic periodontitis.
A: Three-dimensional reconstruction images of the left maxillary bone. Alveolar bone loss is represented by the cementoenamel junction to alveolar bone crest (CEJ-ABC) distance (white lines); B: Quantification of CEJ-ABC distance. Bone-related parameters, including: C: Bone volume over tissue volume; D: Trabecular thickness; E: Trabecular spacing; F: Trabecular number; G: Bone mineral density, were quantified using micro-computed tomography analysis; H: Tartrate-resistant acid phosphate (TRAP) staining was performed to evaluate osteoclast differentiation. Scale bar: 200 μm; I: Quantitative analysis of TRAP-stained cells; J: The expression of inducible nitric oxide synthase and interleukin (IL)-6; K: IL-10 and arginase 1 was measured by quantitative real-time polymerase chain reaction; L: Immunohistochemical analysis was used to detect cluster of differentiation (CD) 86 and CD206 levels. Scale bar: 50 μm; M and N: Quantitative analysis of CD86 and CD206 expression by immunohistochemical scores. aP < 0.05. 1P vs control. 2P vs model + short hairpin RNA-negative control. sh-NC: Short hairpin RNA-negative control; sh-OGT: Short hairpin RNA targeting O-GlcNAc transferase; CON: Control; CEJ-ABC: Cementoenamel junction to alveolar bone crest; BV/TV: Bone volume ratio; Tb.Th: Trabecular thickness; Tb.Sp: Trabecular separation; Tb.N: Trabecular number; BMD: Bone mineral density; TRAP: Tartrate-resistant acid phosphate; iNOS: Inducible nitric oxide synthase; IL: Interleukin; CD: Cluster of differentiation; IHC: Immunohistochemical.
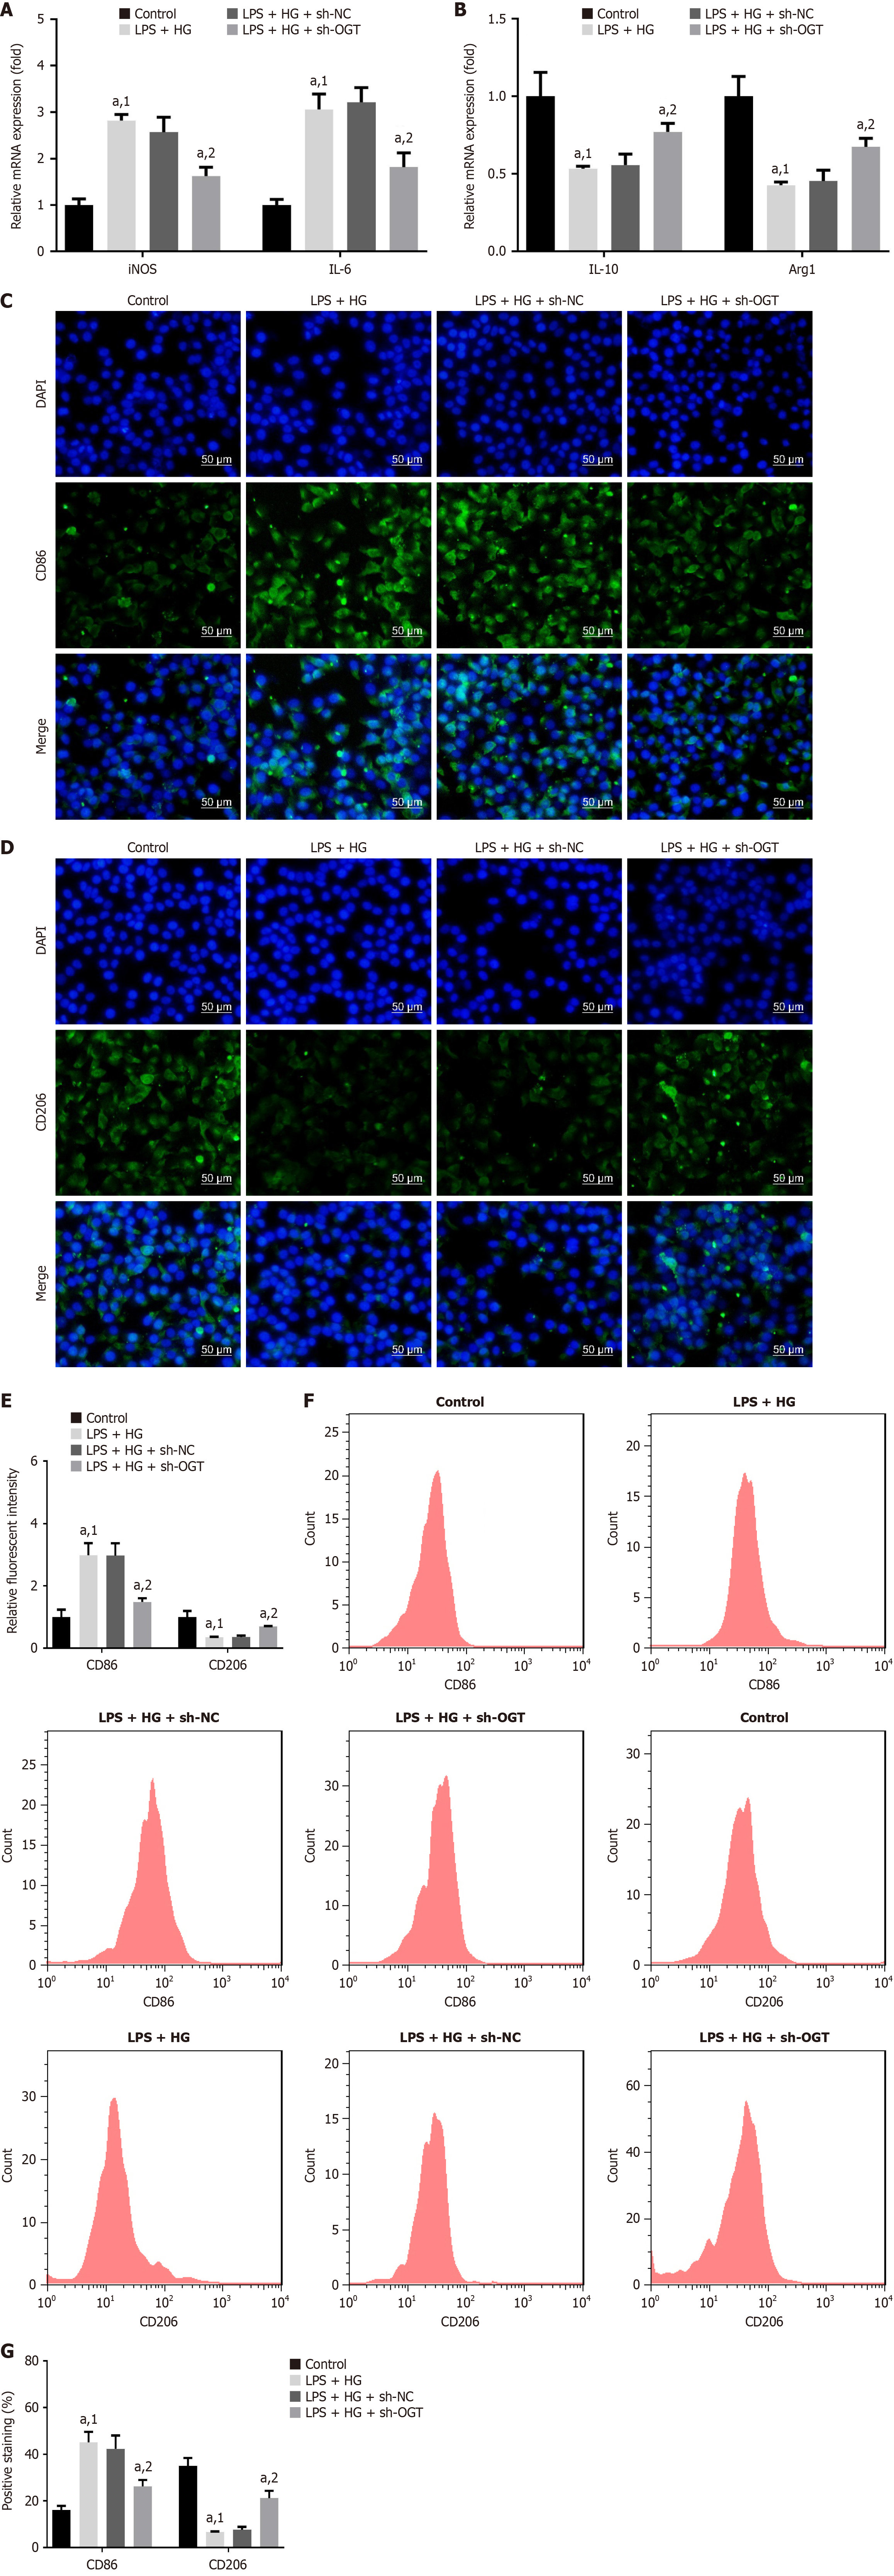
Figure 7 Silencing of O-GlcNAc transferase inhibits M1 polarization and facilitates M2 polarization.
A: mRNA expression of inducible nitric oxide synthase and interleukin (IL)-6; B: IL-10 and arginase 1 in cells was measured using quantitative real-time polymerase chain reaction; C: Immunofluorescence staining was conducted to measure cluster of differentiation (CD) 86; D: CD206 levels. Scale bar: 50 μm; E: Relative fluorescence intensity of CD86 and CD206 was quantified; F and G: CD86 and CD206 levels were assessed and quantified by flow cytometry. aP < 0.05. 1P vs control. 2P vs lipopolysaccharide + high glucose + short hairpin RNA-negative control. LPS: Lipopolysaccharide; HG: High glucose; sh-NC: Short hairpin RNA-negative control; sh-OGT: Short hairpin RNA targeting O-GlcNAc transferase; iNOS: Inducible nitric oxide synthase; IL: Interleukin; CD: Cluster of differentiation; Arg1: Arginase 1; DAPI: 4’,6-Diamidino-2-phenylindole.
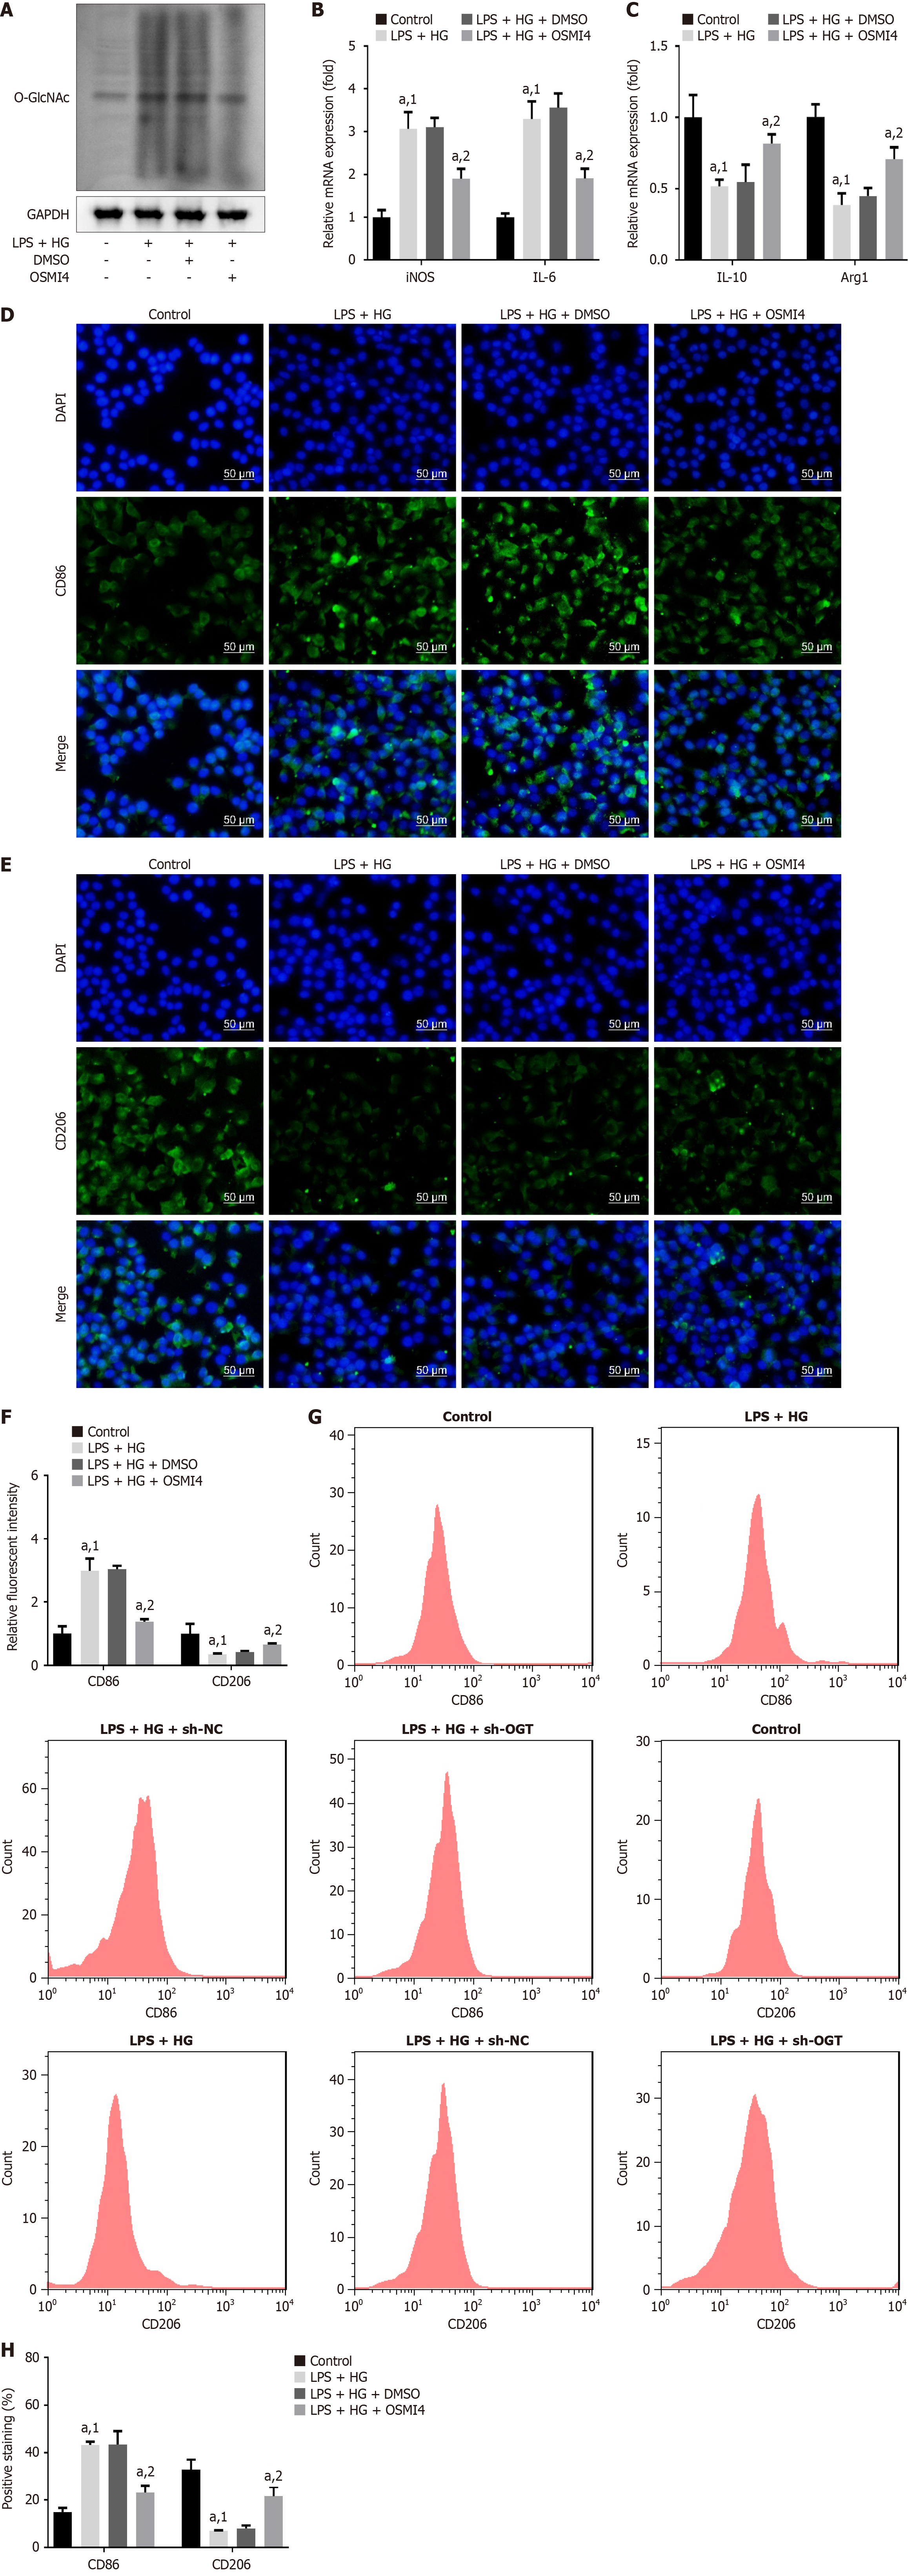
Figure 8 O-GlcNAc transferase inhibitor suppresses M1 polarization and facilitates M2 polarization.
A: After O-GlcNAc transferase inhibitor (OSMI4) treatment, O-linked β-N-acetylglucosamine levels were measured using Western blot; B: mRNA expression of inducible nitric oxide synthase and interleukin (IL)-6; C: IL-10 and arginase 1 in cells was measured using quantitative real-time polymerase chain reaction; D: Cluster of differentiation (CD) 86; E: CD206 levels were observed using immunofluorescence staining. Scale bar: 50 μm; F: Relative fluorescent intensity of CD86 and CD206 was quantified; G and H: CD86 and CD206 levels were evaluated and quantified using flow cytometry. aP < 0.05. 1P vs control. 2P vs lipopolysaccharide + high glucose + dimethyl sulfoxide. LPS: Lipopolysaccharide; HG: High glucose; sh-NC: Short hairpin RNA-negative control; sh-OGT: Short hairpin RNA targeting O-GlcNAc transferase; iNOS: Inducible nitric oxide synthase; IL: Interleukin; CD: Cluster of differentiation; Arg1: Arginase 1; GAPDH: Glyceraldehyde-3-phosphate dehydrogenase; MSO: Dimethyl sulfoxide; OSMI4: O-GlcNAc transferase inhibitor; DAPI: 4’,6-Diamidino-2-phenylindole.
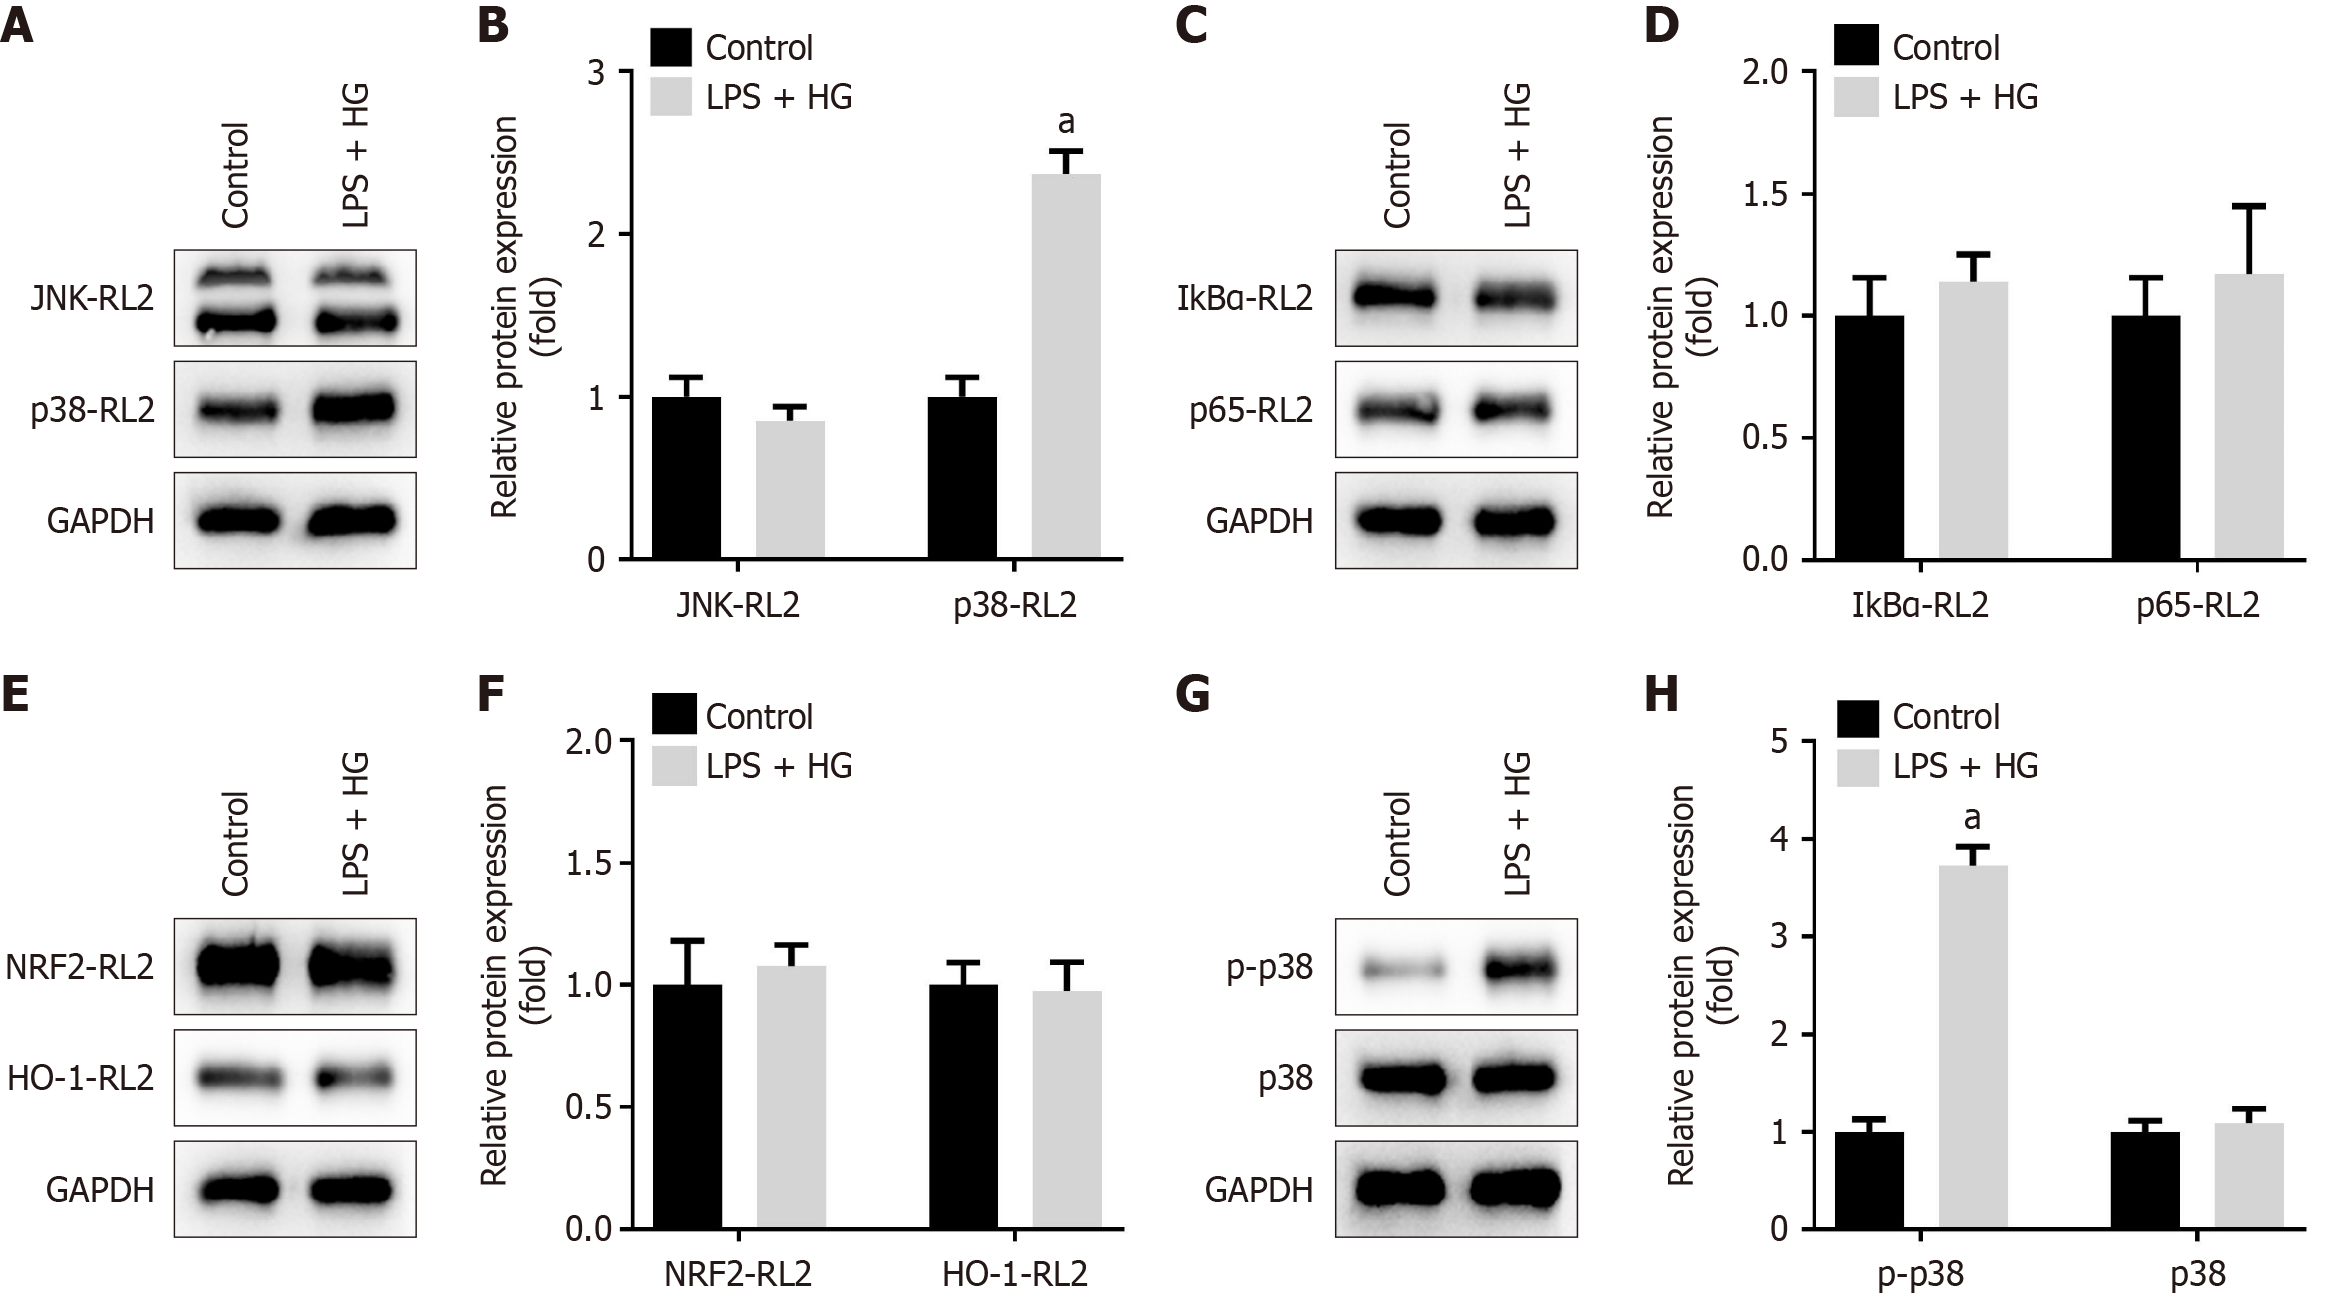
Figure 9 Lipopolysaccharide and high glucose activate the p38/major mitogen-activated protein kinase signaling pathway.
A and B: O-linked β-N-acetylglucosamine (O-GlcNAcylation) levels of c-Jun N-terminal kinase and p38 were measured and quantified using Western blot after immunoprecipitation (IP) of these proteins; C and D: O-GlcNAcylation levels of inhibitor of κB alpha and p65 were measured and quantified using Western blot after IP; E and F: O-GlcNAcylation levels of nuclear factor (erythroid-derived 2)-like 2 and heme oxygenase 1 were measured and quantified using Western blot after IP; G and H: Protein levels of p38 and phosphorylated p38 were examined and quantified using Western blot. aP < 0.05. P value calculated vs control. LPS: Lipopolysaccharide; HG: High glucose; NRF2: Nuclear factor (erythroid-derived 2)-like 2; RL2: O-GlcNAc; JNK: C-Jun N-terminal kinase; IκBα: Inhibitor of κB alpha; HO-1: Heme oxygenase 1; p-p38: Phosphorylated p38; GAPDH: Glyceraldehyde-3-phosphate dehydrogenase.
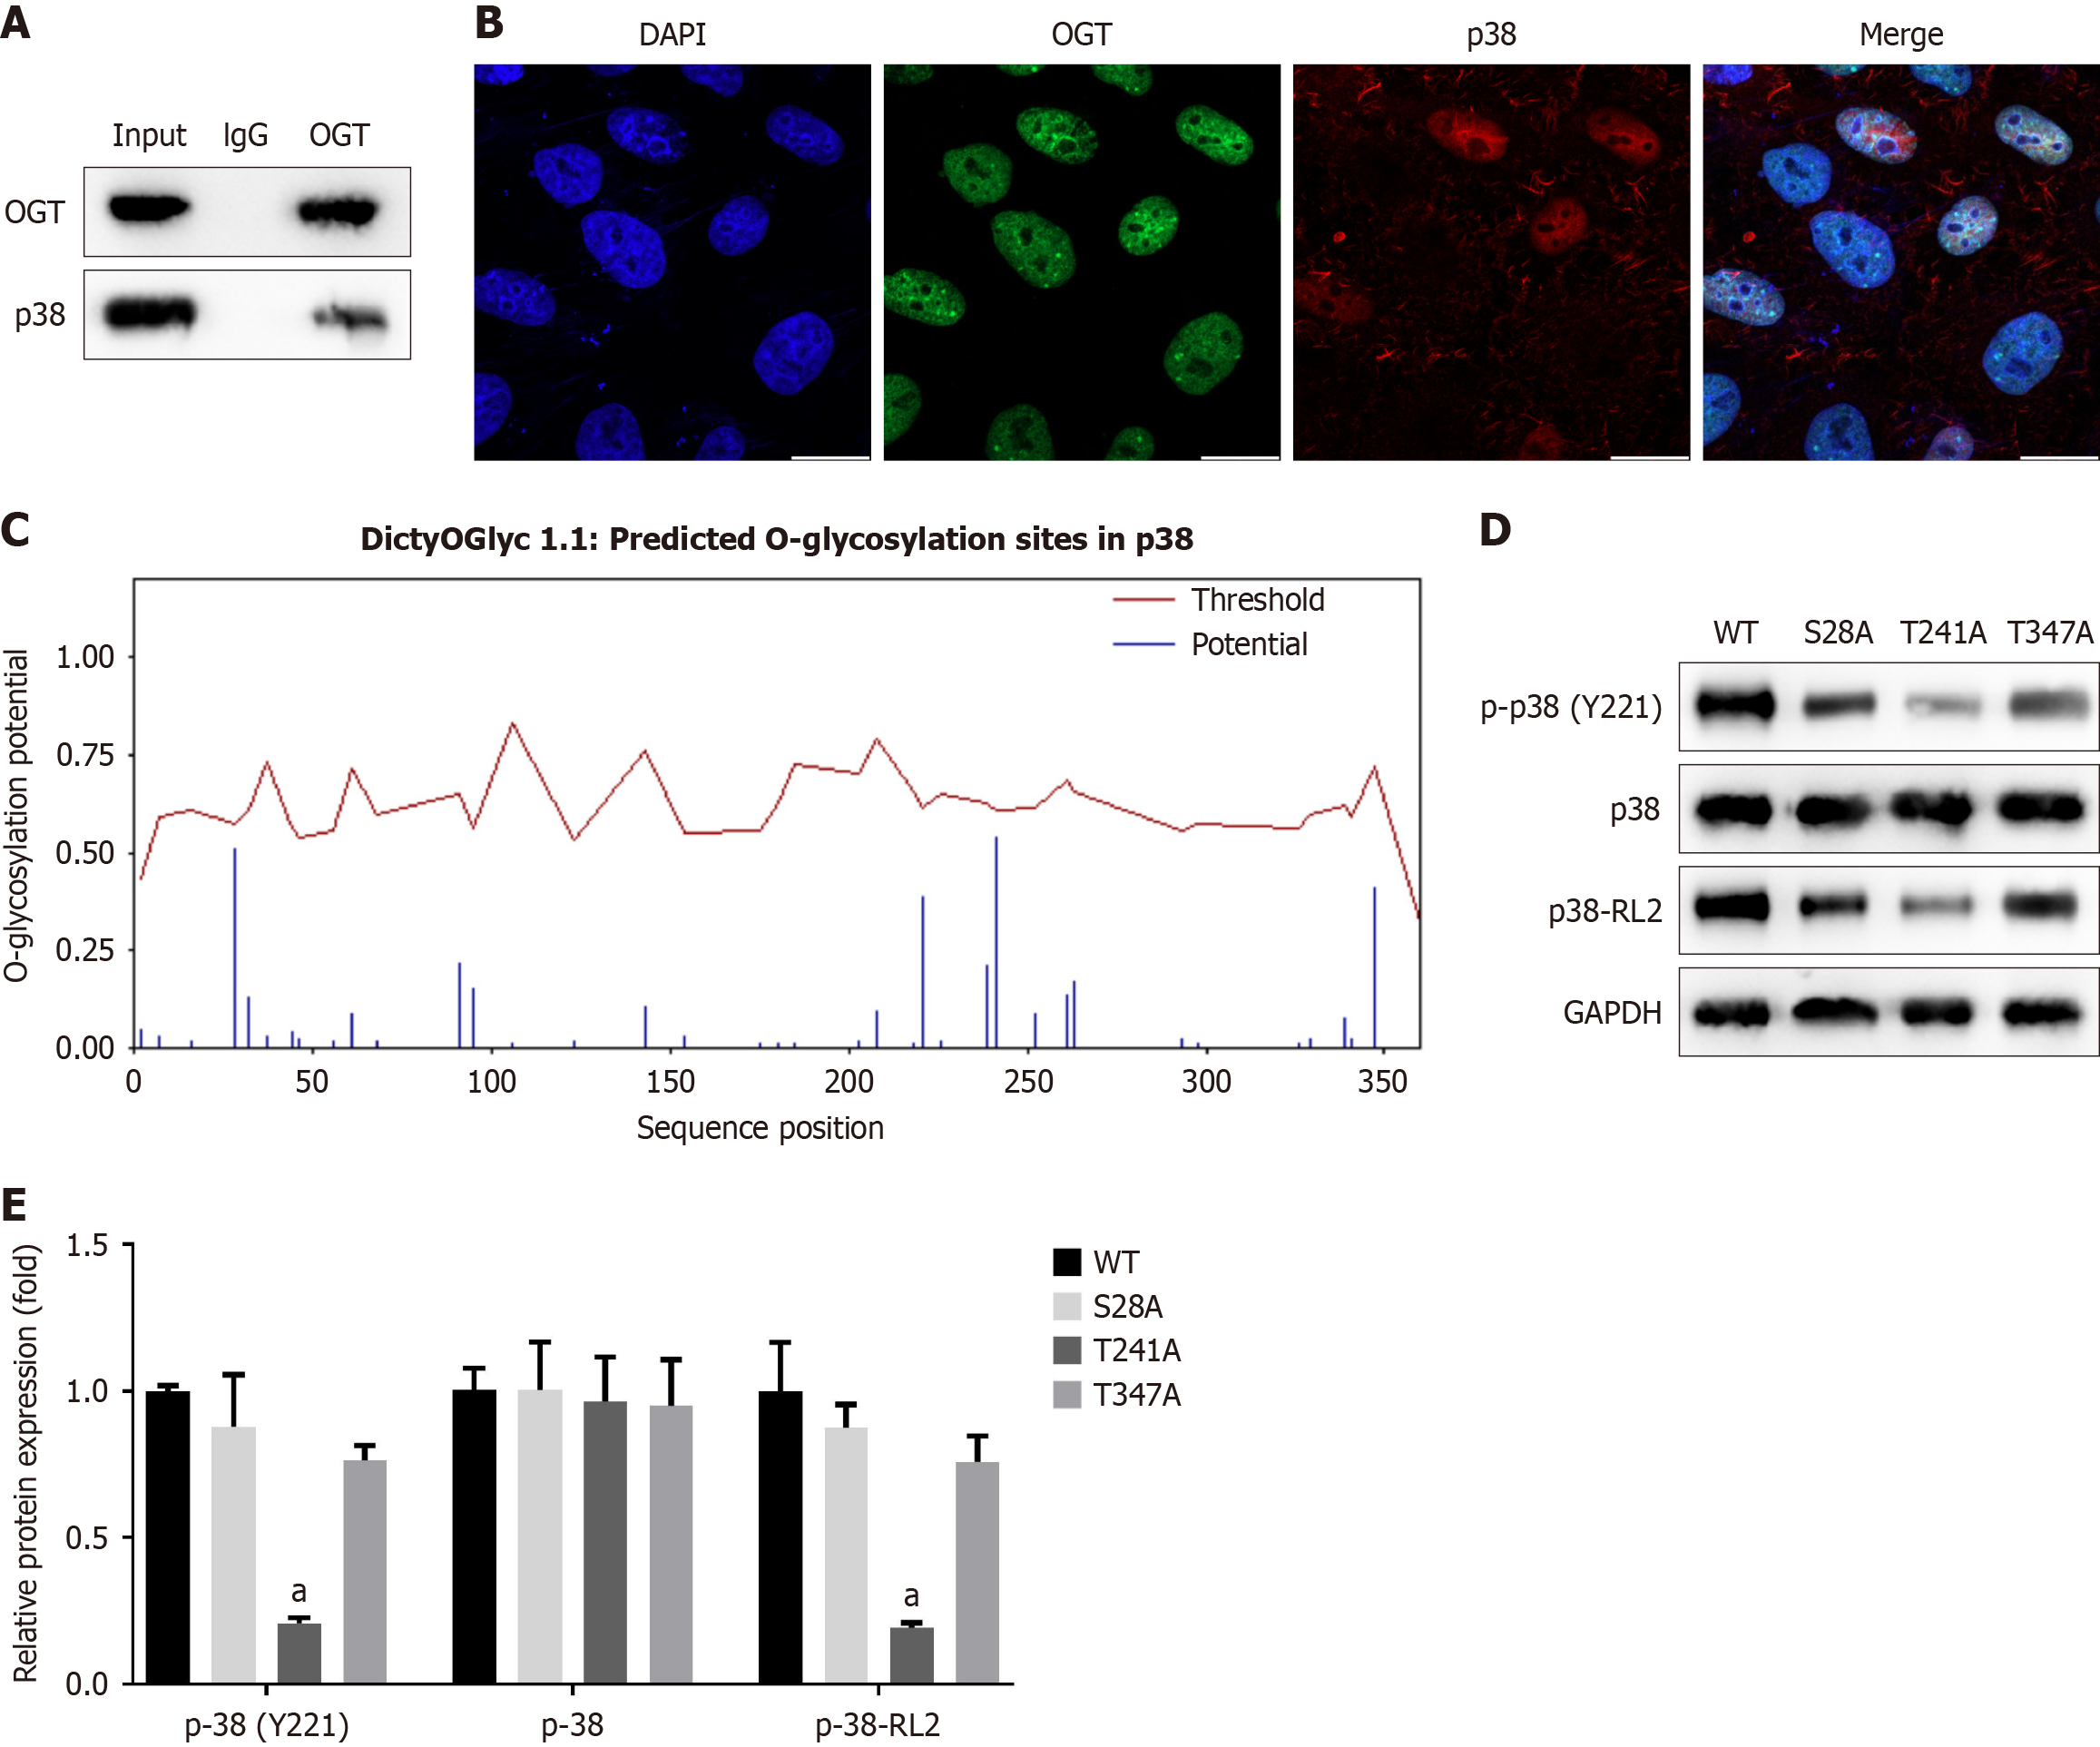
Figure 10 O-GlcNAc transferase promotes O-linked β-N-acetylglucosamine and phosphorylation of p38.
A: The interaction between O-GlcNAc transferase (OGT) and p38 was analyzed using co-immunoprecipitation; B: The localization of OGT and p38 in RAW264.7 cells was observed using immunofluorescence staining. Scale bar: 20 μm; C: Potential O-linked β-N-acetylglucosamine (O-GlcNAcylation) sites in p38 were predicted using the DictyOGlyc 1.1 Server software; D: The O-GlcNAcylation sites were confirmed, and the effects on p38 phosphorylation were measured using Western blot; E: The relative protein expression levels were quantified. aP < 0.05. P value calculated vs wild-type. OGT: O-GlcNAc transferase; DAPI: 4’,6-Diamidino-2-phenylindole; WT: Wild-type; GAPDH: Glyceraldehyde-3-phosphate dehydrogenase; RL2: O-GlcNAc.
- Citation: Wu YK, Liu M, Zhou HL, He X, Wei J, Hua WH, Li HJ, Yuan QH, Xie YF. O-linked β-N-acetylglucosamine transferase regulates macrophage polarization in diabetic periodontitis: In vivo and in vitro study. World J Diabetes 2025; 16(3): 95092
- URL: https://www.wjgnet.com/1948-9358/full/v16/i3/95092.htm
- DOI: https://dx.doi.org/10.4239/wjd.v16.i3.95092


