Copyright
©The Author(s) 2025.
World J Diabetes. Mar 15, 2025; 16(3): 100580
Published online Mar 15, 2025. doi: 10.4239/wjd.v16.i3.100580
Published online Mar 15, 2025. doi: 10.4239/wjd.v16.i3.100580
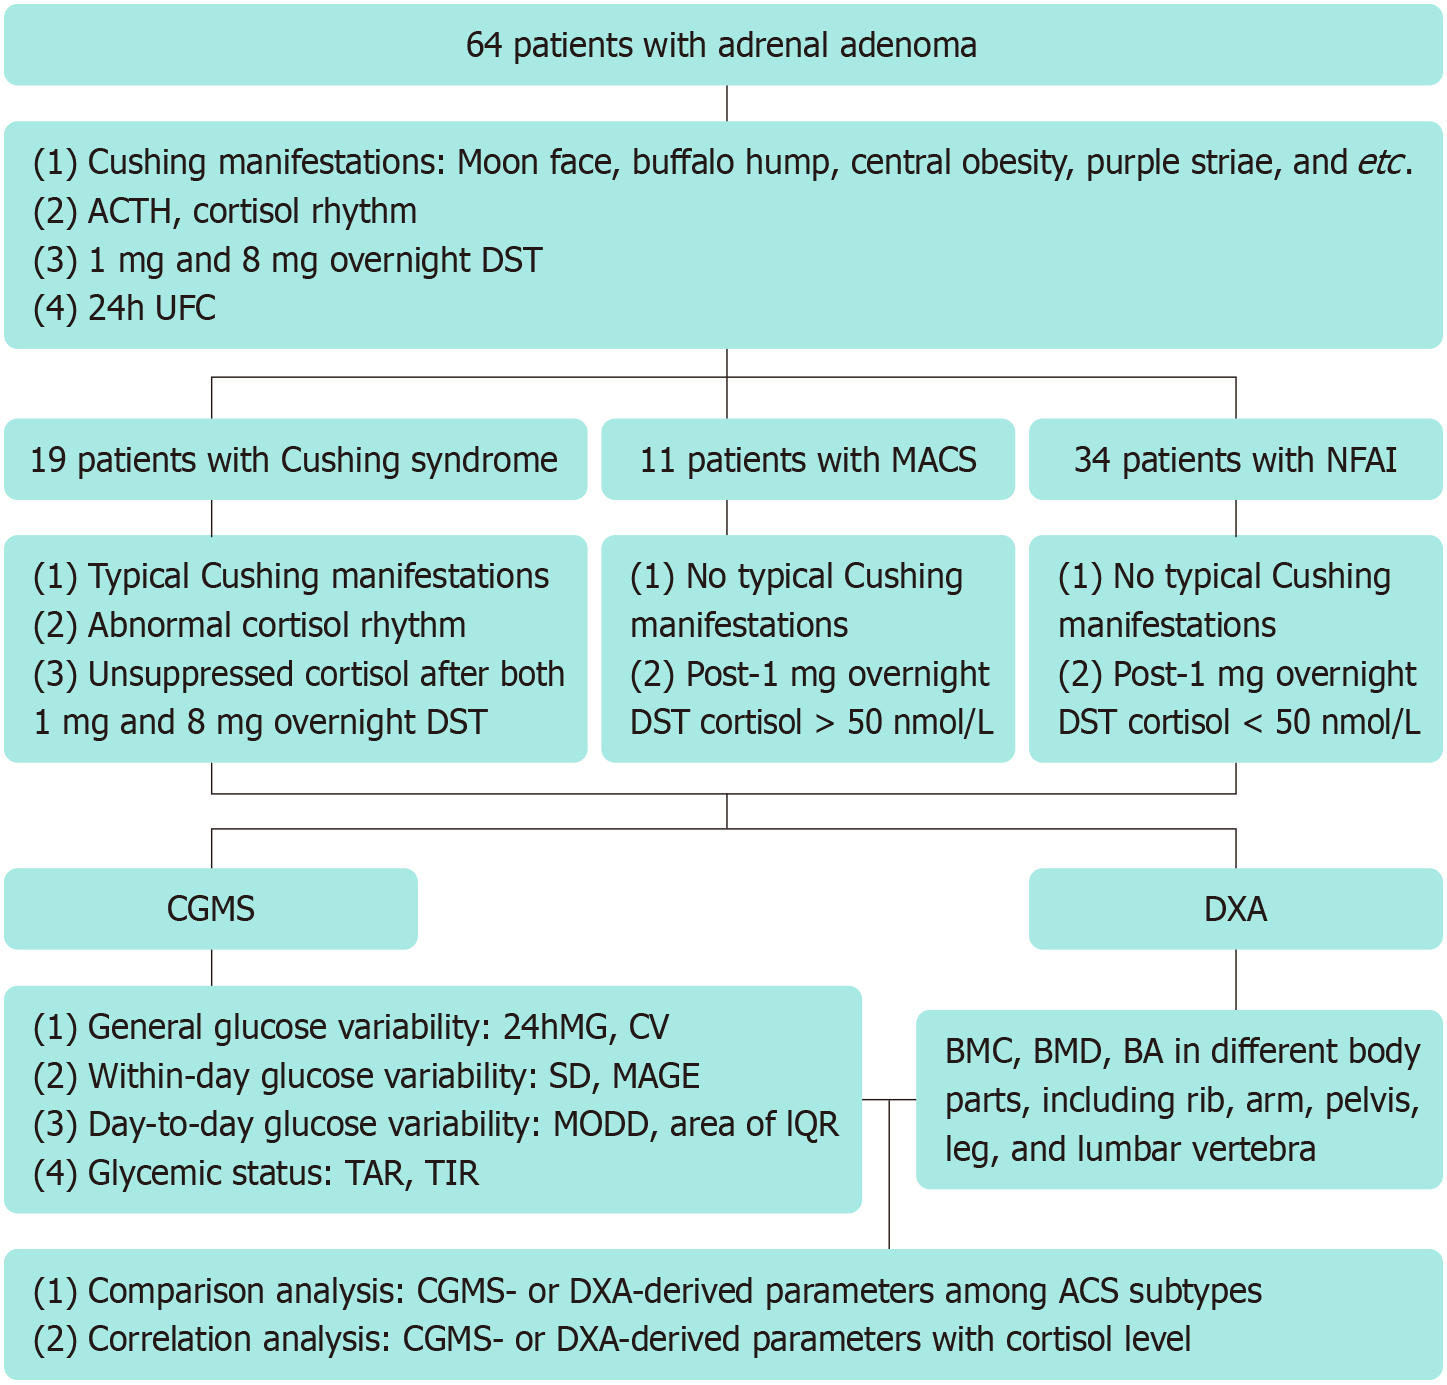
Figure 1 Workflow of the study design and data analysis.
24h UFC: 24-hour urine free cortisol; ACTH: Adrenocorticotropin; BA: Bone area; BMC: Bone mineral content; BMD: Bone mineral density; CGMS: Continuous glucose monitoring system; CV: Coefficient of variation; DST: Dexamethasone suppression test; DXA: Dual-energy X-ray absorptiometry; IQR: Interquartile range; MACS: Mild autonomous cortisol secretion; MAGE: Mean amplitude of glucose excursion; MODD: Mean of daily difference; NFAI: Nonfunctional adrenal incidentaloma; SD: Standard deviation of sensor glucose; TAR: Time above range; TIR: Time in range.
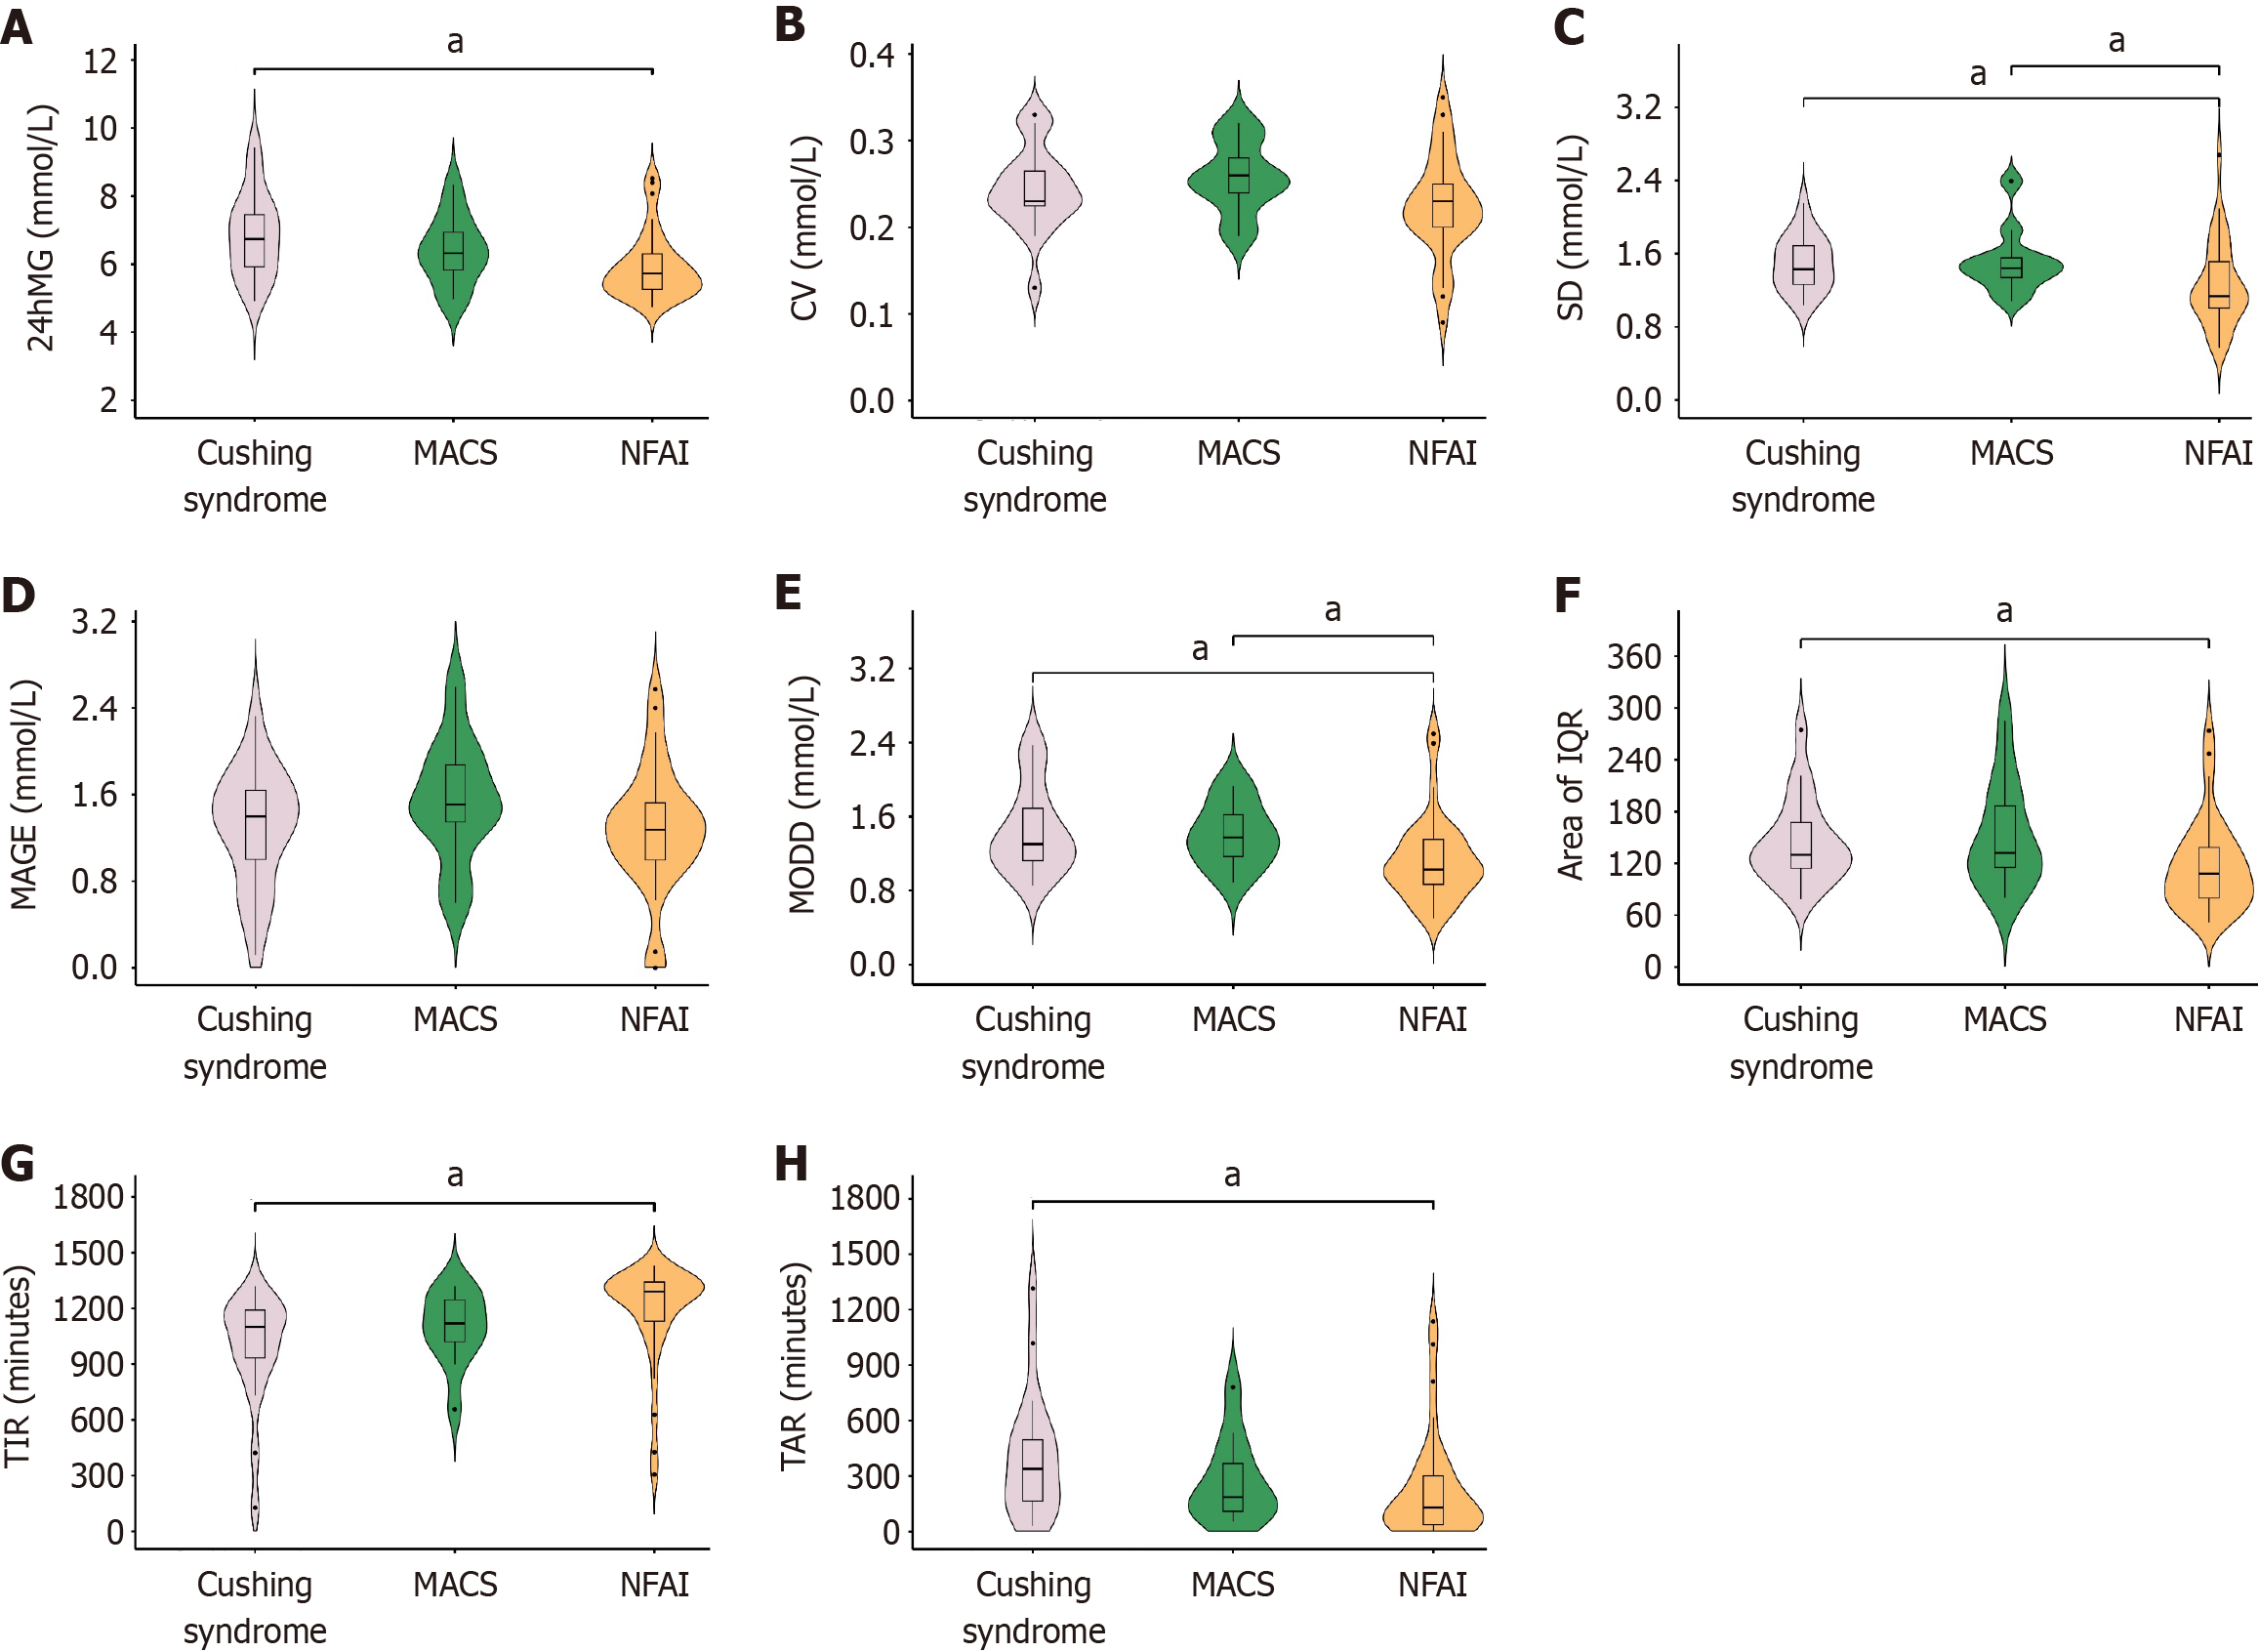
Figure 2 Comparison of continuous glucose monitoring system-derived parameters among groups of Cushing syndrome, mild autonomous cortisol secretion, and nonfunctional adrenal incidentaloma.
A: 24-hour mean glucose (24hMG); B: Coefficient of variation (CV); C: Standard deviation of sensor glucose (SD); D: Mean amplitude of glucose excursion (MAGE); E: Mean of daily difference (MODD); F: Area of interquartile range (IQR); G: Time above range (TAR); H: Time in range (TIR). aP < 0.05 was considered a significant difference. MACS: Mild autonomous cortisol secretion; NFAI: Nonfunctional adrenal incidentaloma.
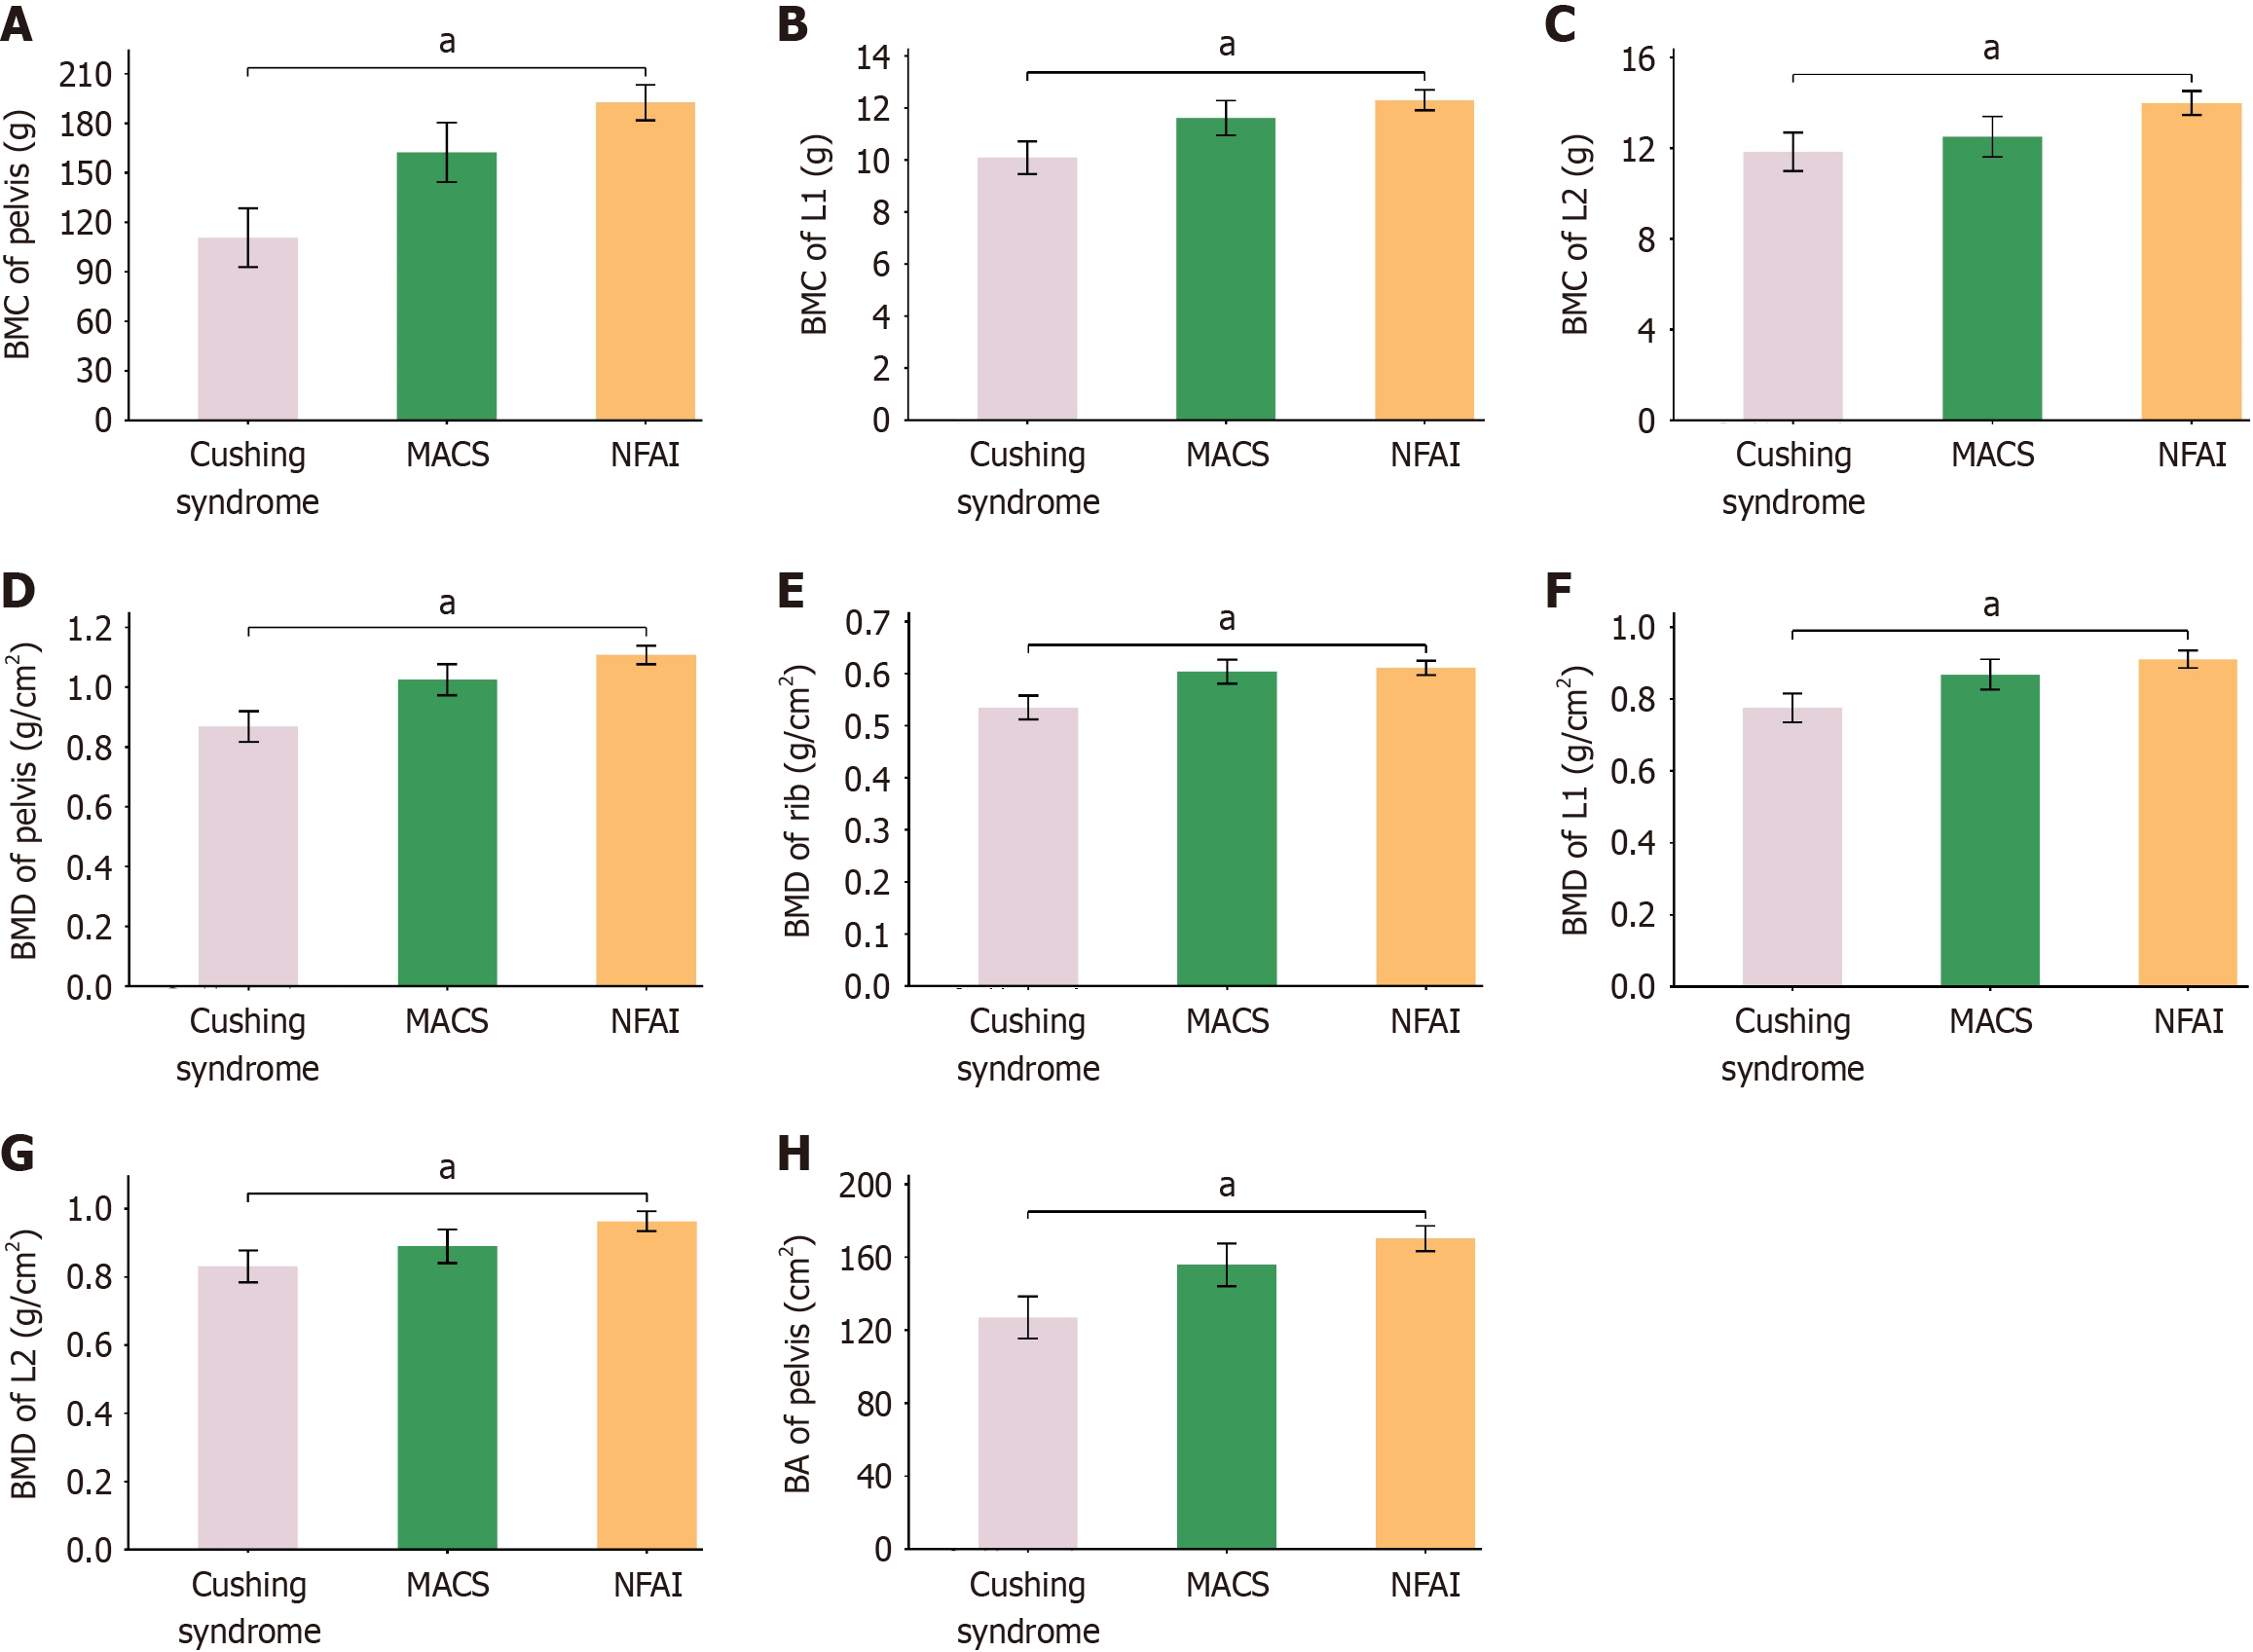
Figure 3 Dual-energy X-ray absorptiometry-derived parameters with significant difference among groups of Cushing syndrome, mild autonomous cortisol secretion, and nonfunctional adrenal incidentaloma.
A-C: Regional bone mineral content; D-G: Regional bone mineral density; H: Regional bone area. aP < 0.05 was considered a significant difference. BMC: Bone mineral content; L: Lumbar vertebra; BMD: Bone mineral density; BA: Bone area; MACS: Mild autonomous cortisol secretion; NFAI: Nonfunctional adrenal incidentaloma.
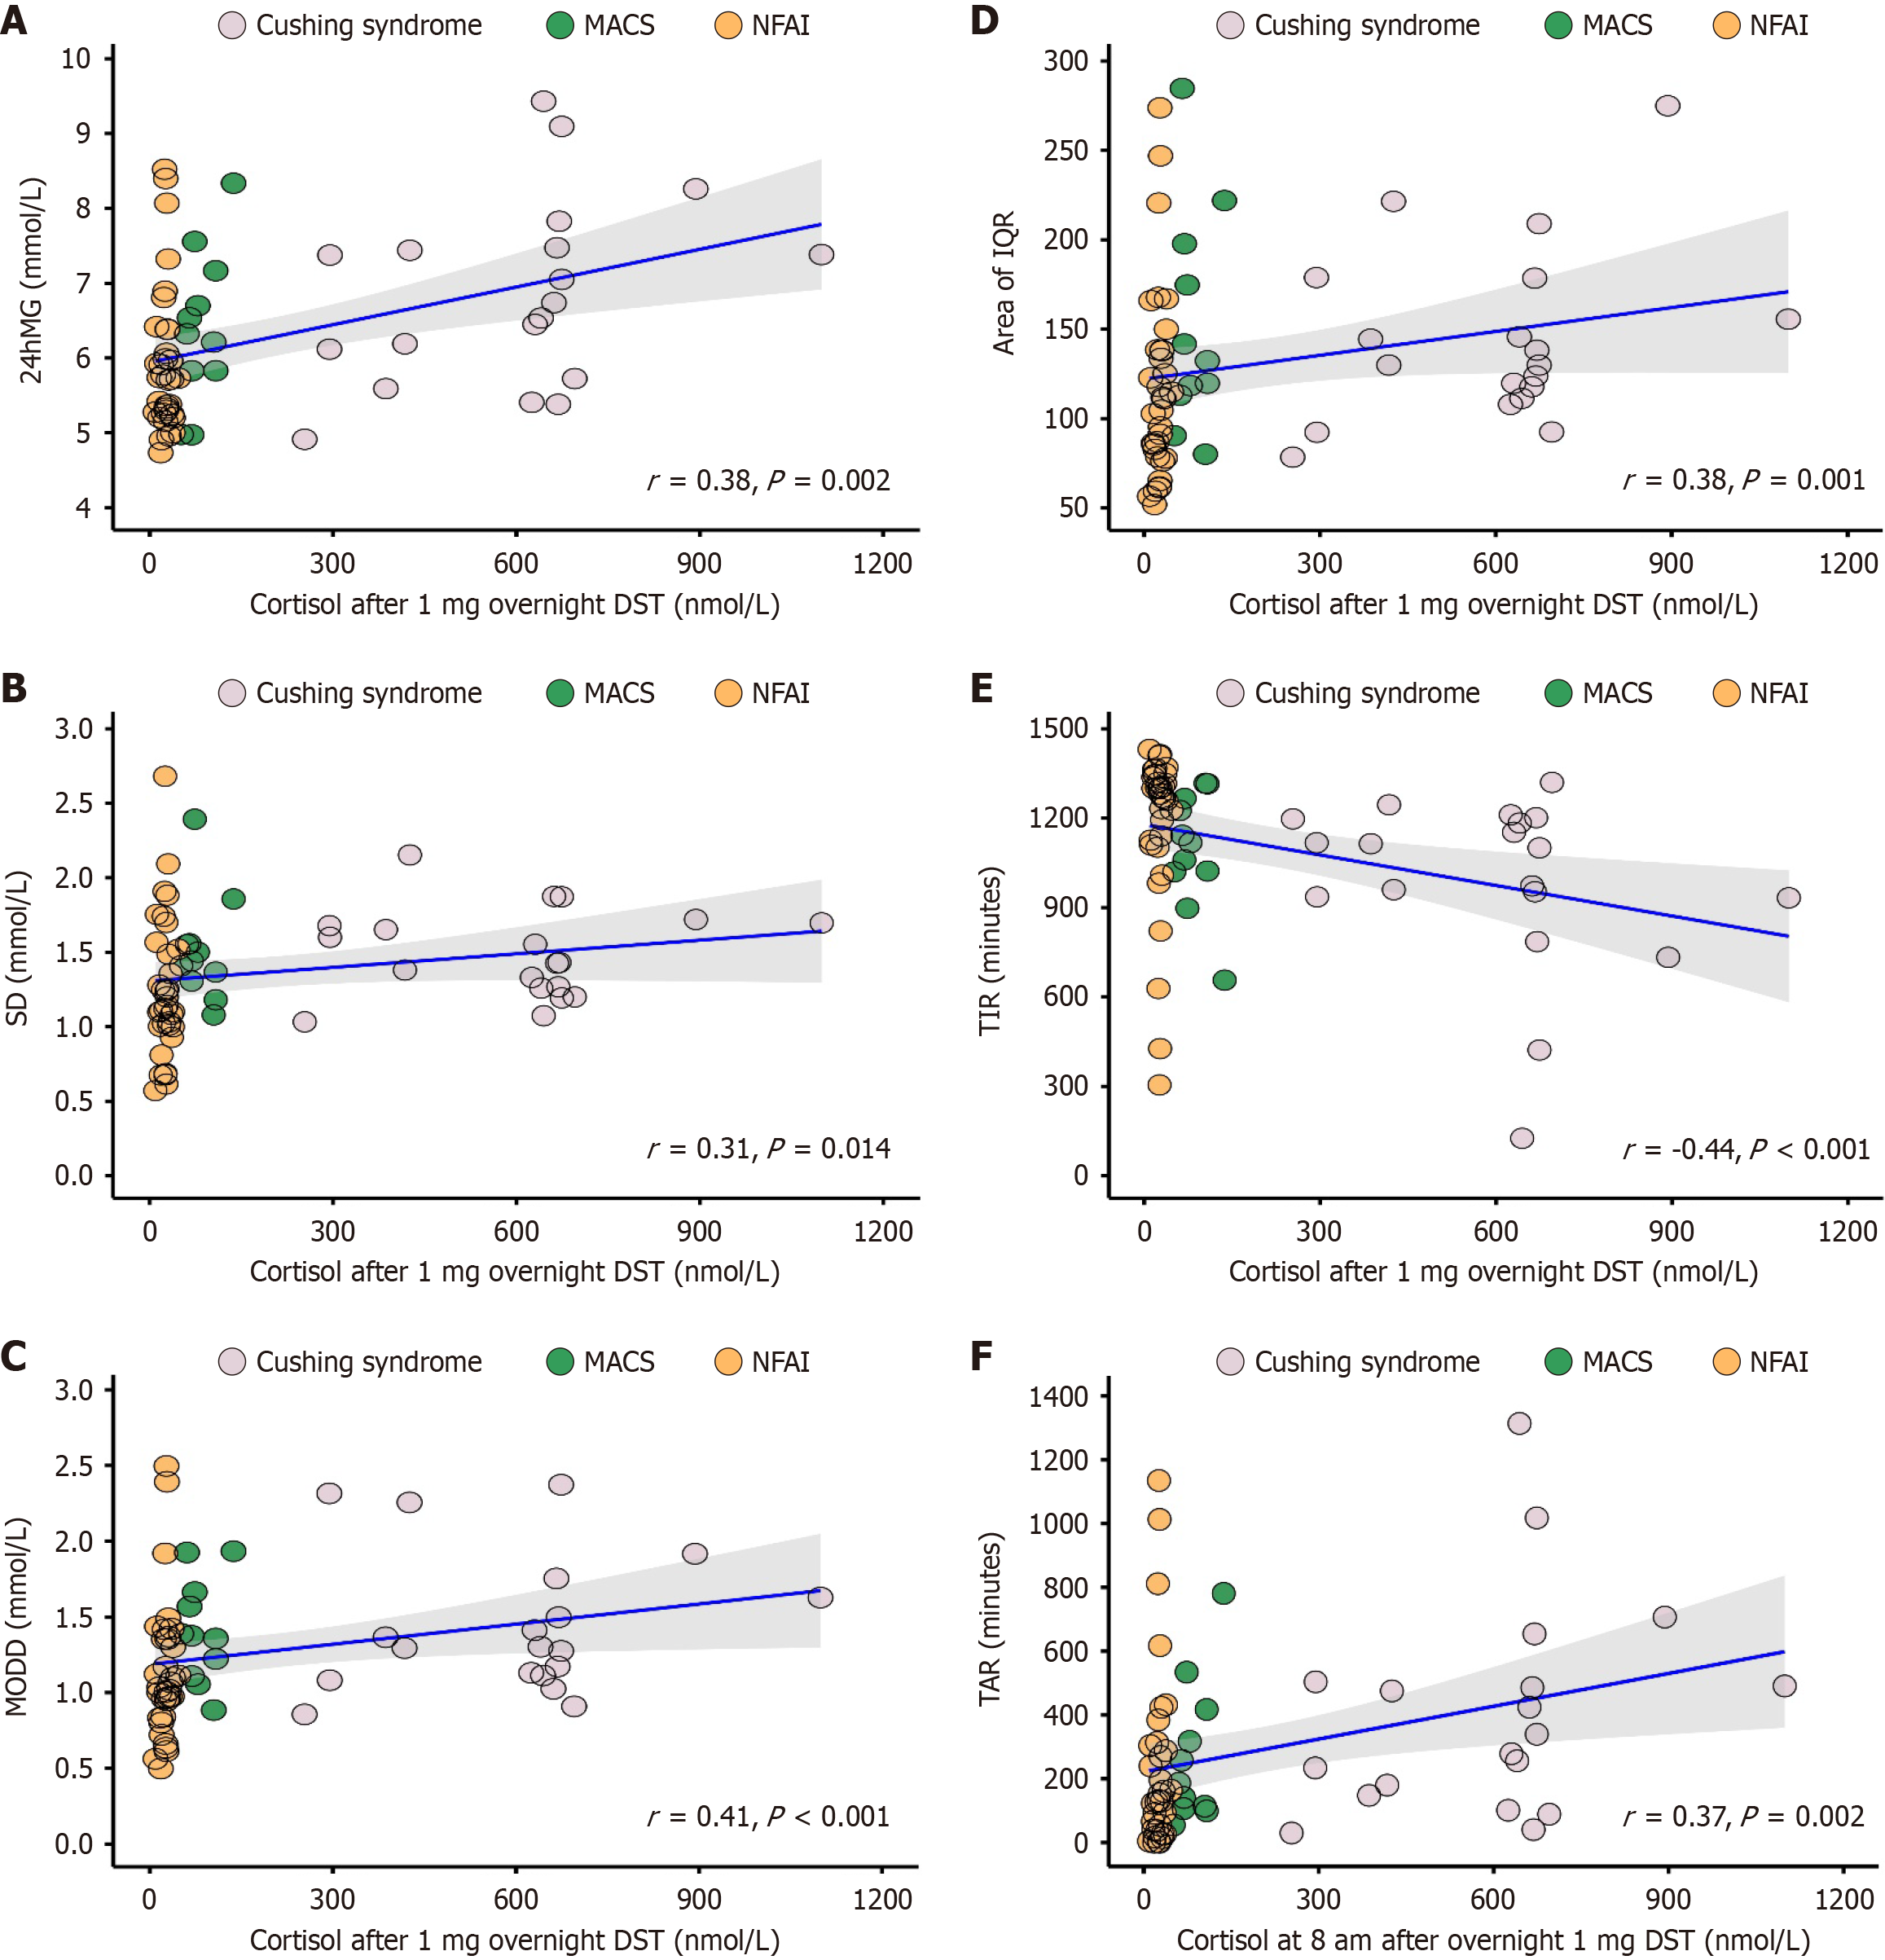
Figure 4 Significant correlation between cortisol after 1 mg overnight DST and continuous glucose monitoring system parameters.
A: 24-hour mean glucose (24MG); B: Standard deviation of sensor glucose (SD); C: Mean of daily difference (MODD); D: Area of interquartile range (IQR); E: Time above range (TAR); F: Time in range (TIR). DST: Dexamethasone suppression test; MACS: Mild autonomous cortisol secretion; NFAI: Nonfunctional adrenal incidentaloma.
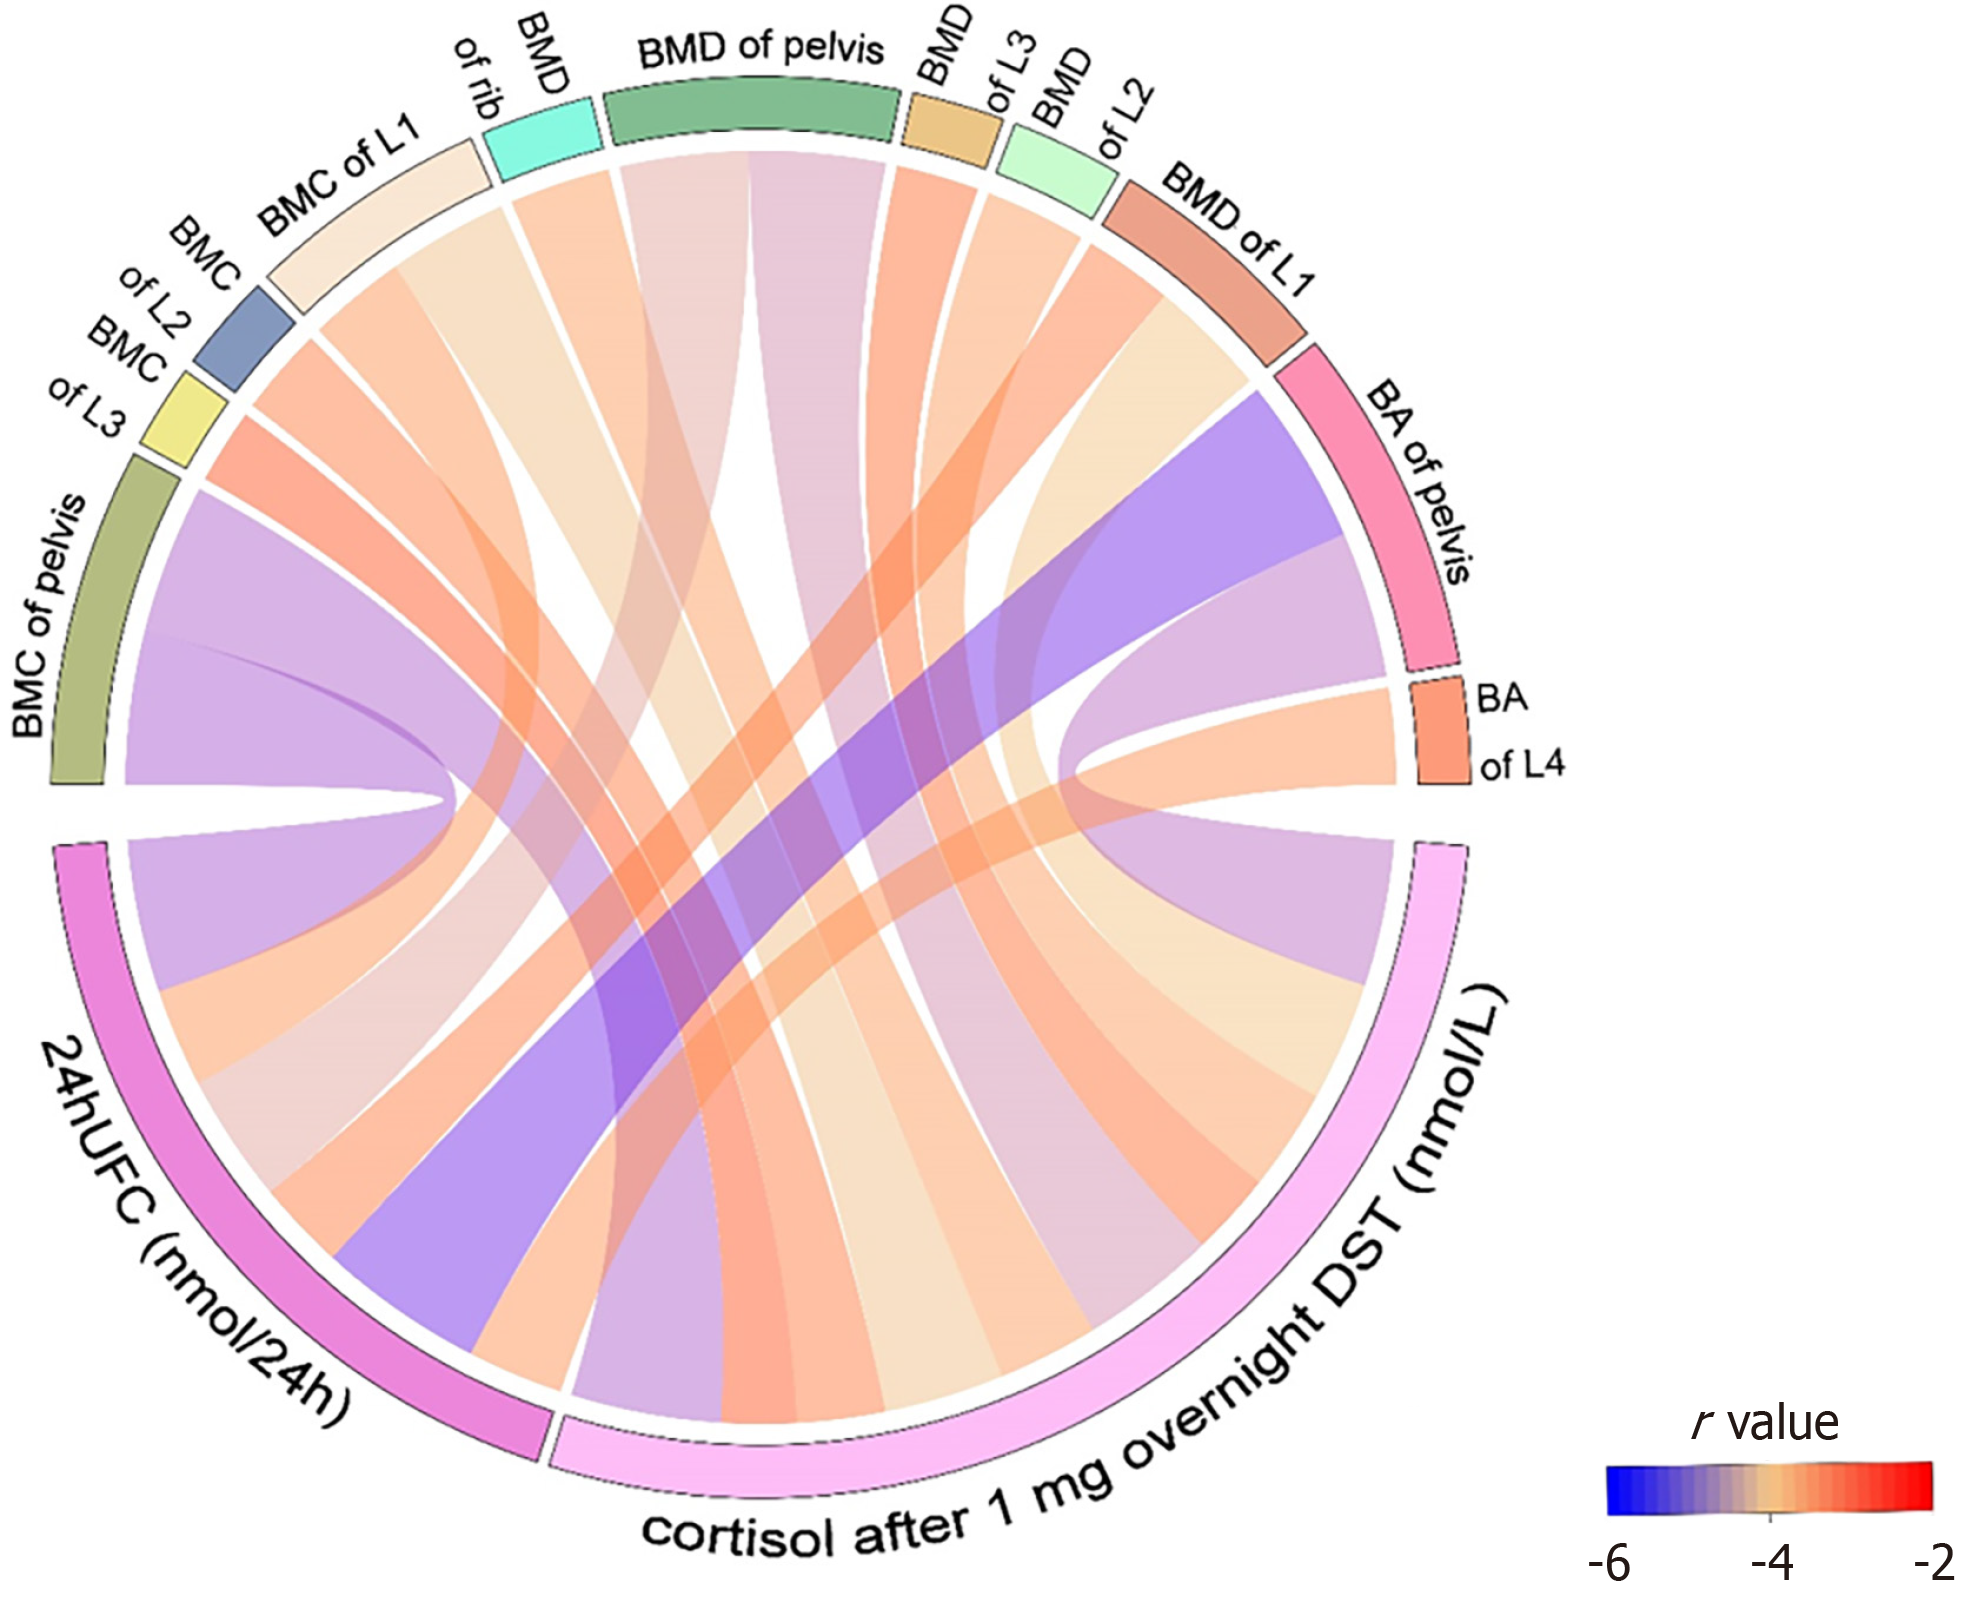
Figure 5 Significant correlation between cortisol after 1 mg overnight dexamethasone suppression test or 24-hour urine free cortisol and dual-energy X-ray absorptiometry parameters.
The width and color of the band represented the r value. 24h UFC: 24-hour urine free cortisol; BA: Bone area; BMC: Bone mineral content; BMD: Bone mineral density; DST: Dexamethasone suppression test; L: Lumbar vertebra.
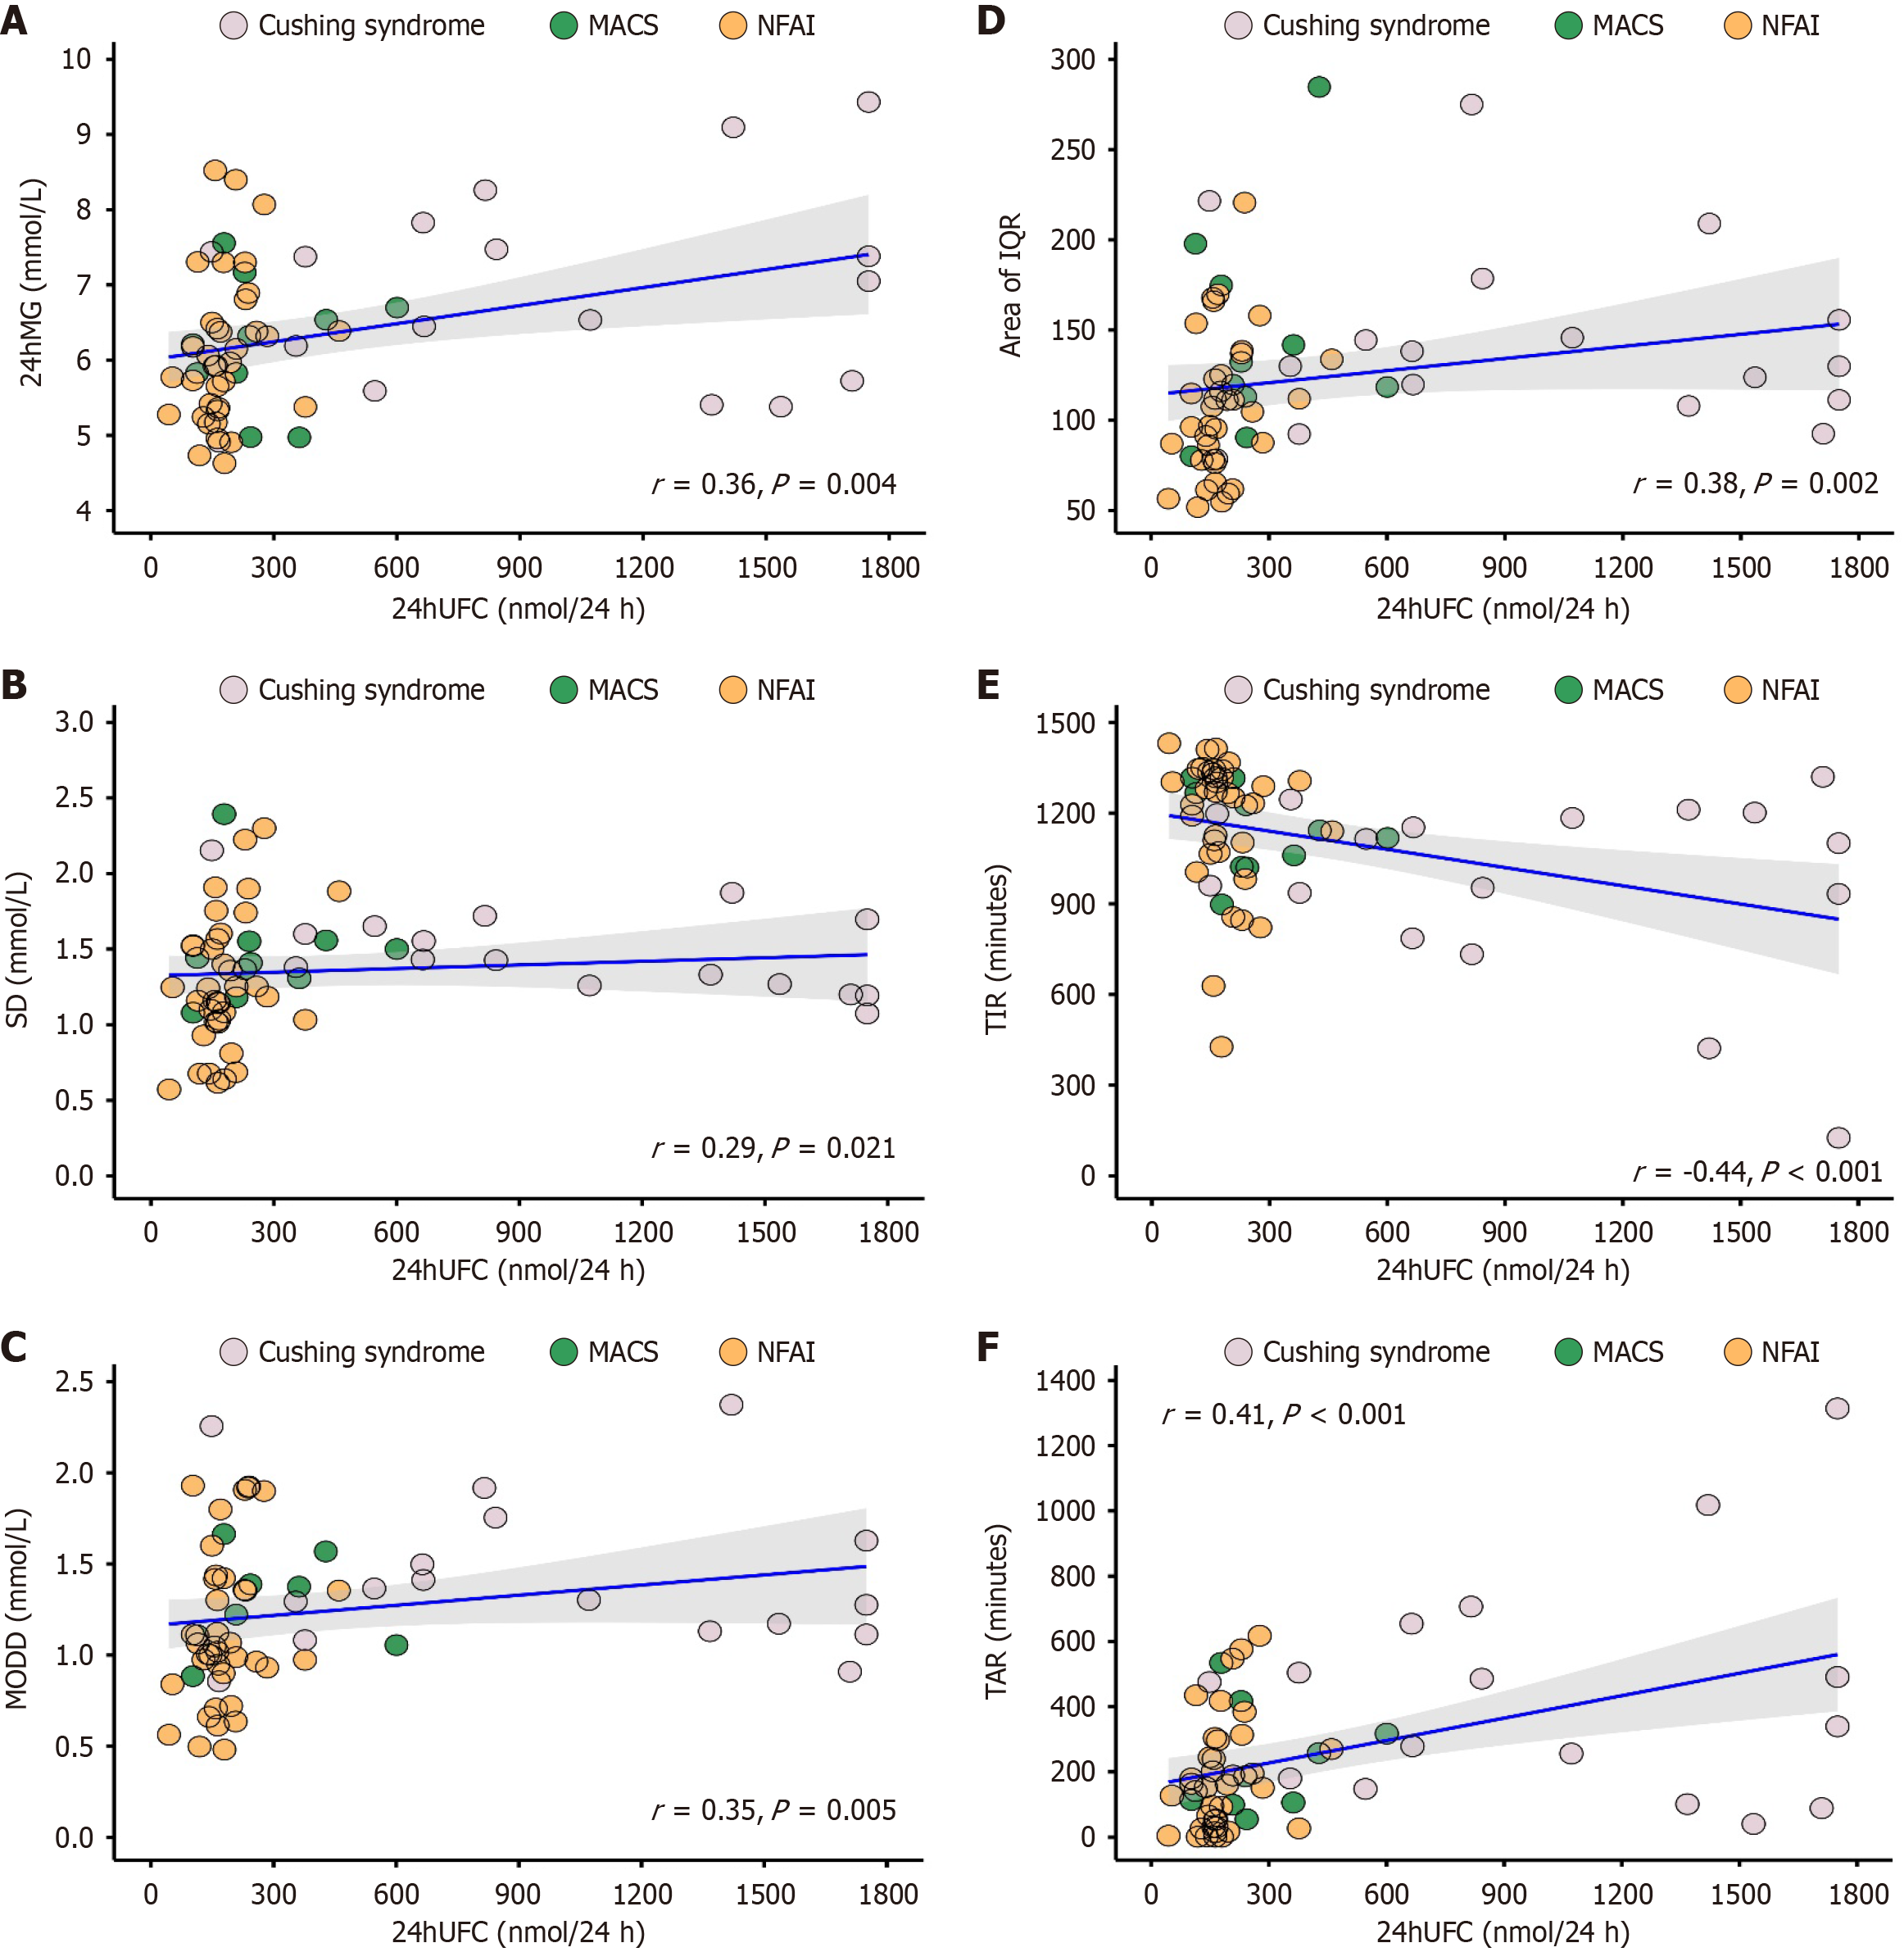
Figure 6 Significant correlation between 24h UFC and continuous glucose monitoring system parameters.
A: 24-hour mean glucose (24MG); B: Standard deviation of sensor glucose (SD); C: Mean of daily difference (MODD); D: Area of interquartile range (IQR); E: Time above range (TAR); F: Time in range (TIR). 24h UFC: 24-hour urine free cortisol; MACS: Mild autonomous cortisol secretion; NFAI: Nonfunctional adrenal incidentaloma.
- Citation: Han MM, Cao XM, Liu ZA, Zhang Y, Liu YF. Continuum of glucose and bone metabolism impairment across autonomous cortisol secretion: A cross-sectional study. World J Diabetes 2025; 16(3): 100580
- URL: https://www.wjgnet.com/1948-9358/full/v16/i3/100580.htm
- DOI: https://dx.doi.org/10.4239/wjd.v16.i3.100580


