Copyright
©The Author(s) 2025.
World J Diabetes. Feb 15, 2025; 16(2): 98085
Published online Feb 15, 2025. doi: 10.4239/wjd.v16.i2.98085
Published online Feb 15, 2025. doi: 10.4239/wjd.v16.i2.98085
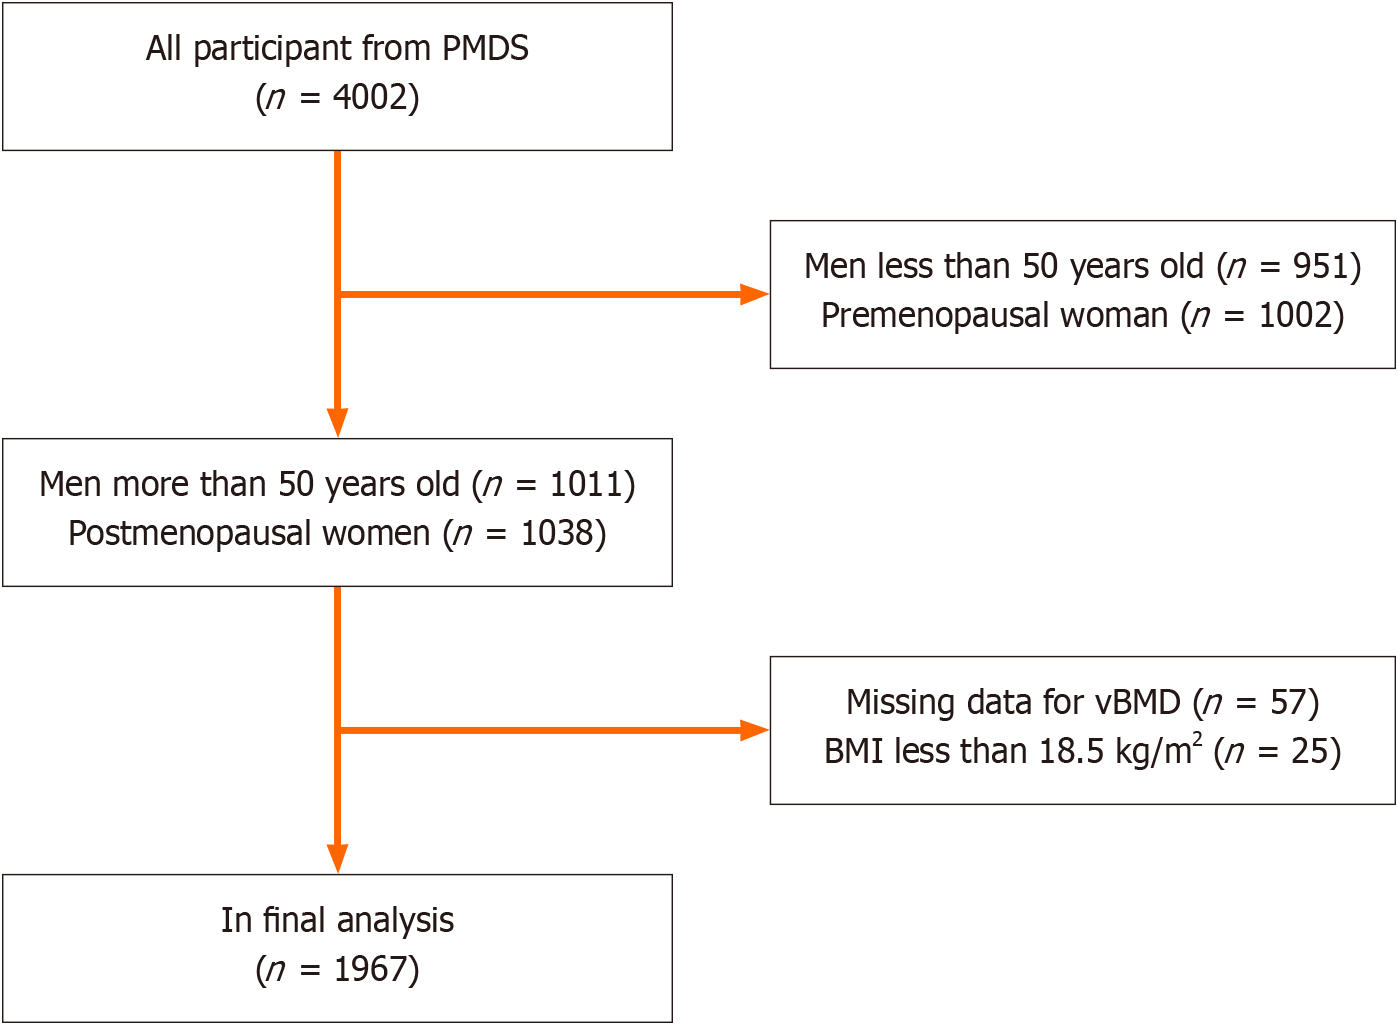
Figure 1 Flowchart of participant selection.
BMI: Body mass index; PMDS: The Pinggu Metabolic Disease Study; vBMD: Volumetric bone mineral density.
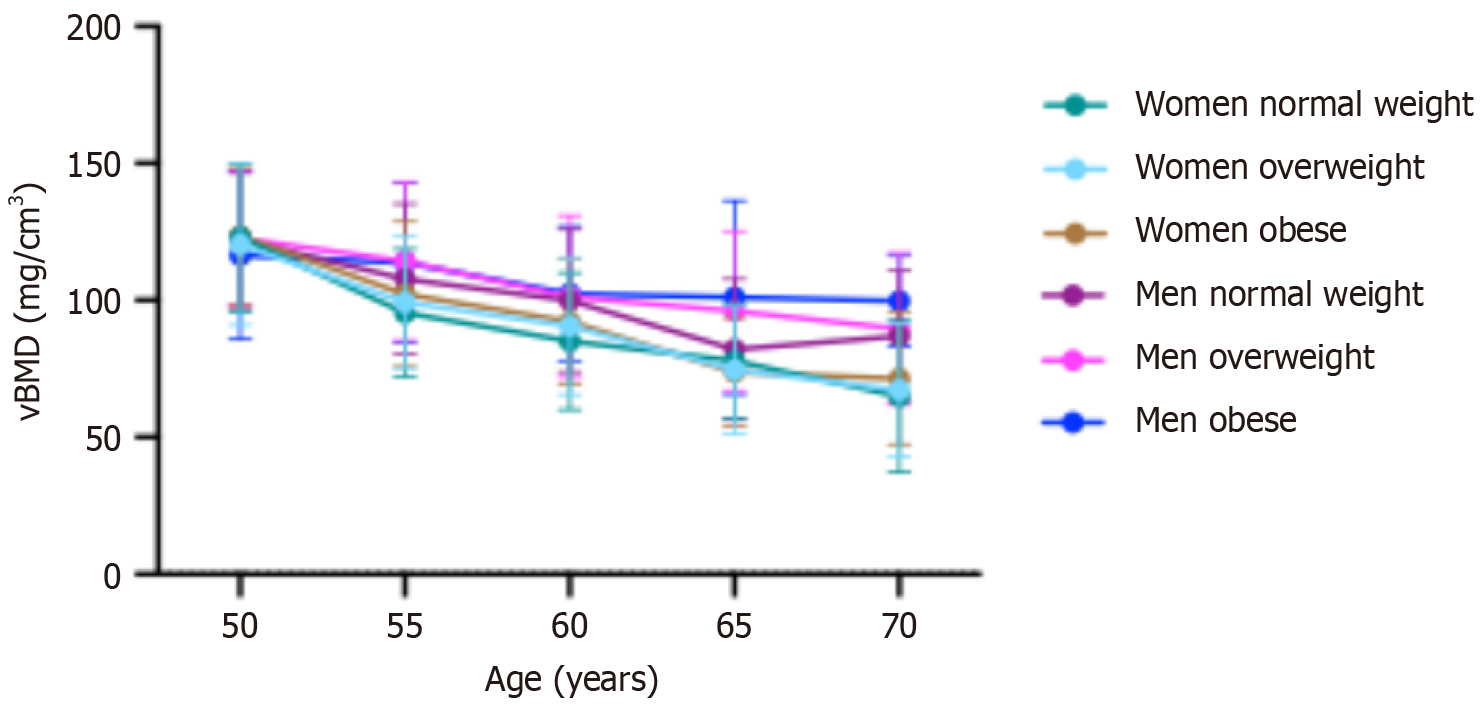
Figure 2 Mean values of volumetric bone mineral density with age stratified by body mass index and sex.
vBMD: Volumetric bone mineral density.
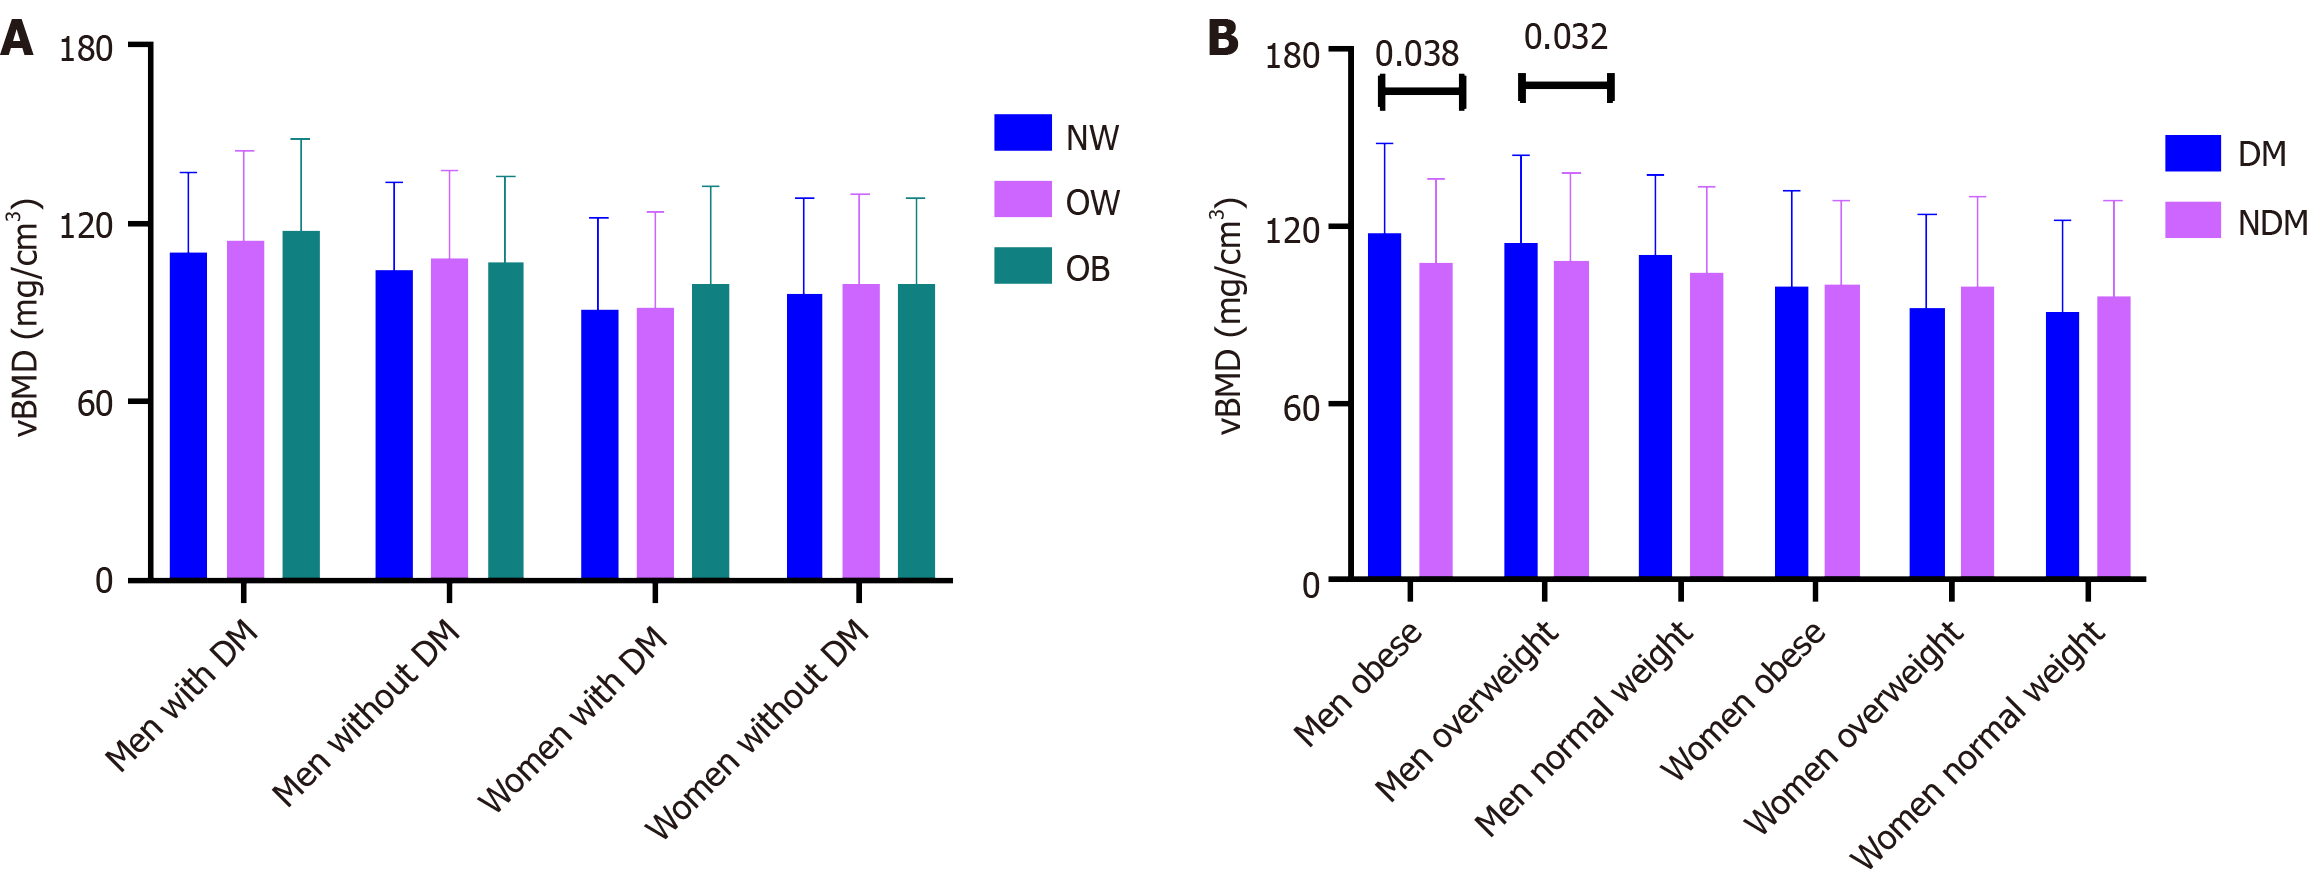
Figure 3 Values of volumetric bone mineral density stratified by body mass index and glucose metabolism.
A: Body mass index; B: Glucose metabolism. BMI: Body mass index; vBMD: Volumetric bone mineral density; NW: Normal weight; OW: Overweight; OB: Obesity; DM: Diabetes mellitus; NDM: Non-diabetes mellitus.
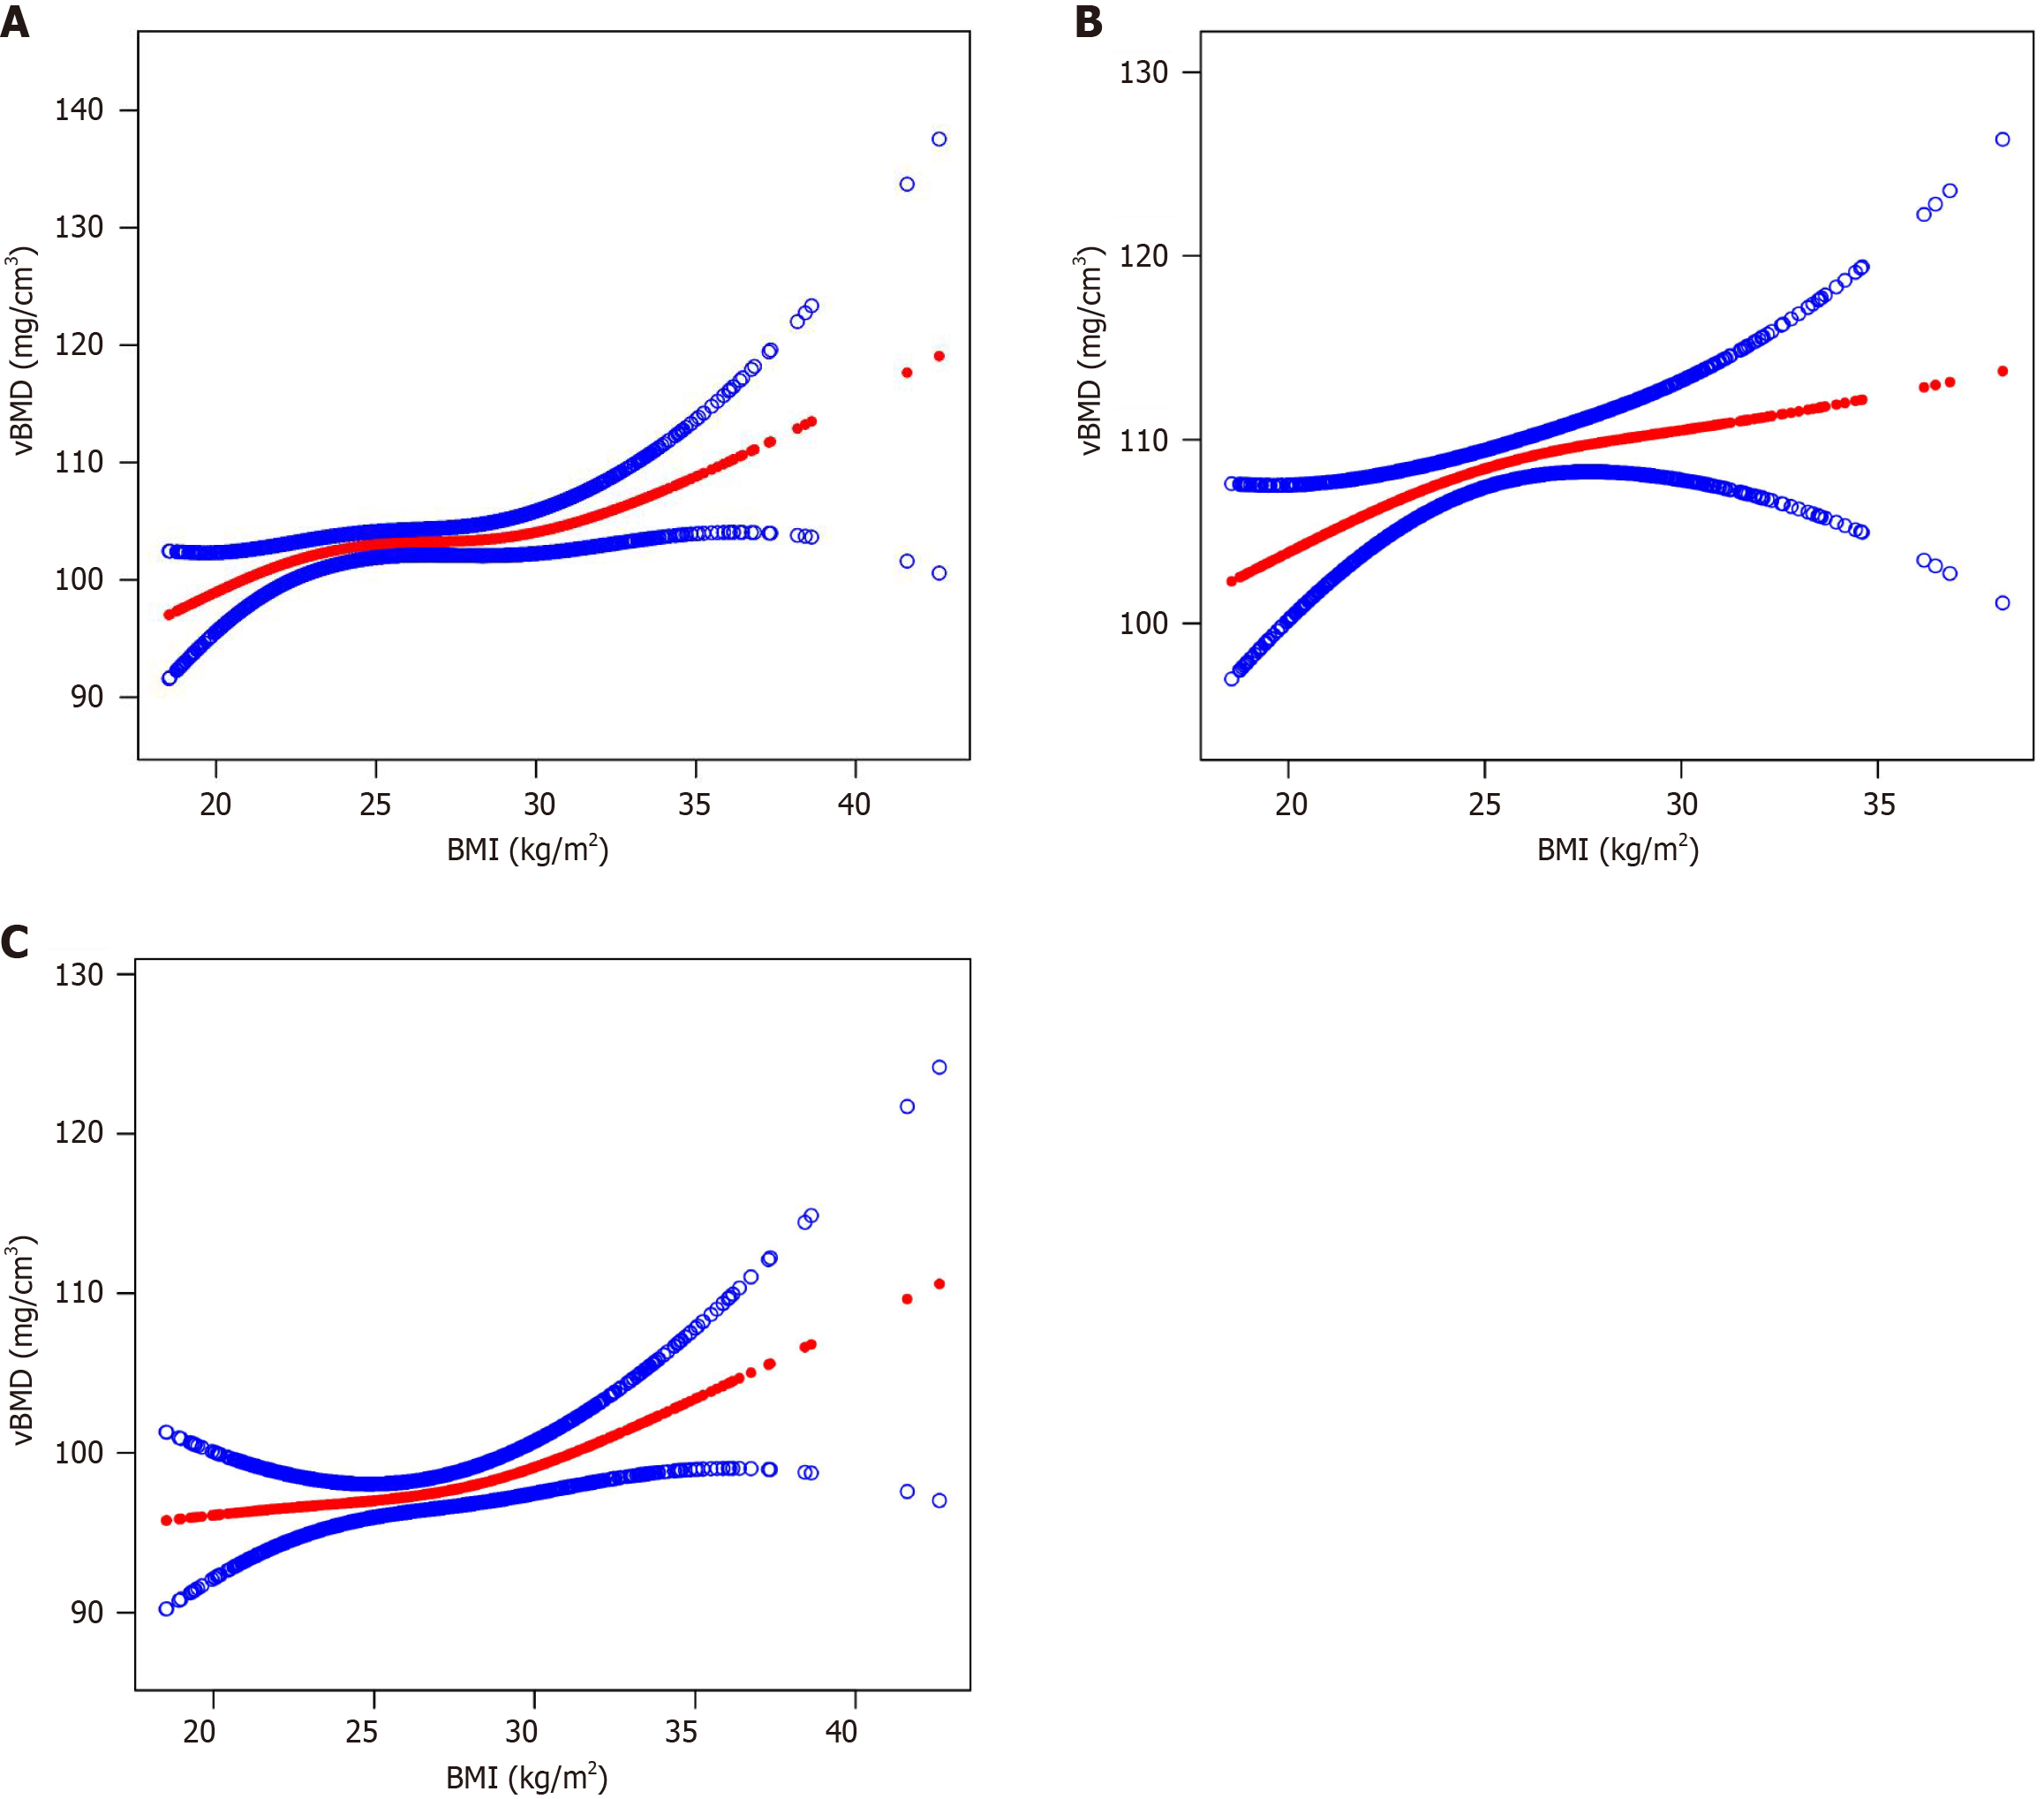
Figure 4 Association between body mass index and volumetric bone mineral density in total population, men, and women.
A: Total population; B: Men; C: Women. The solid red line represents the smooth curve fit between variables. Blue bands represent the 95%CI from the fit. BMI: Body mass index; vBMD: Volumetric bone mineral density.
- Citation: Lv F, Cai XL, Zhang XY, Zhou XH, Han XY, Li YF, Ji LN. Association between body mass index and lumbar spine volumetric bone mineral density in diabetic and non-diabetic patients. World J Diabetes 2025; 16(2): 98085
- URL: https://www.wjgnet.com/1948-9358/full/v16/i2/98085.htm
- DOI: https://dx.doi.org/10.4239/wjd.v16.i2.98085


