Copyright
©The Author(s) 2025.
World J Diabetes. Feb 15, 2025; 16(2): 94861
Published online Feb 15, 2025. doi: 10.4239/wjd.v16.i2.94861
Published online Feb 15, 2025. doi: 10.4239/wjd.v16.i2.94861
Figure 1 Dynamics of C-peptide and hemoglobin A1c level of the proband.
A: The fasting and postprandial C-peptide (CP) levels were measured after the type 2 diabetes mellitus (T2D) onset; B: The C-peptide levels (ΔCP = postprandial C-peptide-fasting C-peptide) were calculated after the T2D onset; C: The changes in hemoglobin A1c levels were tested after the T2D onset. DM: Diabetes mellitus; CP: C-peptide; HbA1c: Hemoglobin A1c.
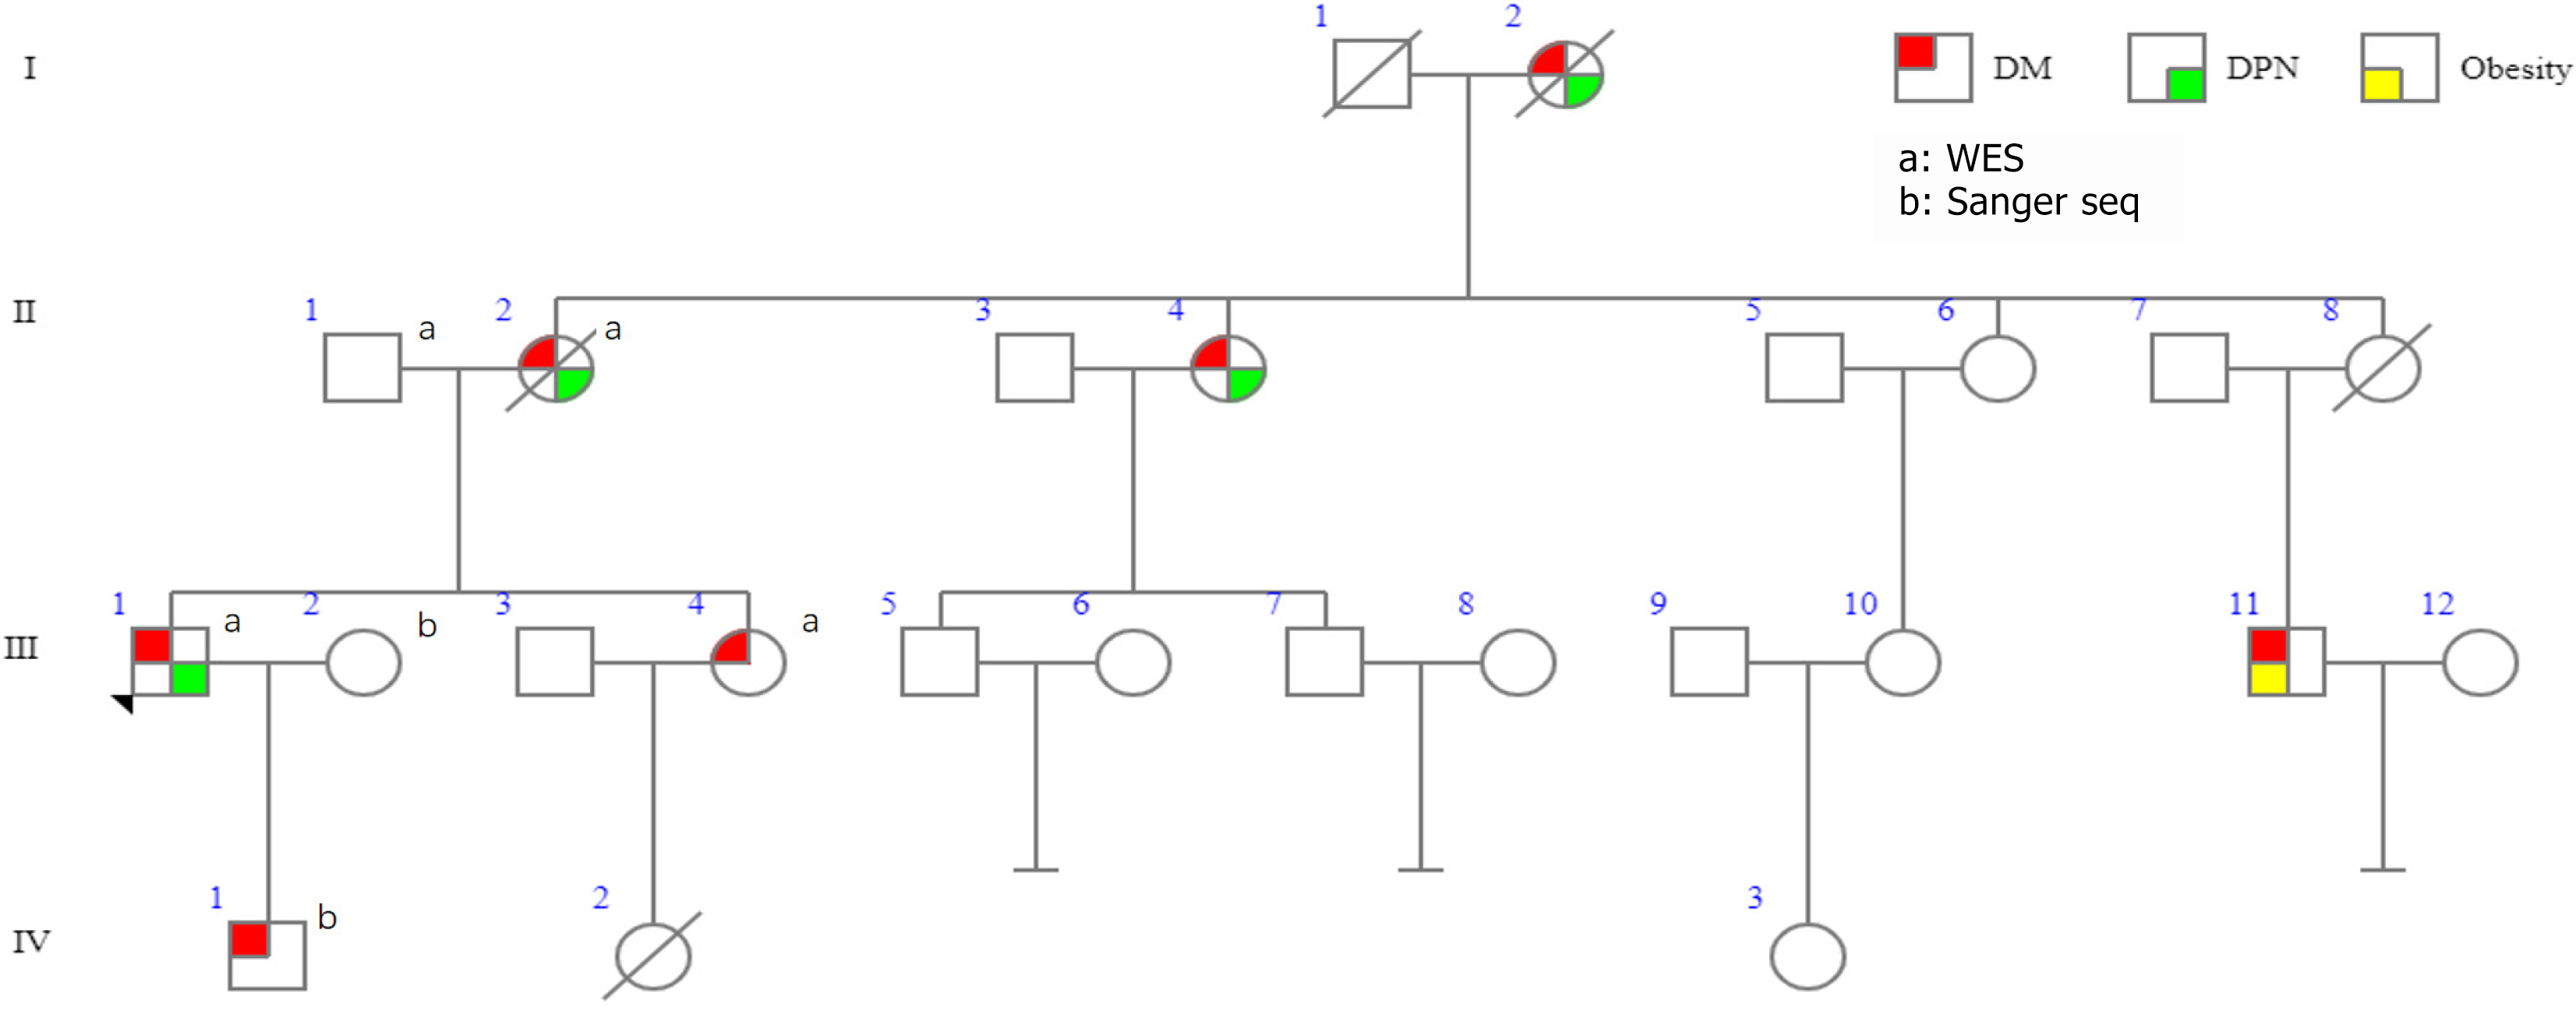
Figure 2 The patients’ family tree.
The family tree of the proband. Black arrow was proband (III-1). Red symbols indicate family members who developed type 2 diabetes mellitus (I-2, II-2, II-4, III-1, III-4, III-11, and IV-1). Green symbols indicate diabetic peripheral neuropathy (I-2, II-2, II-4, III-1). Yellow symbols indicate obesity. DM: Diabetes mellitus; DPN: Diabetic peripheral neuropathy; WES: Whole-exome sequencing.
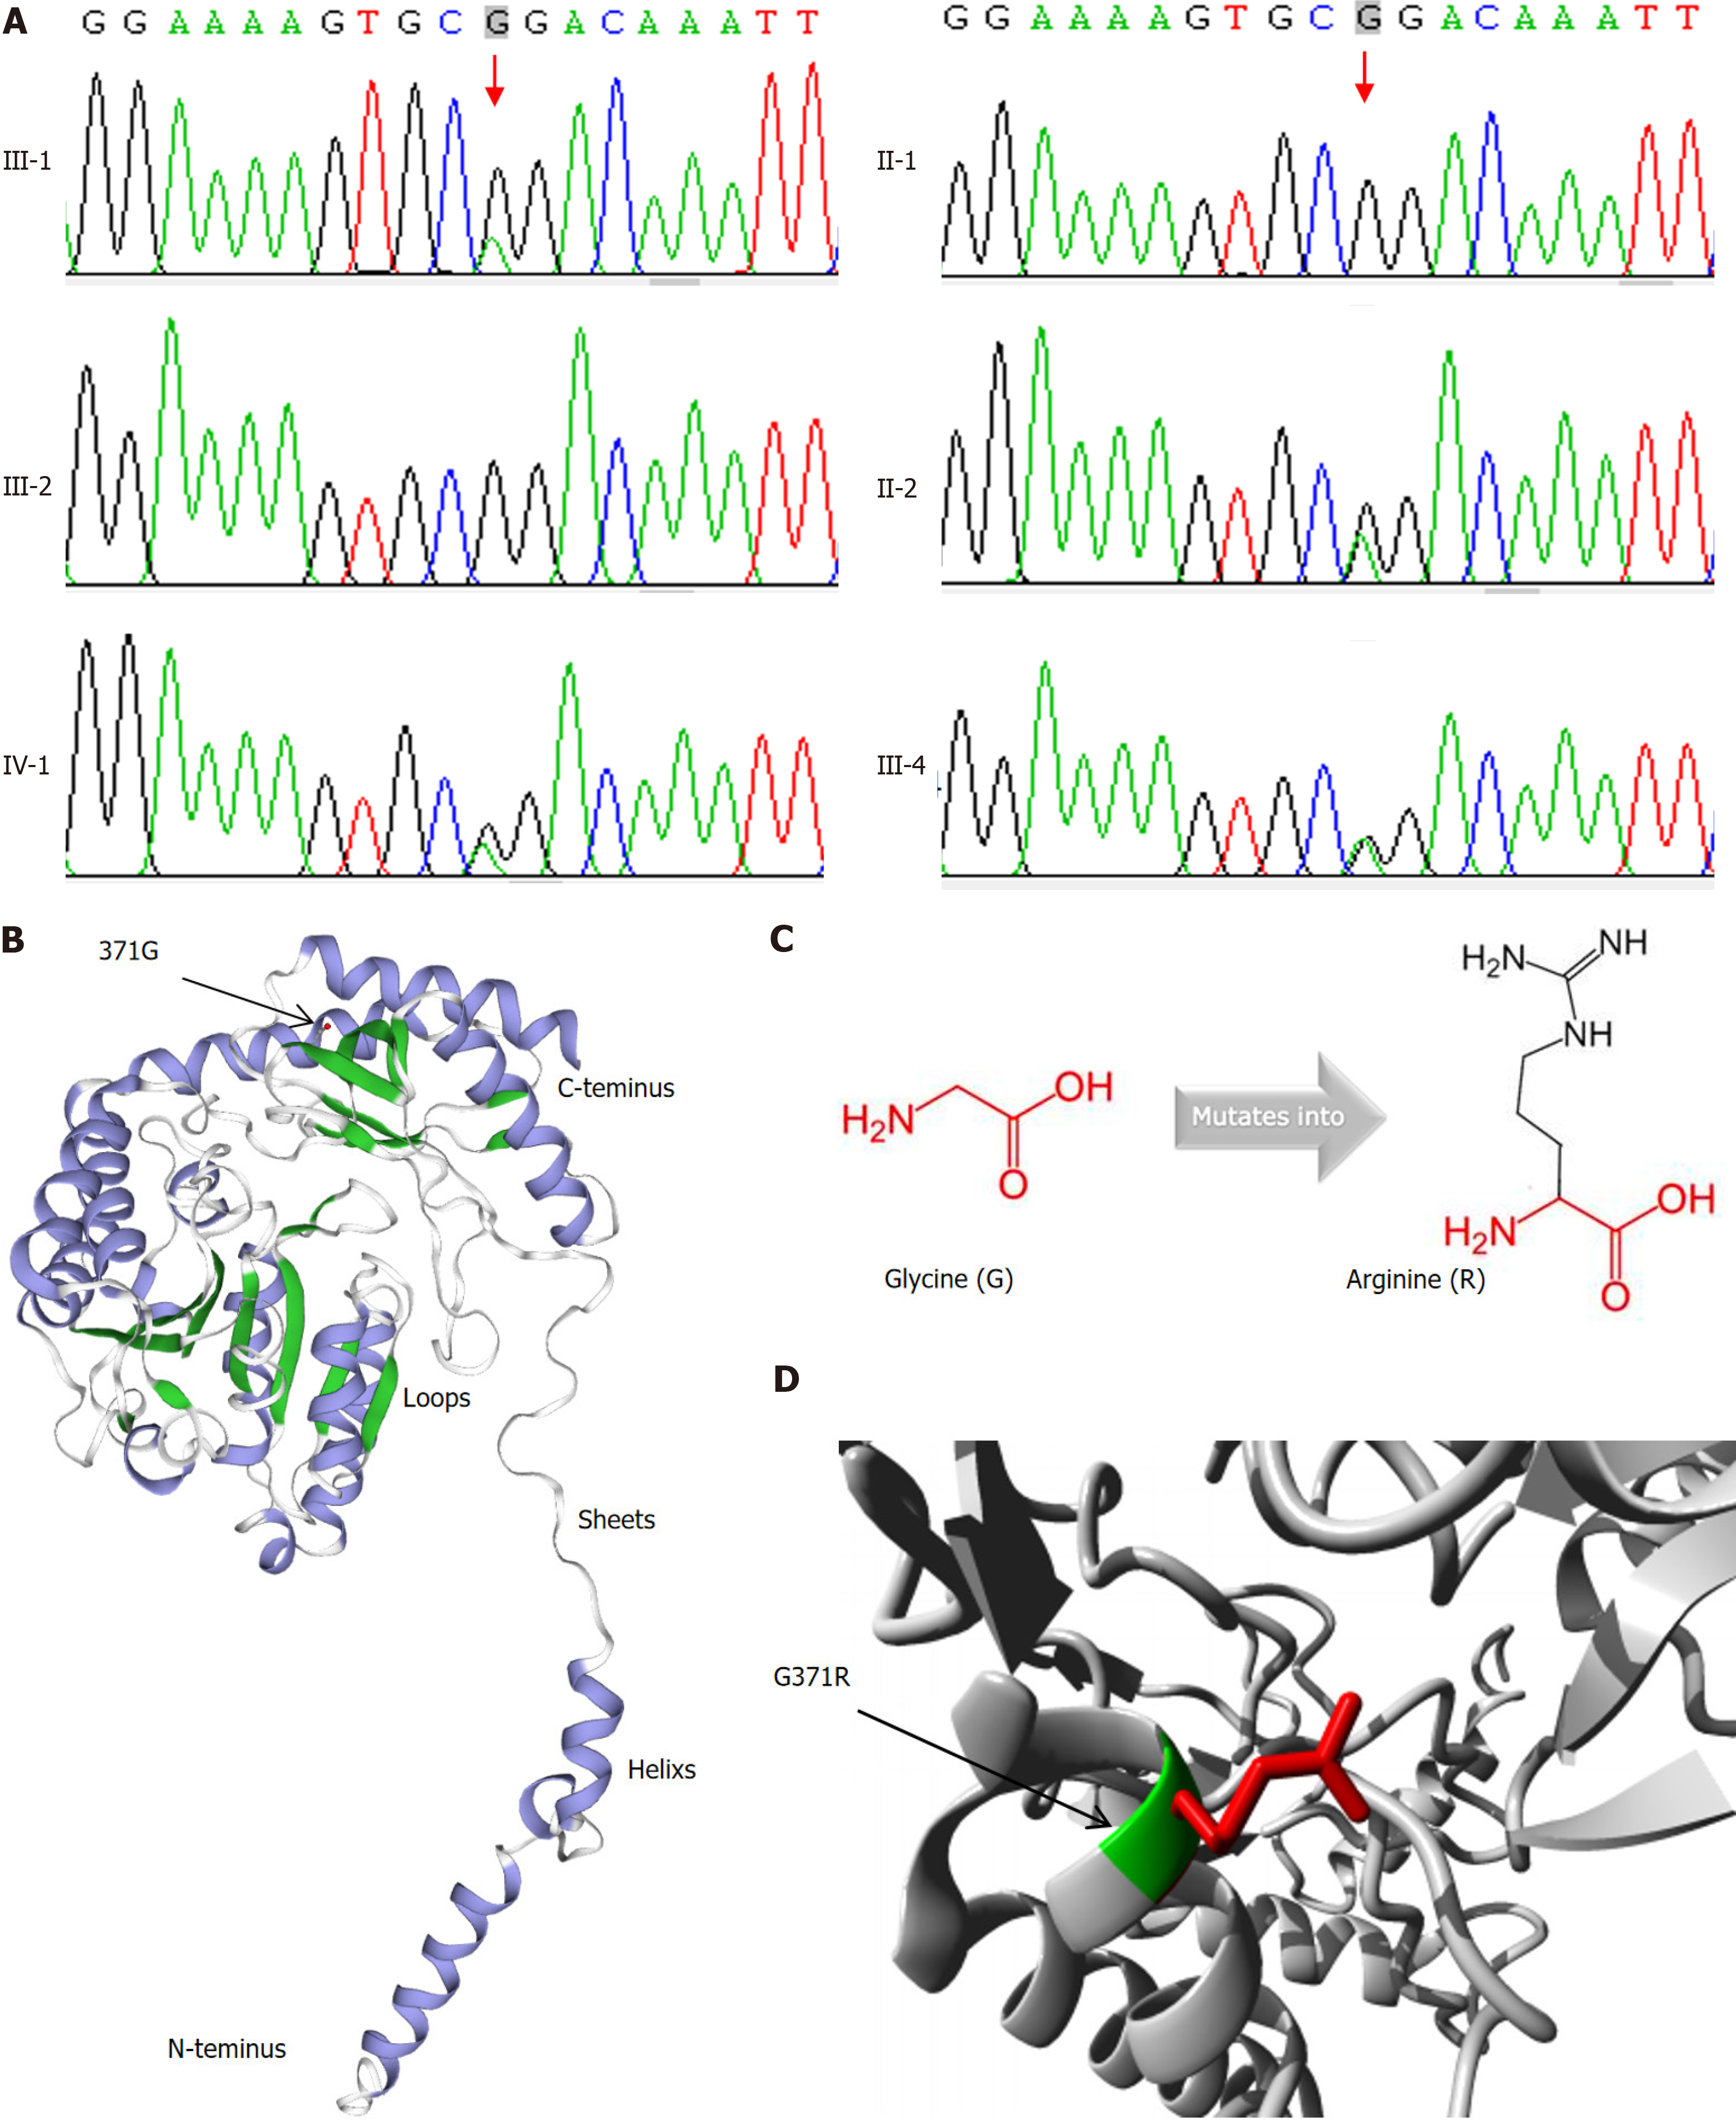
Figure 3 Description of the mutation.
A: The sanger sequence analysis of p.G371R mutation of SPTLC1 gene; B: Three dimensional (3D) structures of wild-type of human SPTLC1 gene; C: Structural formulas show that the mutant residue (R) is bigger than the wild-type residue (G); D: Zoomed 3D structure of mutation of human SPTLC1.
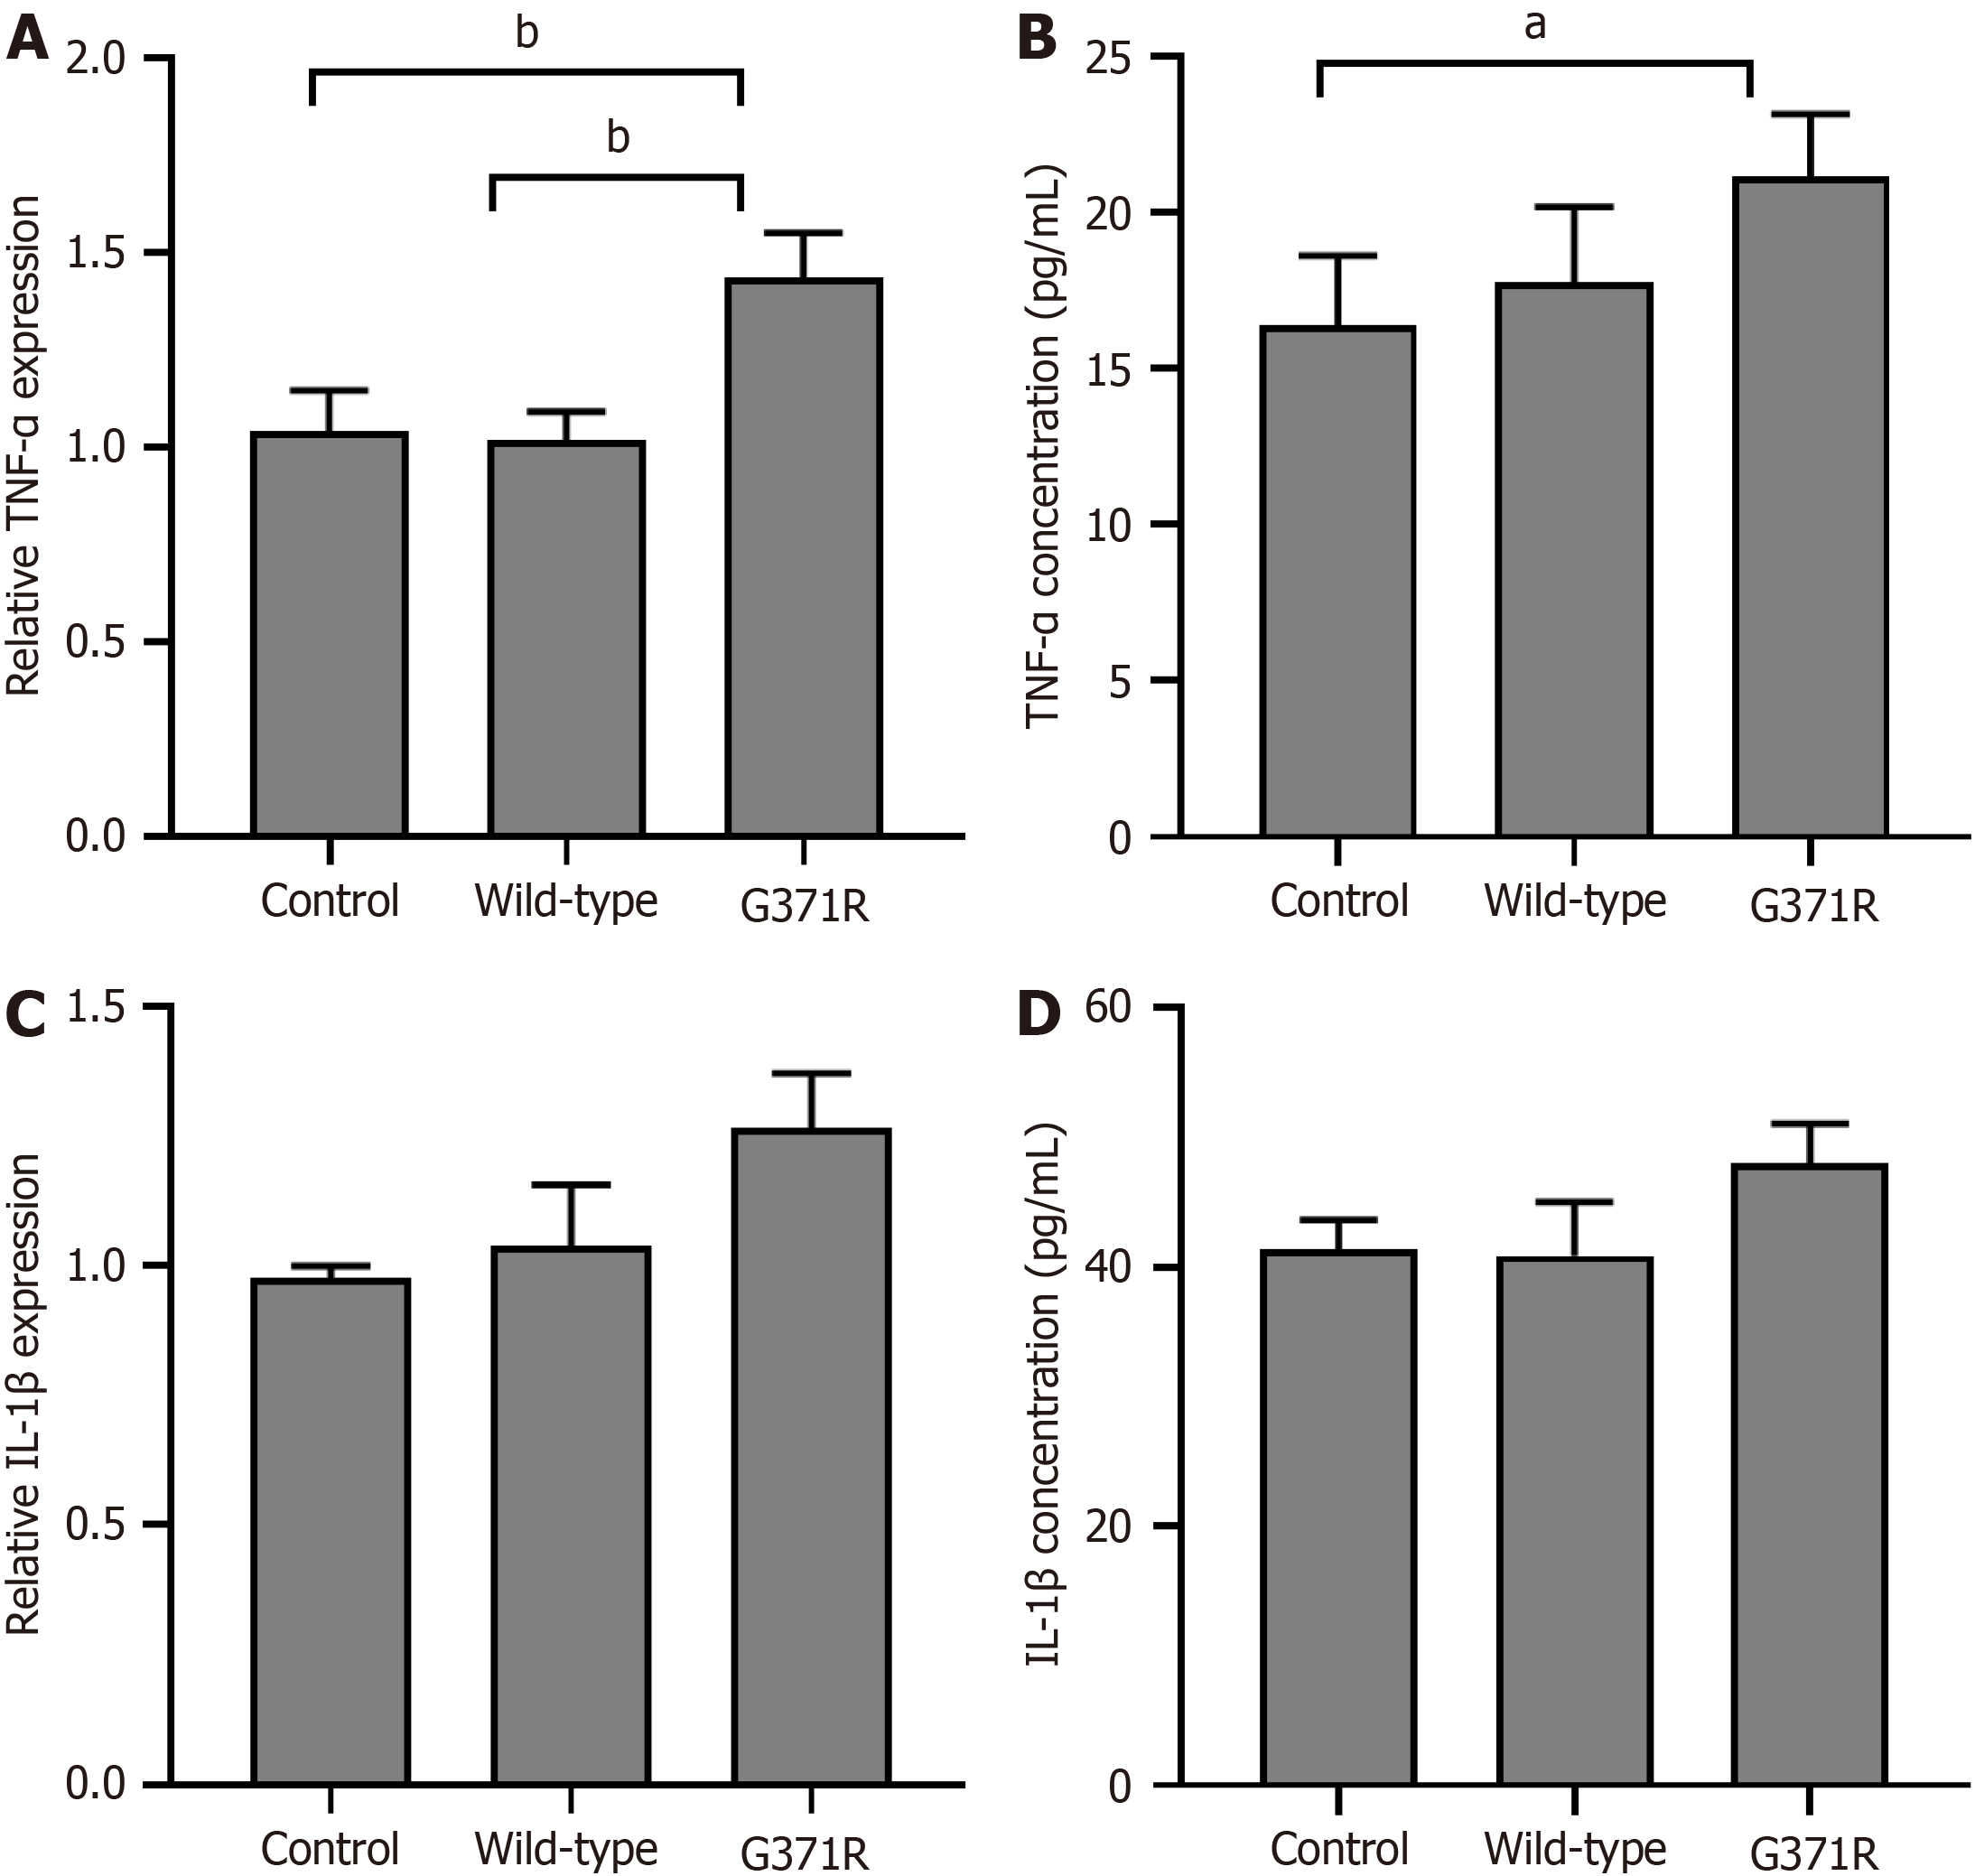
Figure 4 Effect of SPTLC1 p.
G371R on inflammatory cytokines in human embryonic kidney 293T cells. A and C: The relative expression of tumor necrosis factor-α (TNF-α) and interleukin-1β (IL-1β), respectively; B and D: The expression of TNF-α and IL-1β in cell supernatants from human embryonic kidney 293T cells. aP < 0.05; bP < 0.01. TNF-α: Tumor necrosis factor-α; IL-1β: Interleukin-1β.
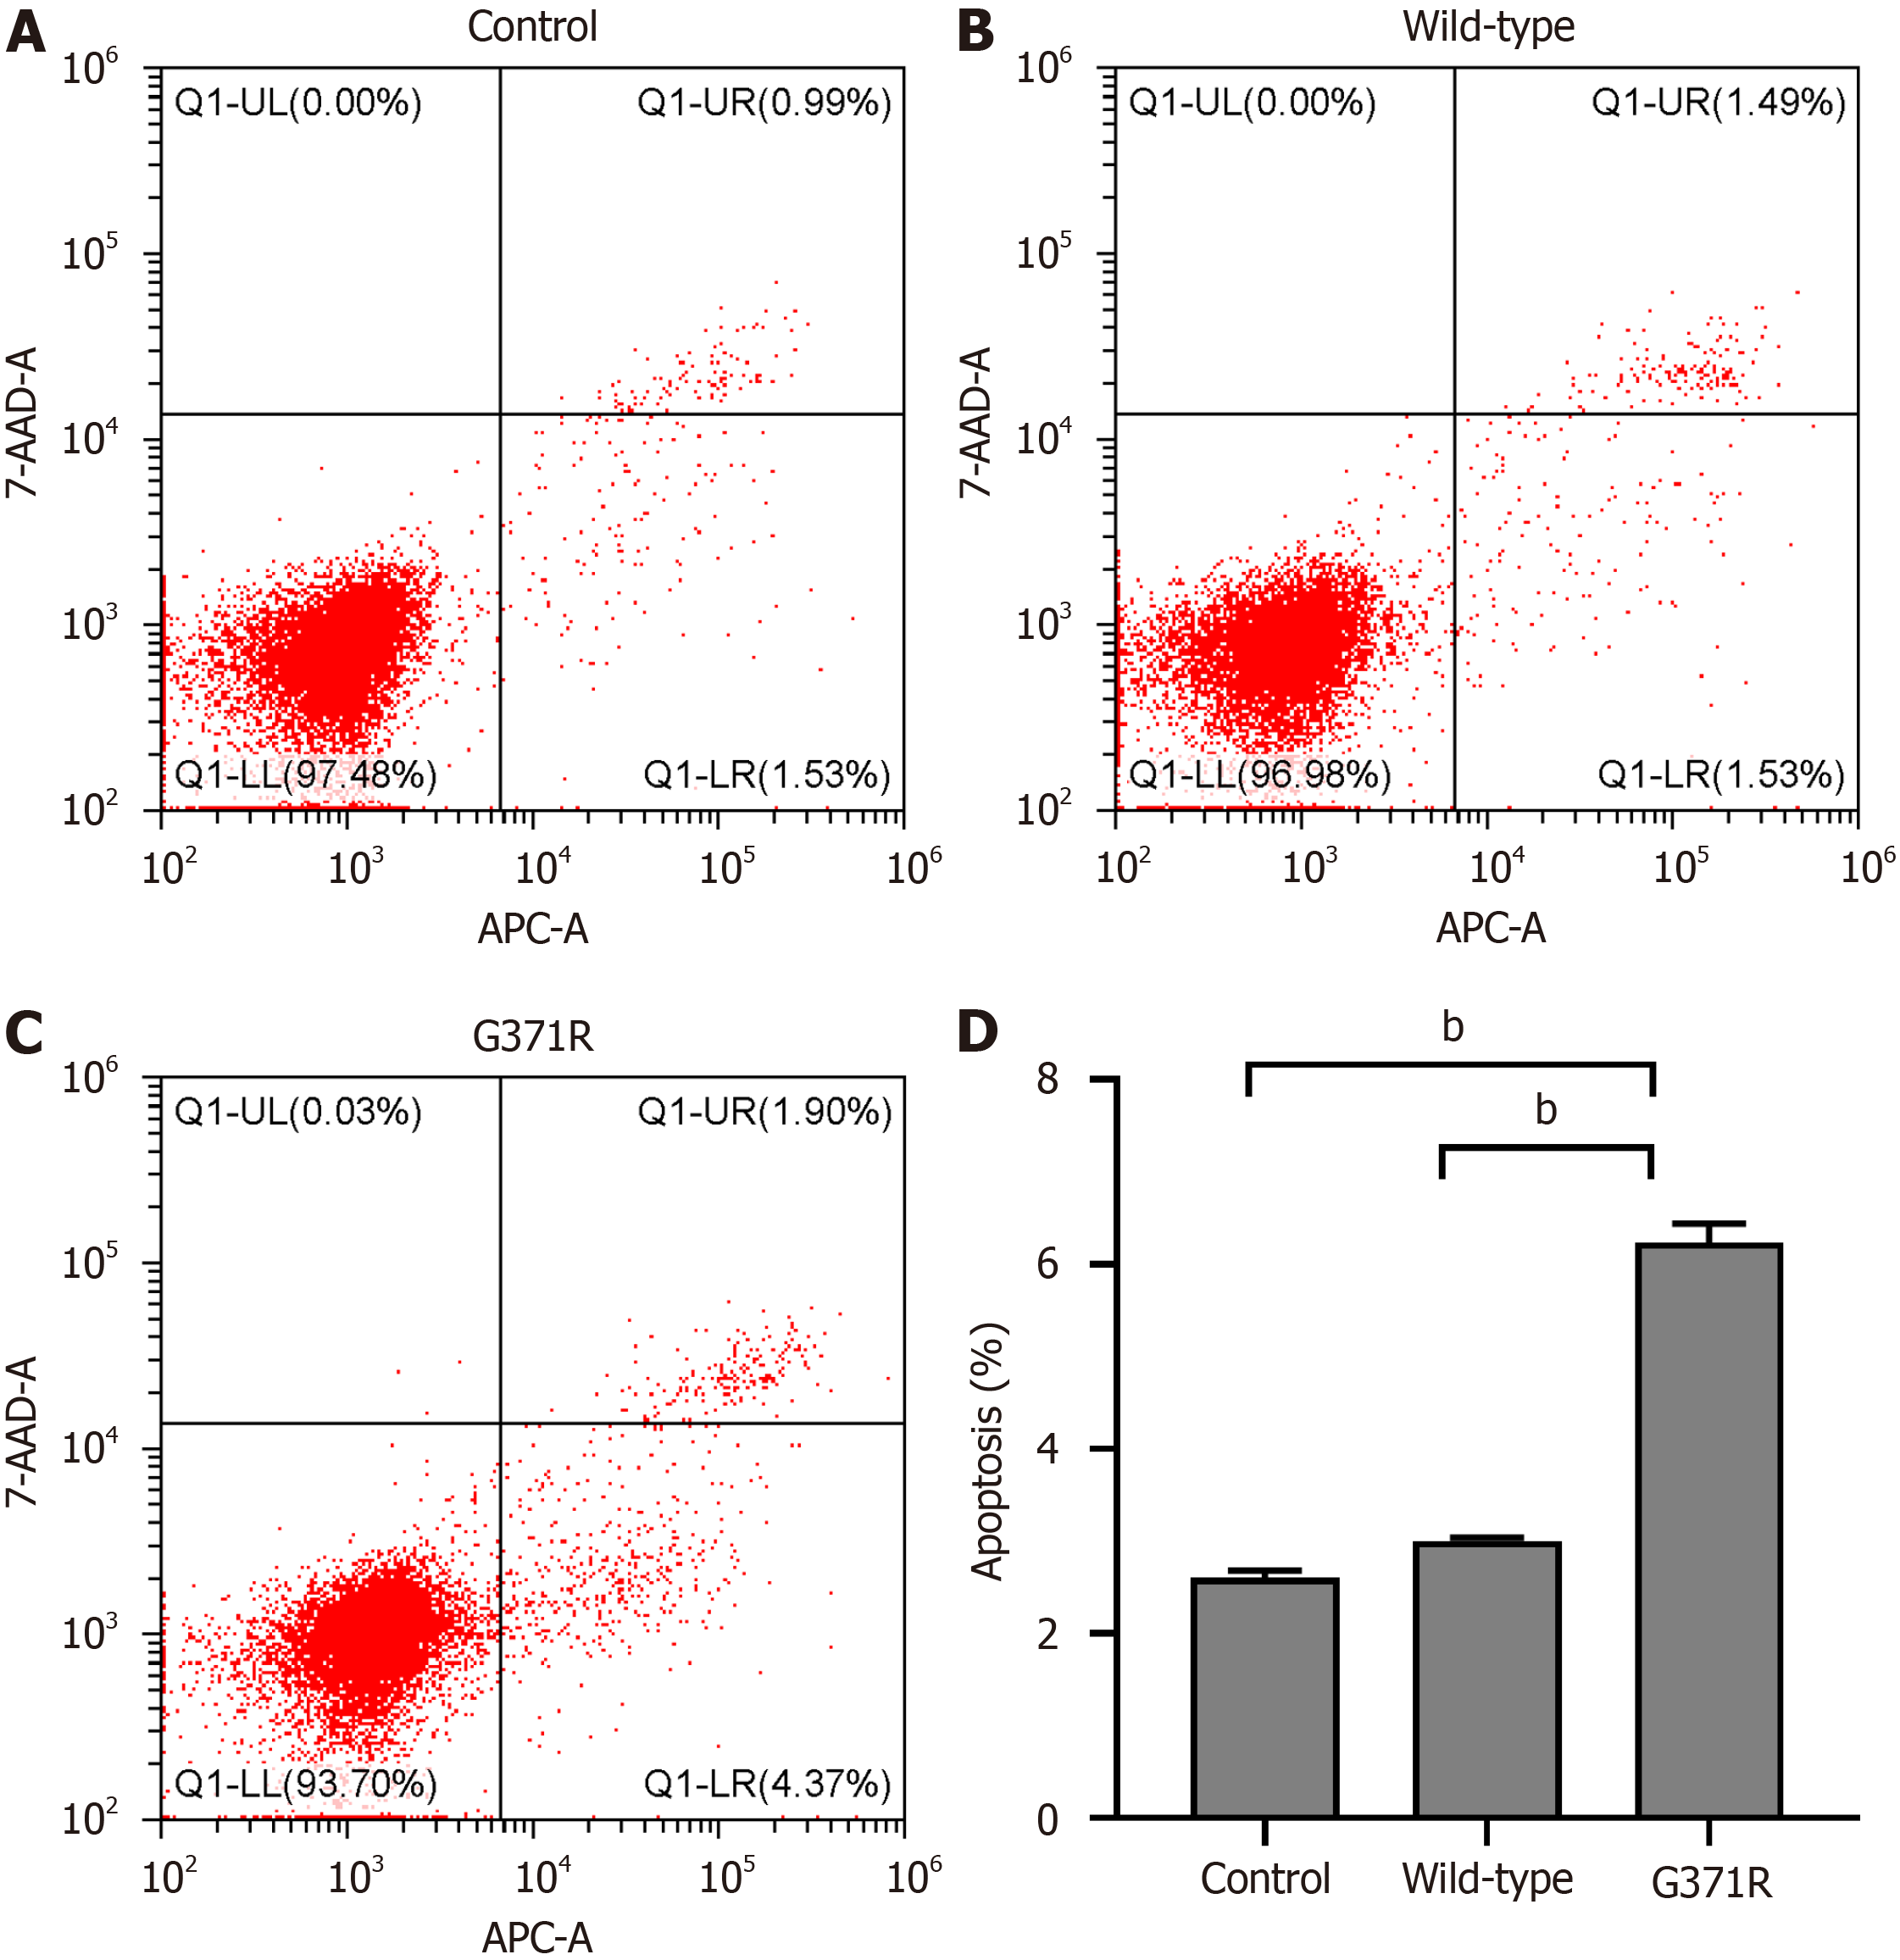
Figure 5 Effect of SPTLC1 p.
G371R on apoptosis in human embryonic kidney 293T cells.bP < 0.01. APC-A: Annexin V-allophycocyanin; 7-AAD-A: 7-Aminoactinomycin D.
Figure 6 Effect of SPTLC1 on type 2 diabetes mellitus in human islets from GSE25724.
A: The expression of SPTLC1 mRNA in human islet with or without type 2 diabetes mellitus; B: The correlation between the mRNA expression levels of SPTLC1 and insulin; C: The receiver operating characteristic curve analysis of SPTLC1 mRNA in type 2 diabetes mellitus. aP < 0.05. DM: Diabetes mellitus; T2D: Type 2 diabetes mellitus; AUC: Area under curve; CI: Confidence interval; INS: Insulin.
- Citation: Yi B, Bao Y, Wen ZY. Effect of SPTLC1 on type 2 diabetes mellitus. World J Diabetes 2025; 16(2): 94861
- URL: https://www.wjgnet.com/1948-9358/full/v16/i2/94861.htm
- DOI: https://dx.doi.org/10.4239/wjd.v16.i2.94861


