Copyright
©The Author(s) 2025.
World J Diabetes. Feb 15, 2025; 16(2): 101779
Published online Feb 15, 2025. doi: 10.4239/wjd.v16.i2.101779
Published online Feb 15, 2025. doi: 10.4239/wjd.v16.i2.101779
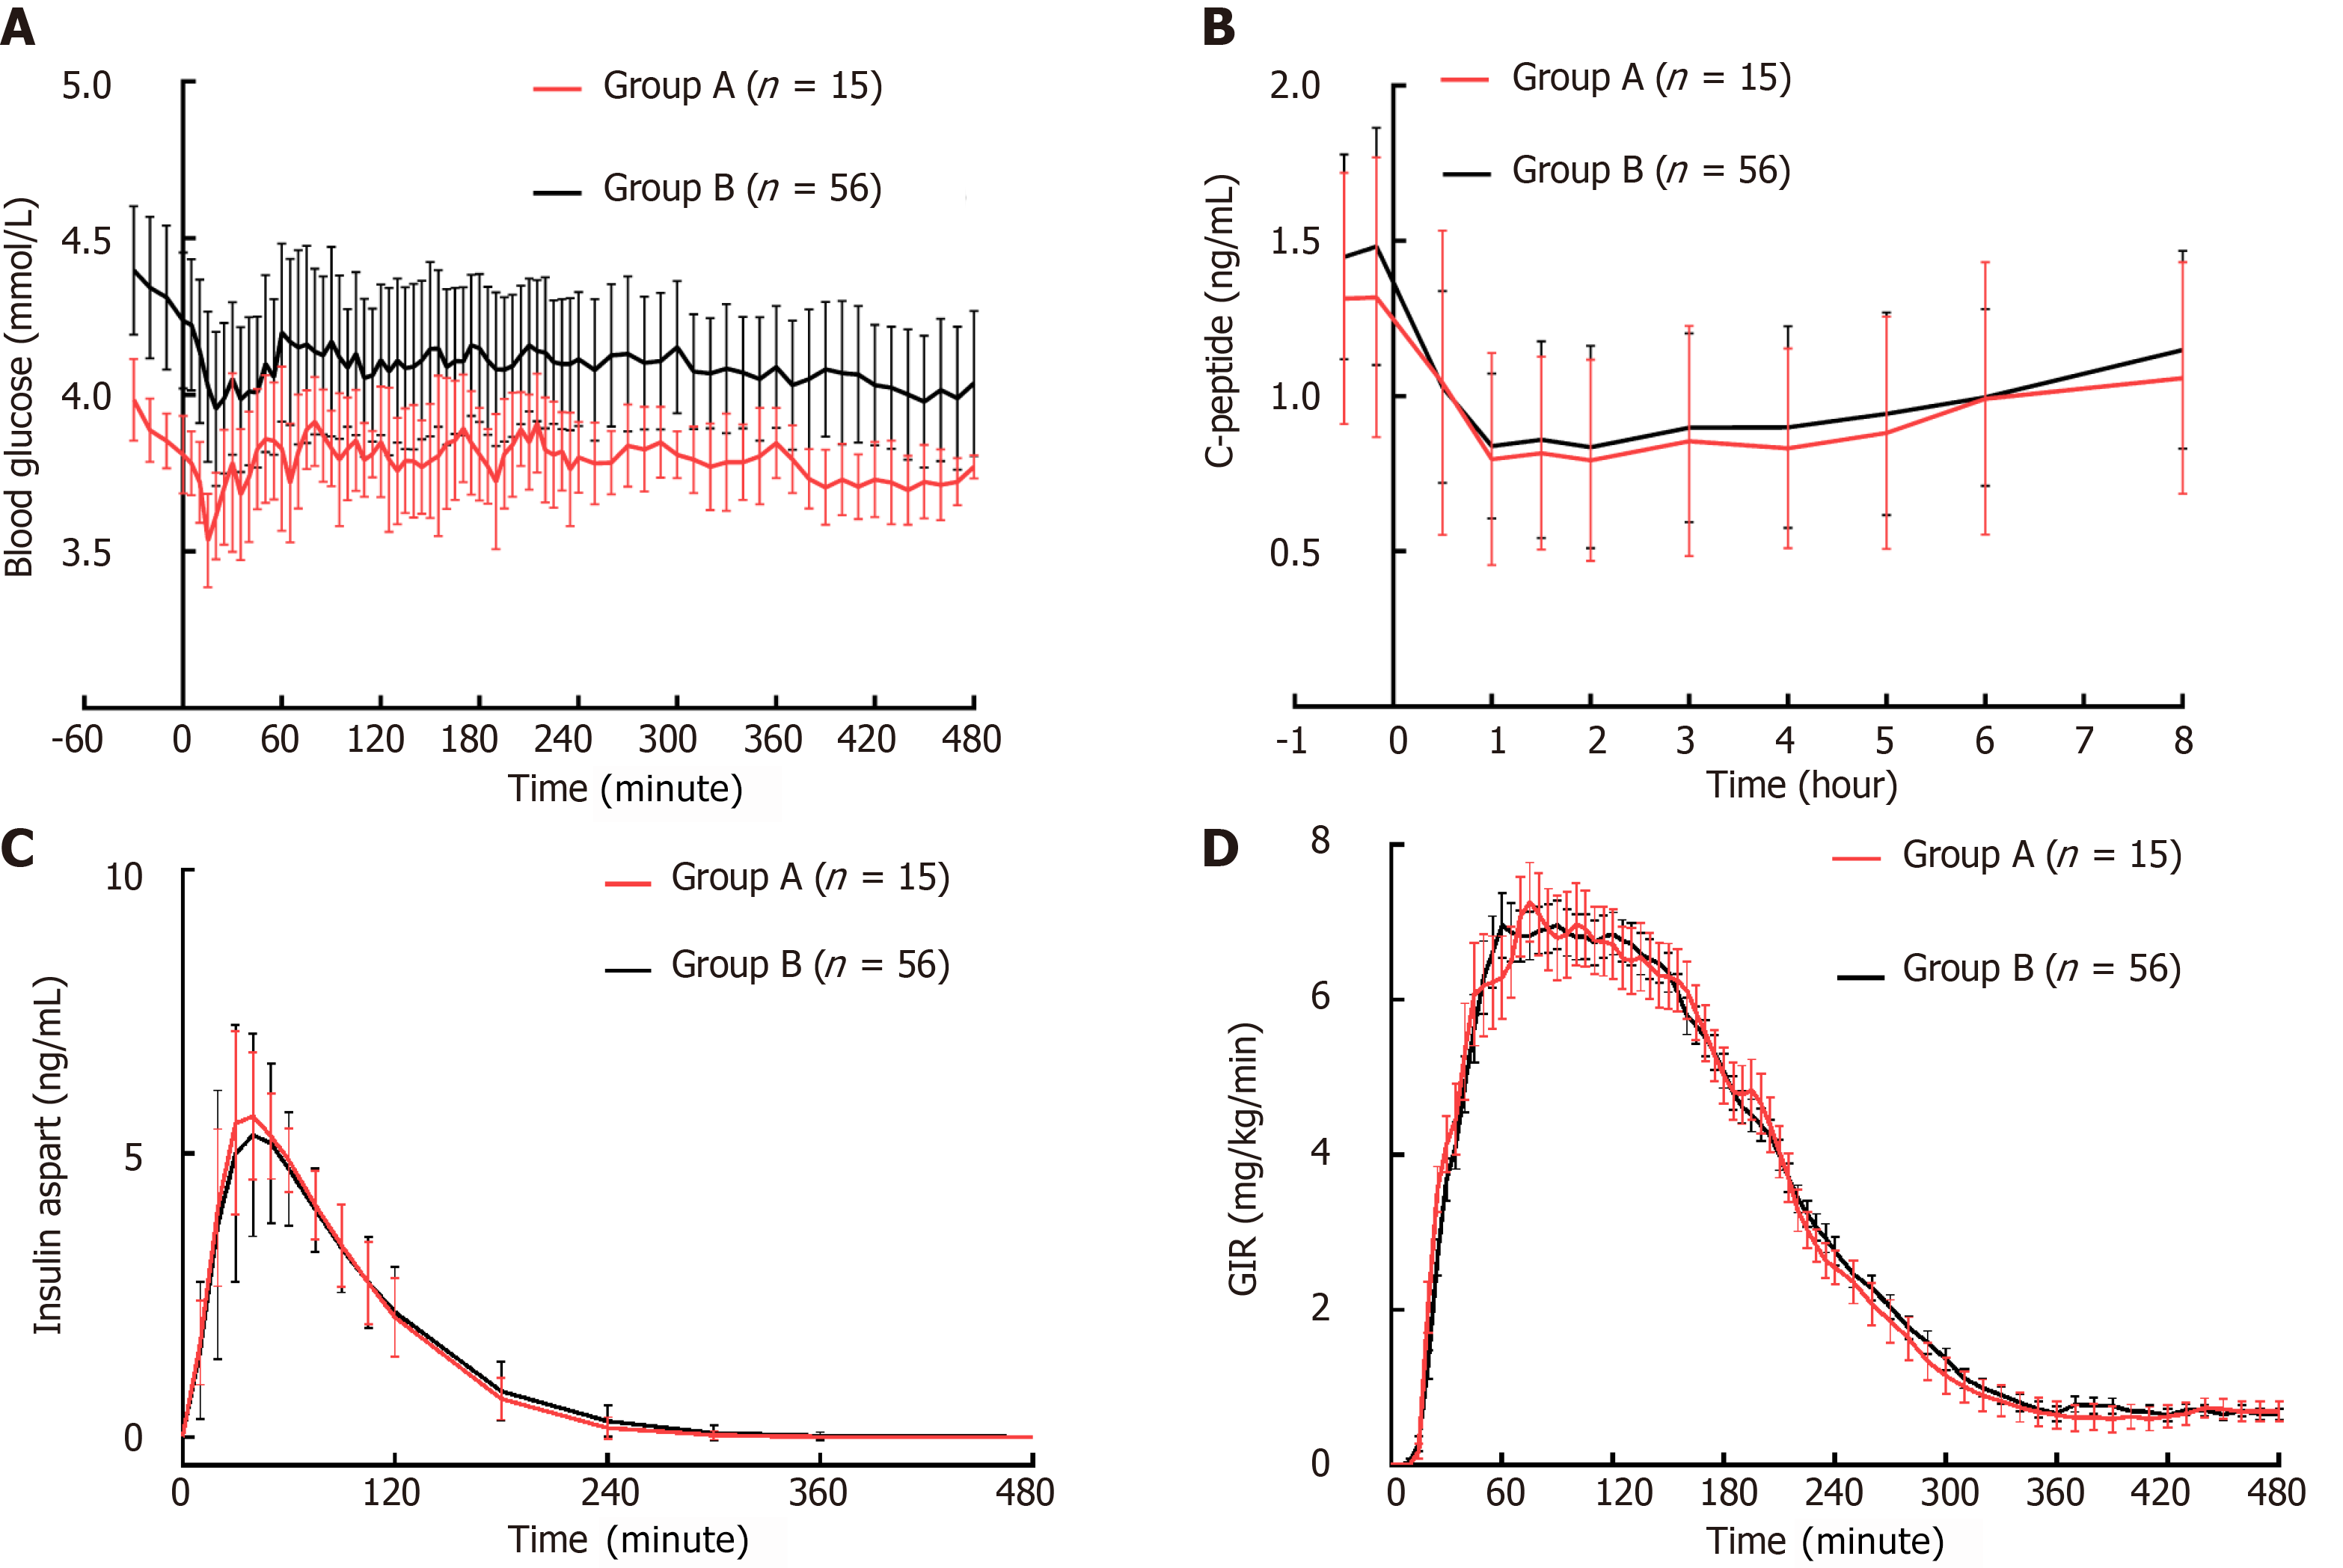
Figure 1 Time profiles of mean values.
A-D: Time profiles of mean values of blood glucose (A), C-peptide (B), insulin aspart concentrations (C), and glucose infusion rate (D) of groups A (n = 15) and groups B (n = 56) during the euglycemic clamp studies after matching for the basal C-peptide levels. The error bars represent the standard deviation.
- Citation: Liu H, Li T, Chen XL, Yu HL, Yu YR. Impact of setting distinct target blood glucose levels on endogenous insulin suppression and pharmacodynamics of insulin preparations. World J Diabetes 2025; 16(2): 101779
- URL: https://www.wjgnet.com/1948-9358/full/v16/i2/101779.htm
- DOI: https://dx.doi.org/10.4239/wjd.v16.i2.101779


