©The Author(s) 2025.
World J Diabetes. Nov 15, 2025; 16(11): 111008
Published online Nov 15, 2025. doi: 10.4239/wjd.v16.i11.111008
Published online Nov 15, 2025. doi: 10.4239/wjd.v16.i11.111008
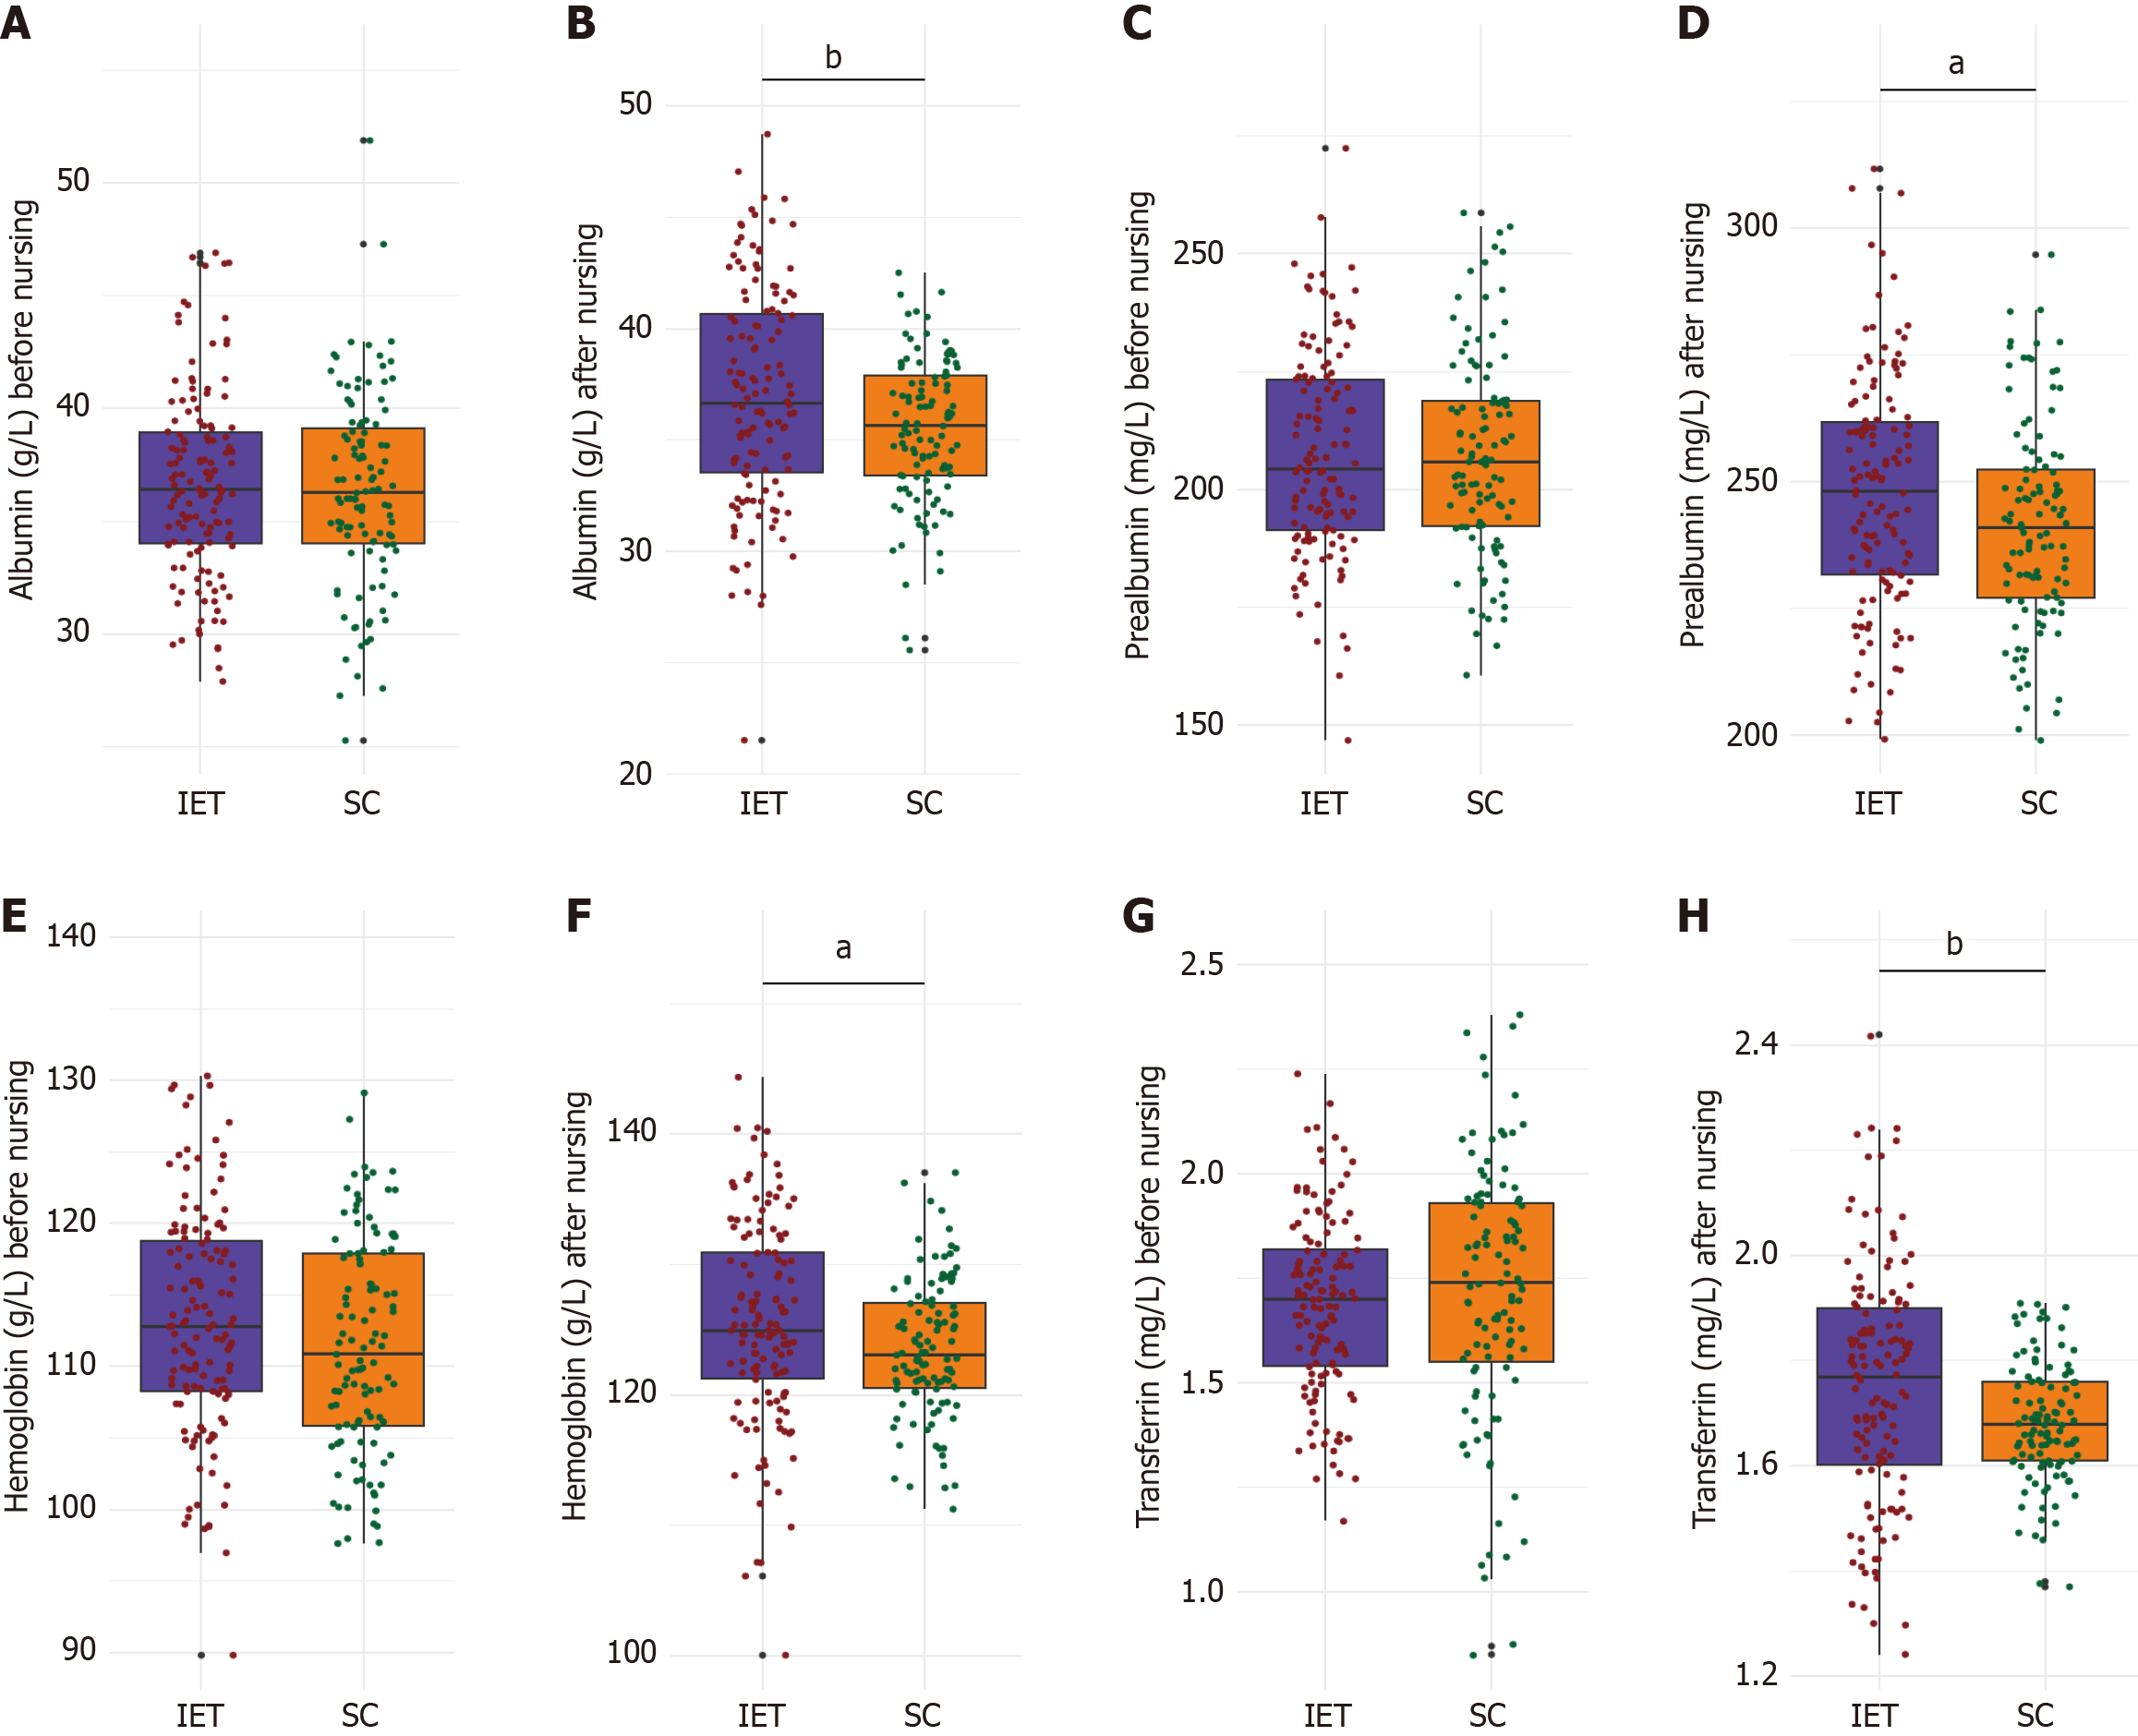
Figure 1 Comparison of nutritional indicators before and after nursing care between the two groups of patients.
A: Before-albumin (g/L); B: After-albumin (g/L); C: Before-prealbumin (mg/L); D: After-prealbumin (mg/L); E: Before-hemoglobin (g/L); F: After-hemoglobin (g/L); G: Before-transferrin (mg/L); H: After-transferrin (mg/L). IET: Individualized exercise training; SC: Standard care. aP < 0.05, and bP < 0.01.
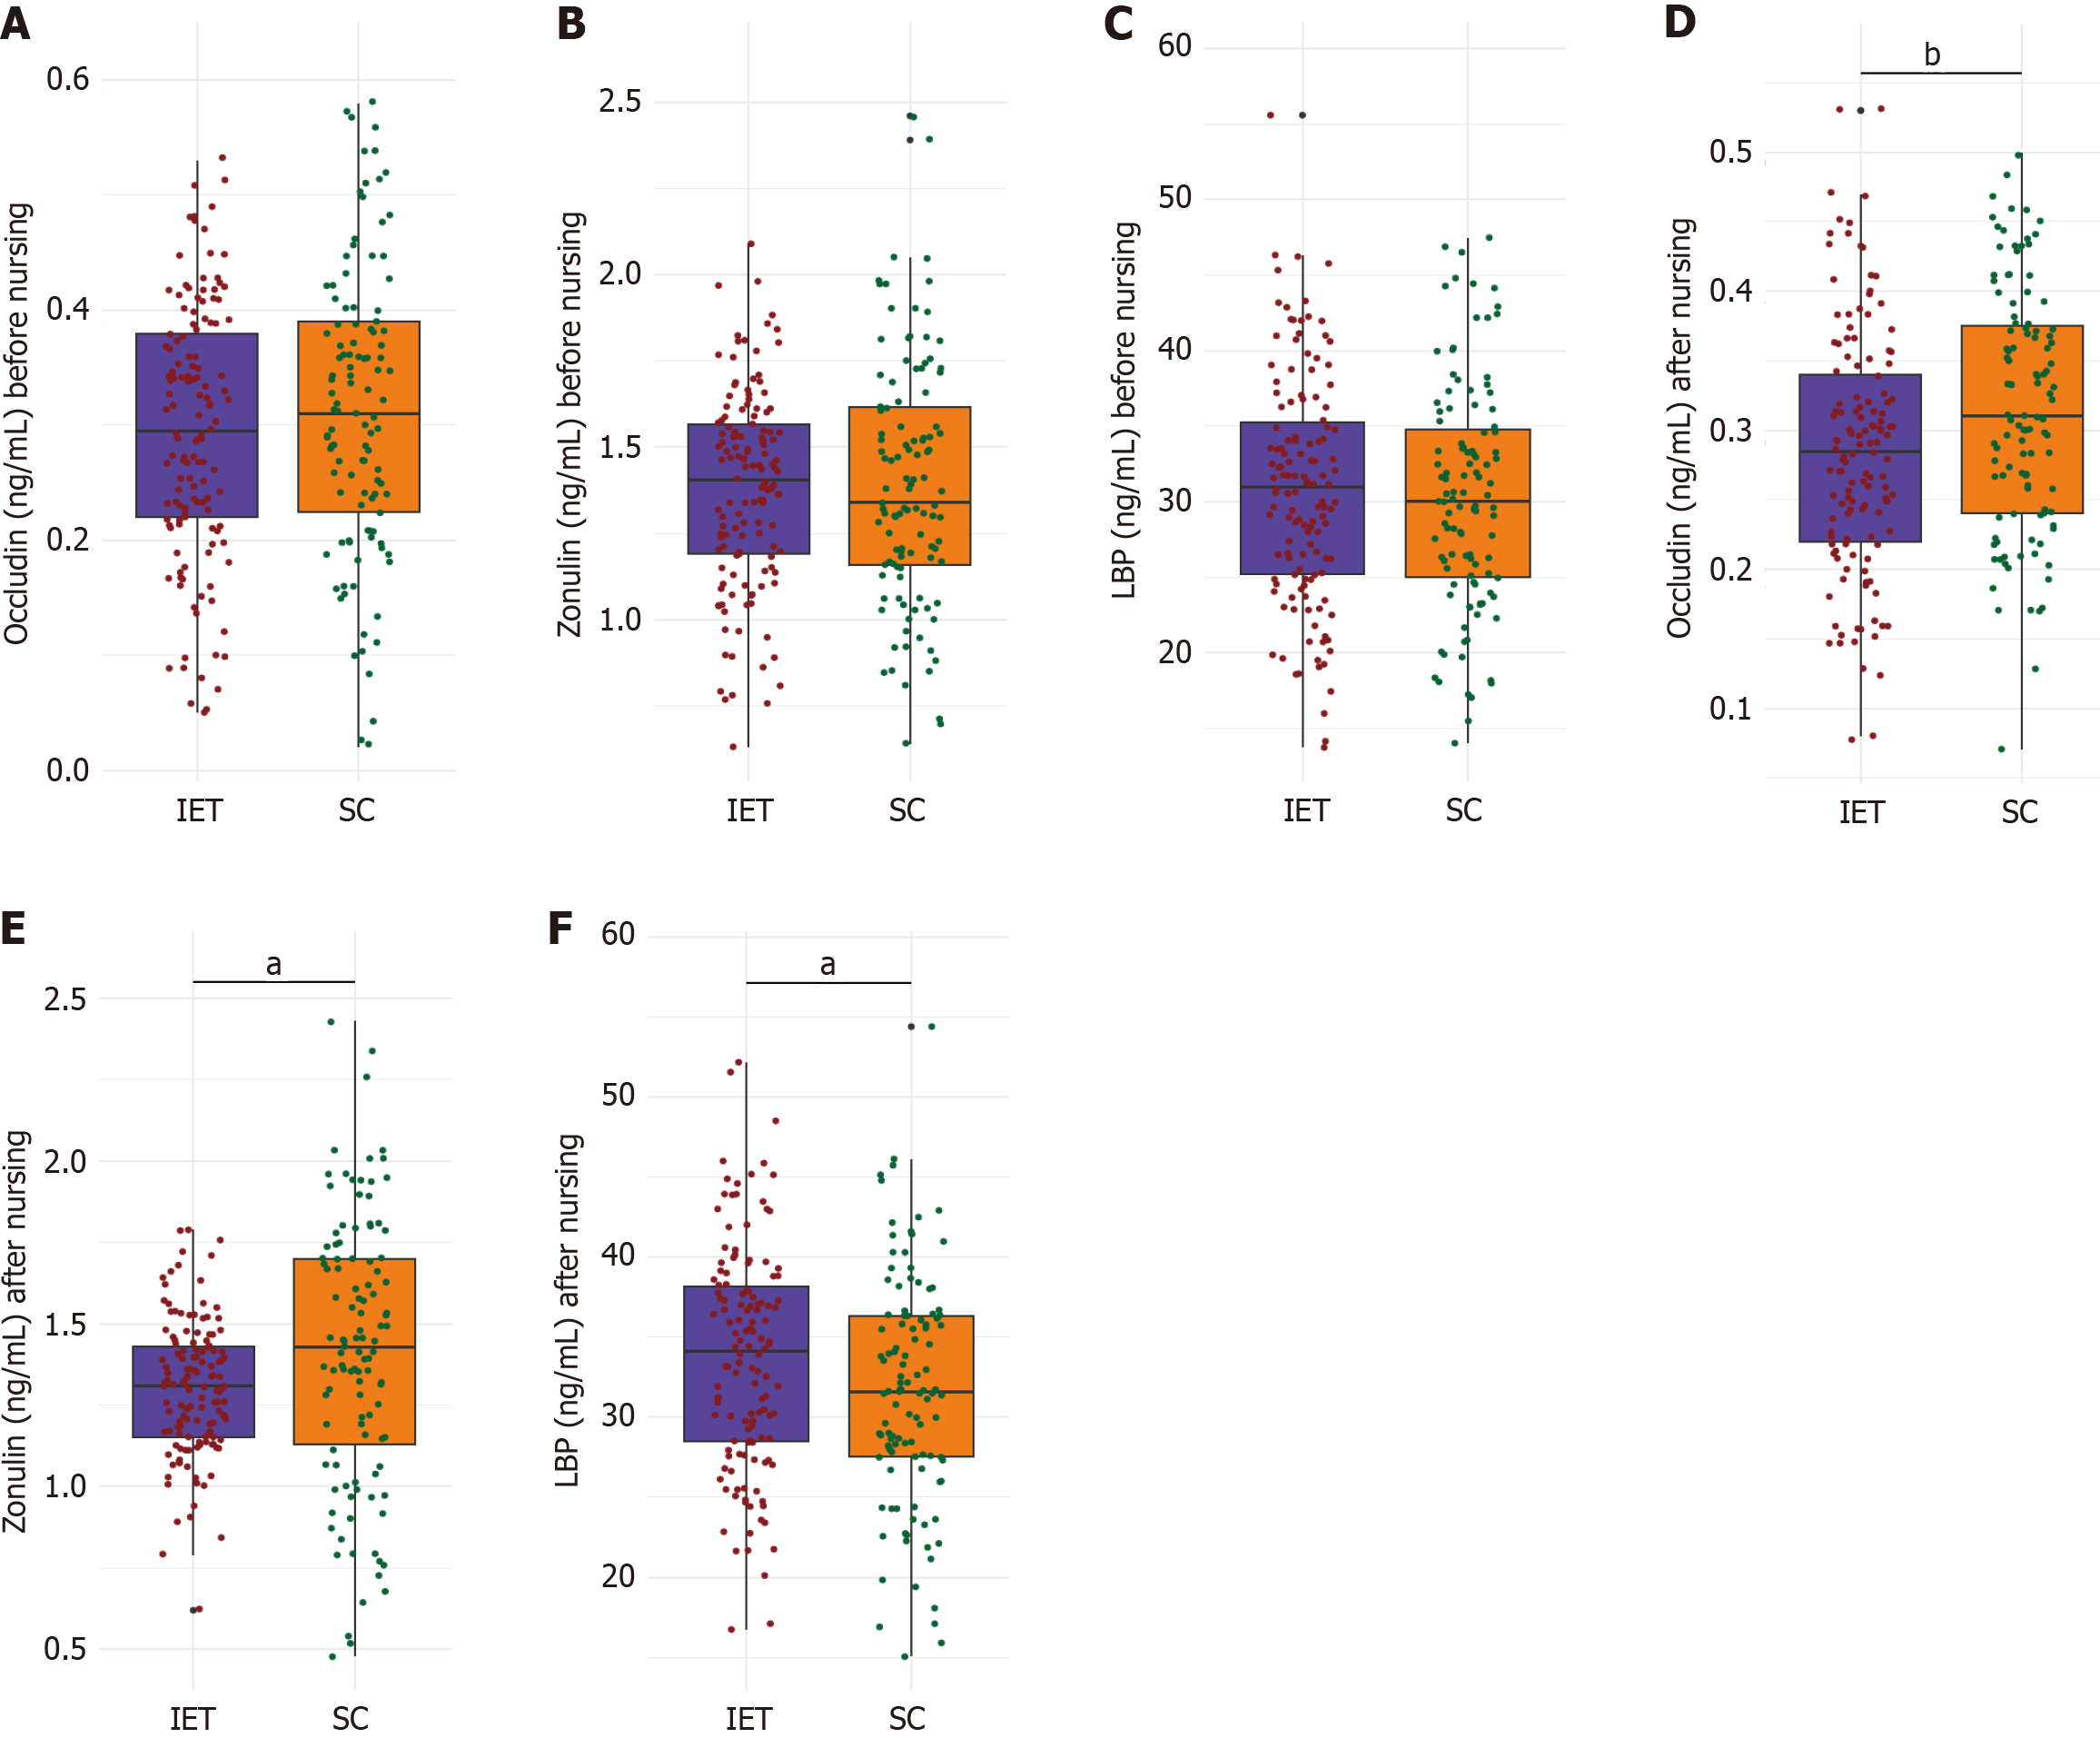
Figure 2 Comparison of intestinal permeability markers levels between two groups (before nursing).
A: Before-occludin (ng/mL); B: Before-zonulin (ng/mL); C: Before-lipopolysaccharide binding protein (ng/mL); D: After-occludin (ng/mL); E: After-zonulin (ng/mL); F: After-lipopolysaccharide binding protein (ng/mL). LBP: Lipopolysaccharide binding protein; IET: Individualized exercise training; SC: Standard care. aP < 0.05, and bP < 0.01.
- Citation: Yang L, Liu XP, Deng XM. Effects of tailored exercise on glycemic and nutritional outcomes in diabetic patients with colorectal cancer and on chemotherapy. World J Diabetes 2025; 16(11): 111008
- URL: https://www.wjgnet.com/1948-9358/full/v16/i11/111008.htm
- DOI: https://dx.doi.org/10.4239/wjd.v16.i11.111008


