©The Author(s) 2025.
World J Diabetes. Oct 15, 2025; 16(10): 109568
Published online Oct 15, 2025. doi: 10.4239/wjd.v16.i10.109568
Published online Oct 15, 2025. doi: 10.4239/wjd.v16.i10.109568
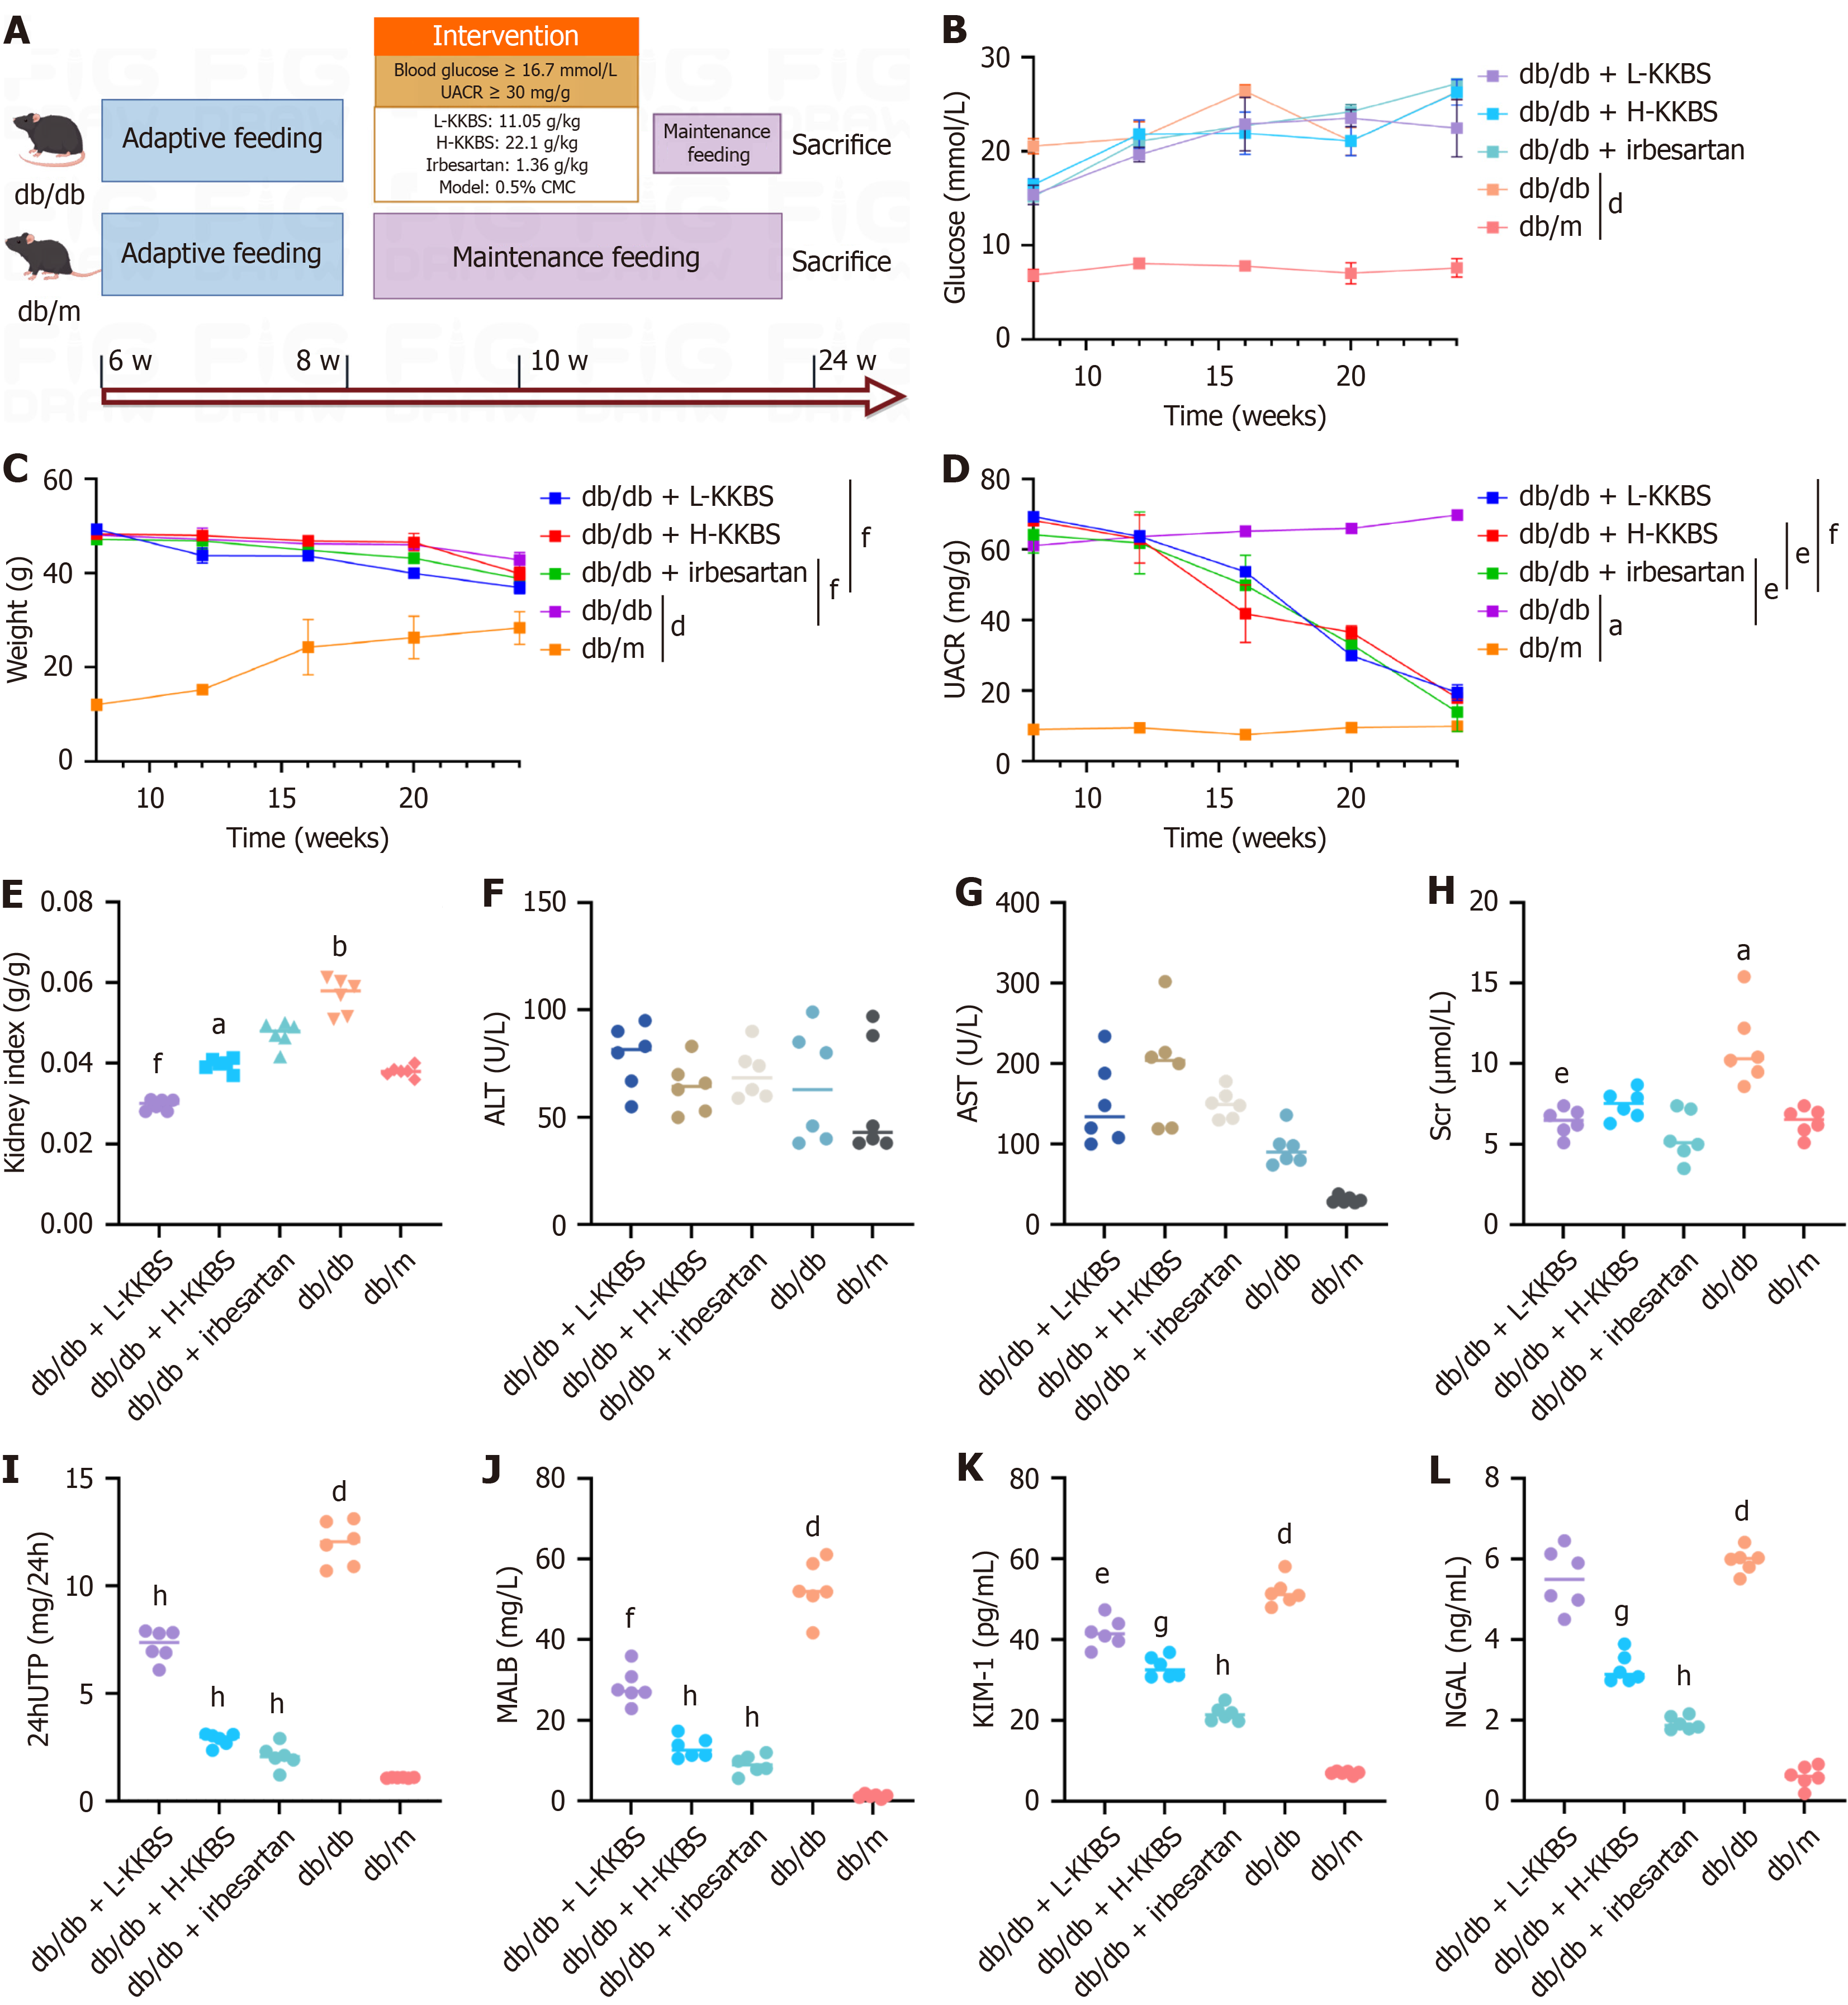
Figure 1 Kunkui Baoshen decoction improves renal function in db/db mice.
A: Experimental design and timeline showing db/db mouse model establishment and drug intervention schedule; B-D: Longitudinal monitoring of fasting blood glucose levels, body weight, and urinary albumin-to-creatinine ratio at 4-week intervals during the 12-week treatment period; E: Biochemical assessment after 12 weeks of treatment: Kidney index (kidney weight/body weight ratio); F and G: Liver function markers: Alanine aminotransferase and aspartate aminotransferase; H: Serum creatinine; I: 24-hour urinary total protein; J: Urinary malondialdehyde; K: Kidney injury molecule-1; L: Neutrophil gelatinase-associated lipocalin. UACR: Urinary albumin-to-creatinine ratio; L-KKBS: Low-dose Kunkui Baoshen decoction; H-KKBS: High-dose Kunkui Baoshen decoction; CMC: Carboxymethylcellulose; ALT: Alanine aminotransferase; AST: Aspartate aminotransferase; Scr: Serum creatinine; 24hUTP: 24-hour urinary total protein; MALB: Malondialdehyde; KIM-1: Kidney injury molecule-1; NGAL: Neutrophil gelatinase-associated lipocalin. aP < 0.05 vs db/m group, bP < 0.01 vs db/m group, dP < 0.0001 vs db/m group; eP < 0.05 vs db/db group, fP < 0.01 vs db/db group, gP < 0.001 vs db/db group, and hP < 0.0001 vs db/db group.
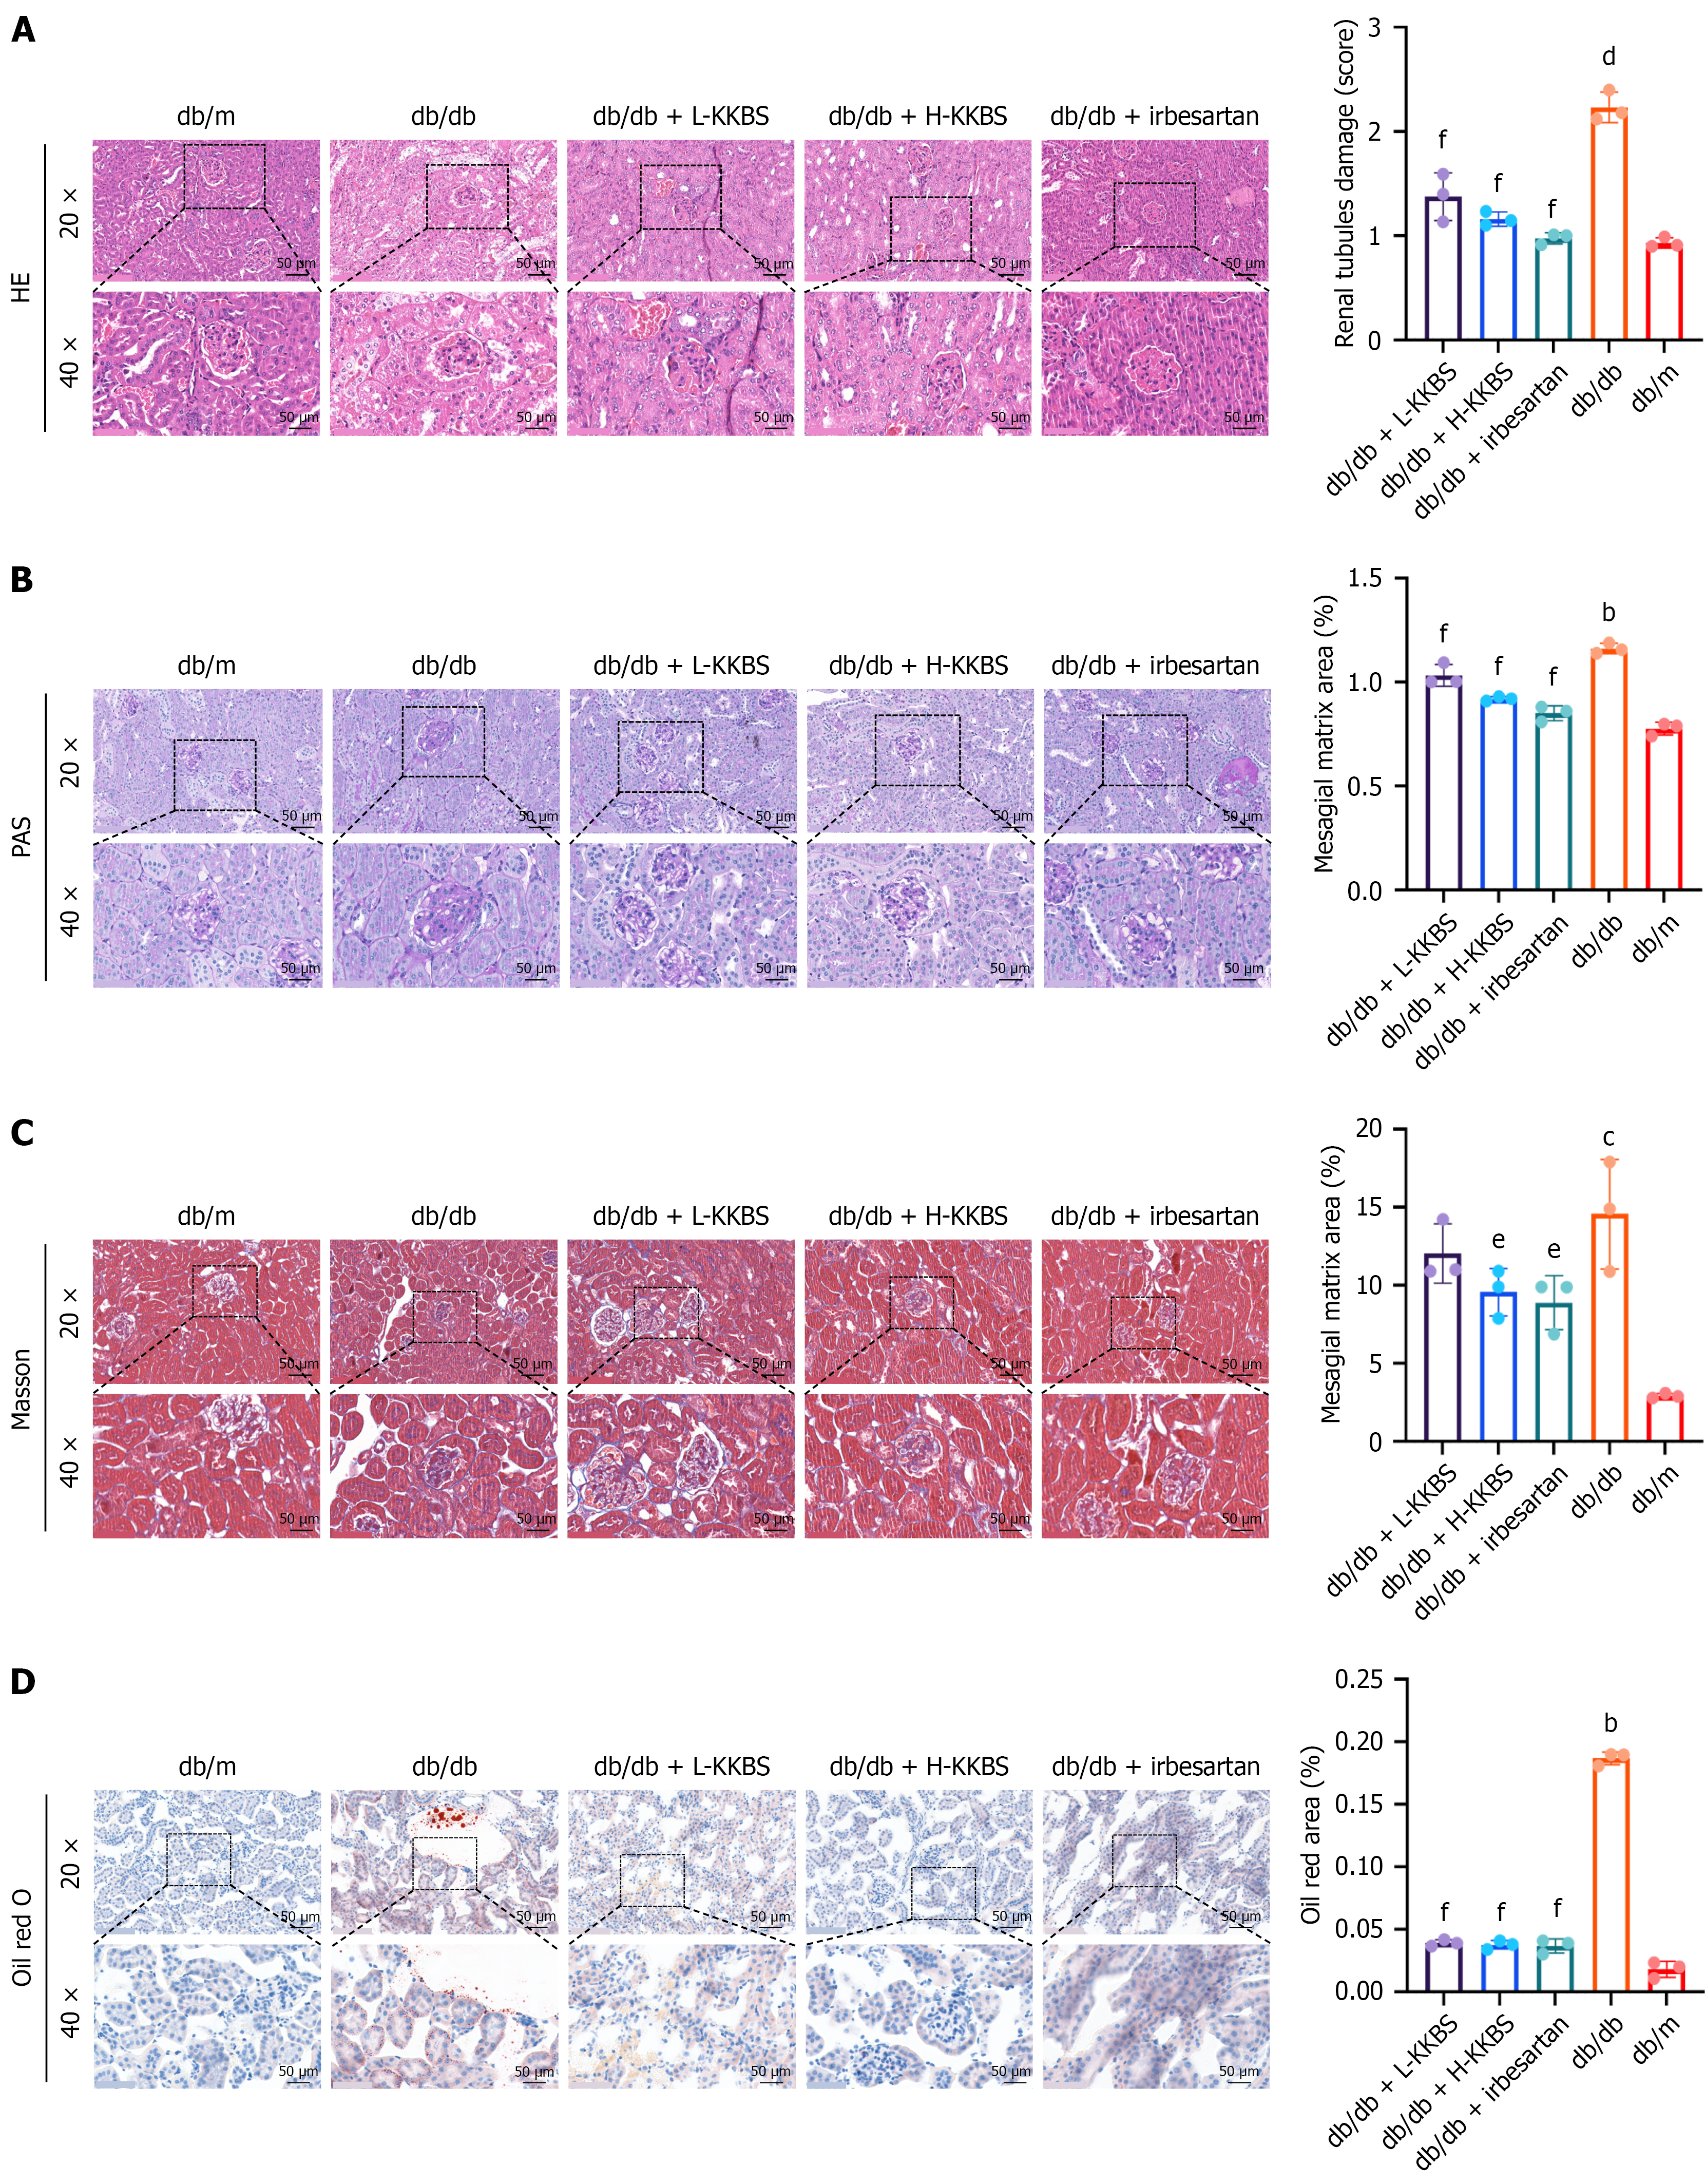
Figure 2 Kunkui Baoshen decoction alleviates renal tissue damage in db/db mice.
Histopathological evaluation of renal tissues using various staining techniques at magnifications of 20 × and 40 × (scale bars = 50 μm) and quantitative analyses across all groups. A: Hematoxylin and eosin staining to assess overall tissue architecture and renal tubular damage; B: Periodic acid-Schiff staining to evaluate glomerular basement membrane thickening and mesangial expansion; C: Masson’s trichrome staining to identify collagen deposition and renal fibrosis; D: Oil Red O staining to visualize lipid accumulation in kidney tissues. L-KKBS: Low-dose Kunkui Baoshen decoction; H-KKBS: High-dose Kunkui Baoshen decoction; HE: Hematoxylin and eosin; PAS: Periodic acid-Schiff. bP < 0.01 vs db/m group, cP < 0.001 vs db/m group, dP < 0.0001 vs db/m group; eP < 0.05 vs db/db group, and fP < 0.01 vs db/db group.
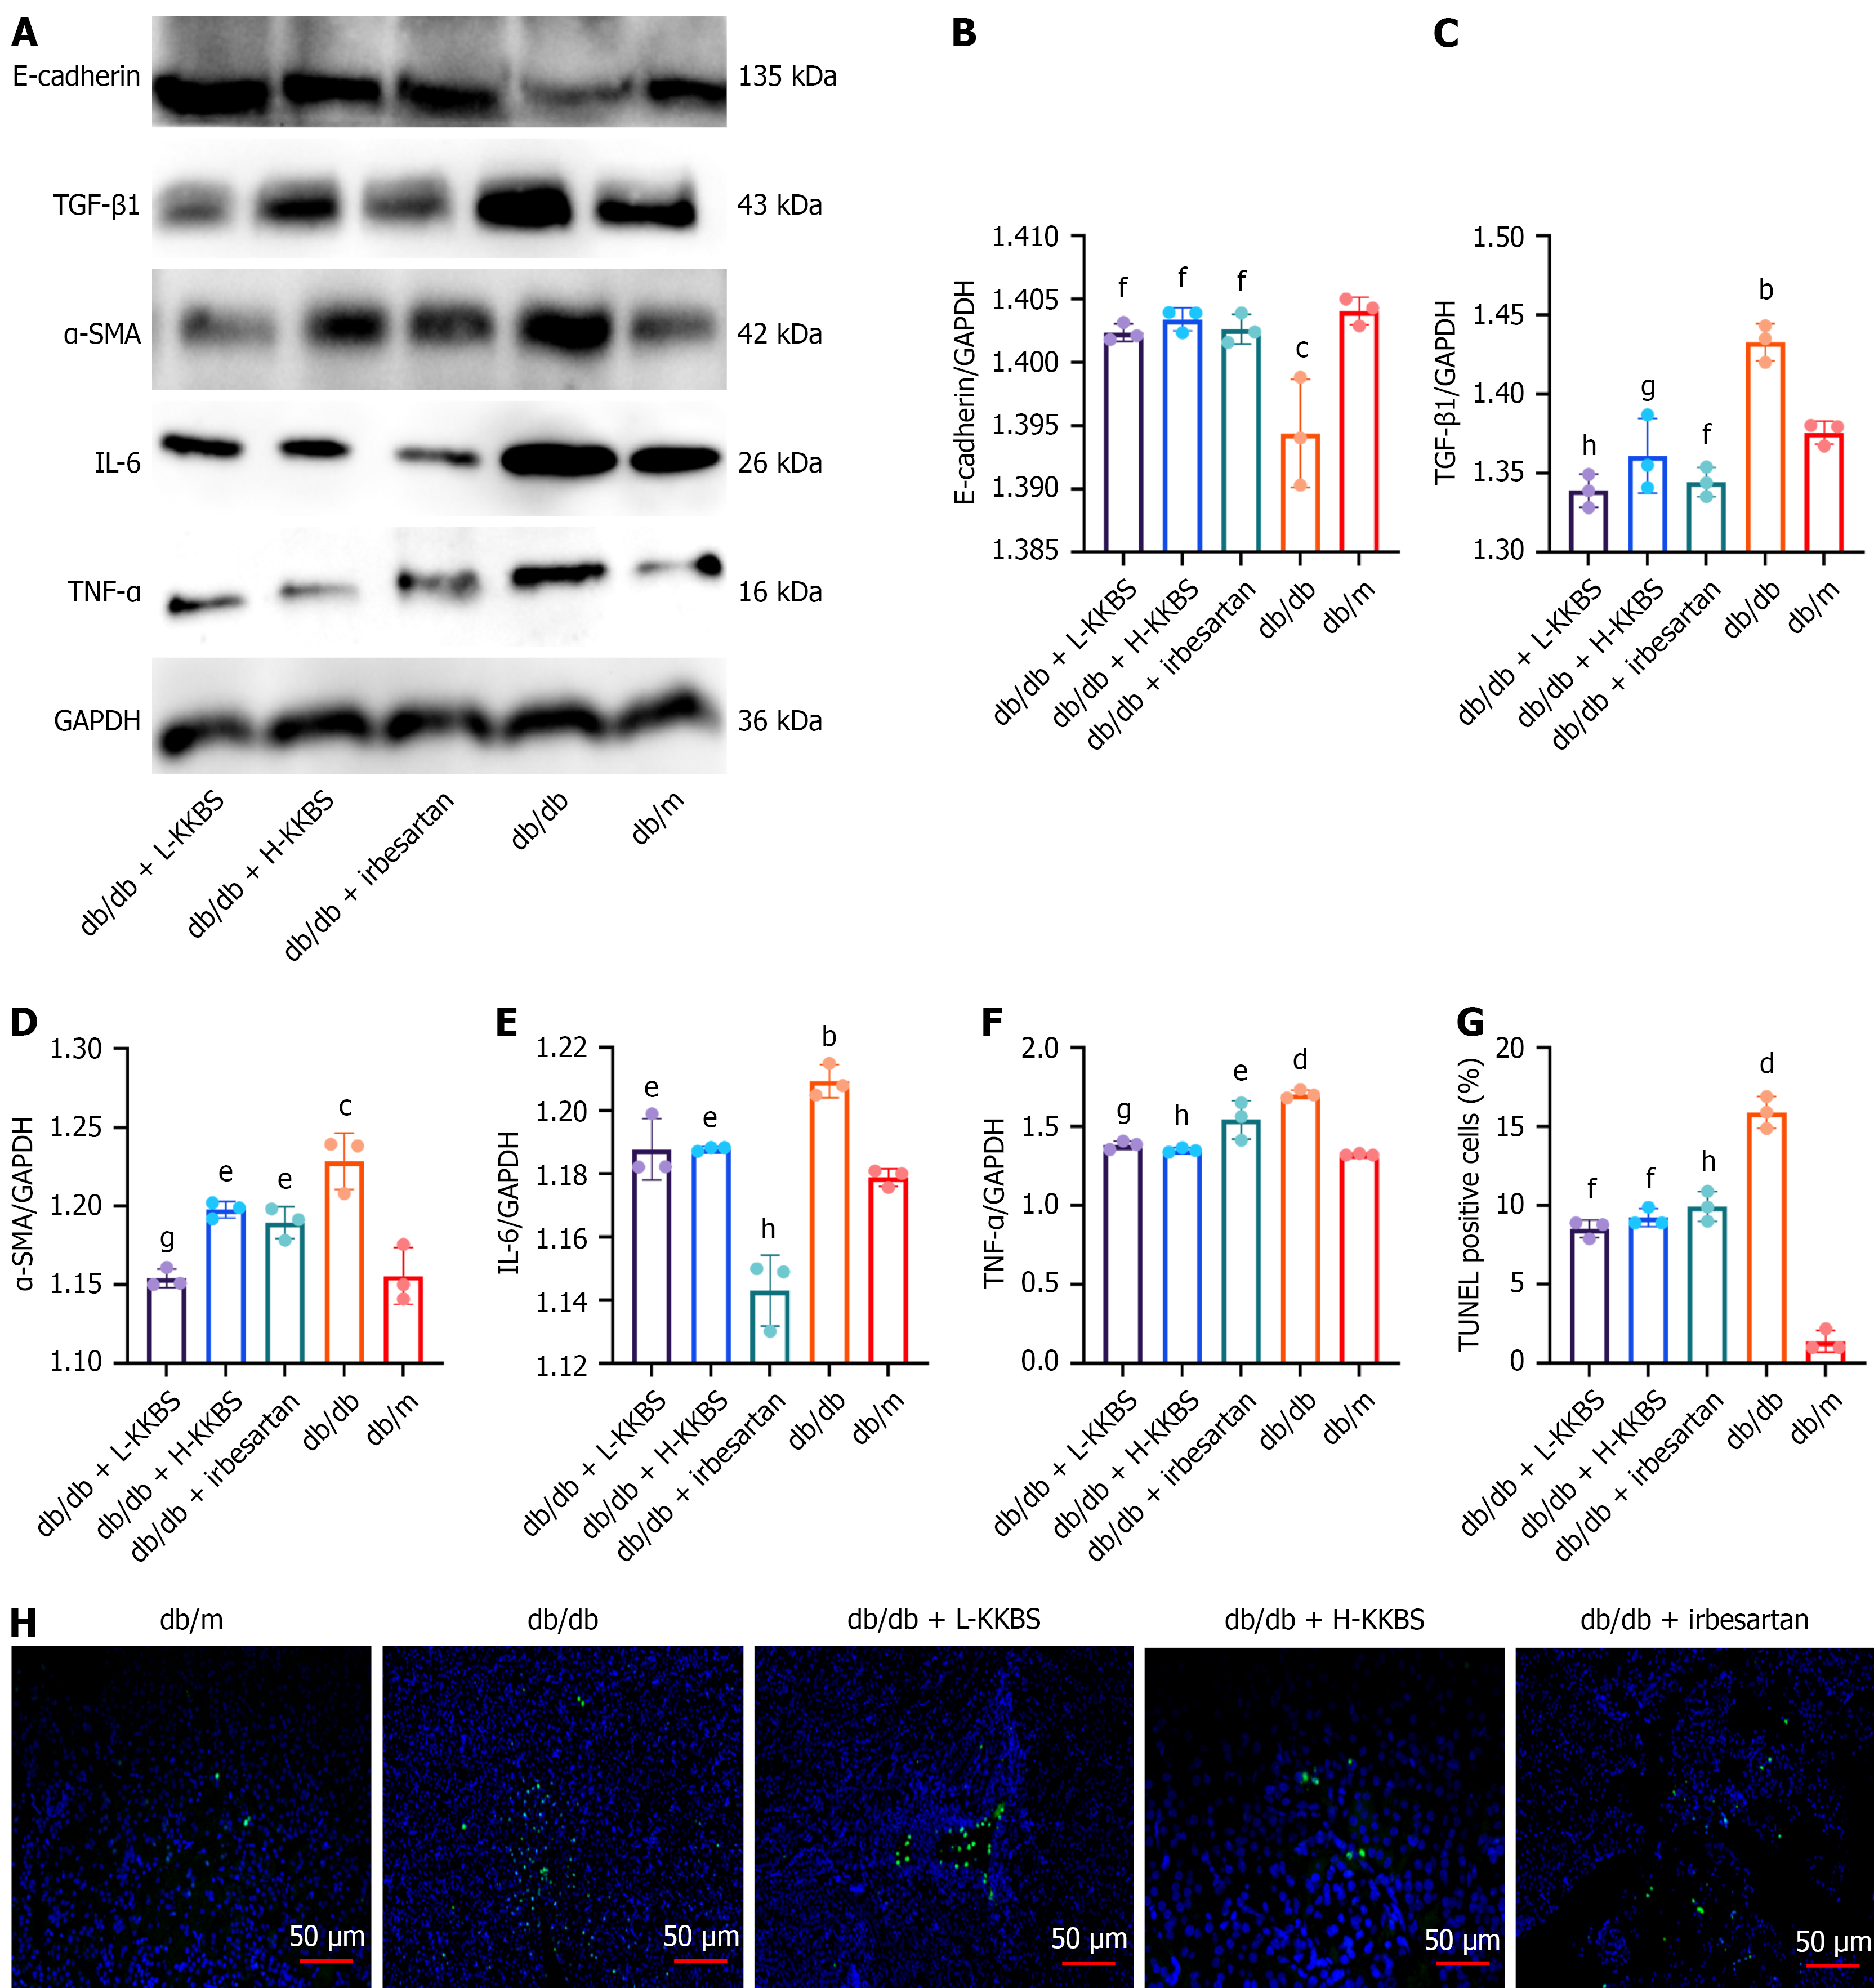
Figure 3 Kunkui Baoshen decoction alleviates inflammation, fibrosis, and cellular apoptosis in renal tissue of db/db mice.
A-G: Quantification of key inflammatory and fibrotic markers in renal tissues across five groups, including: Transforming growth factor-β1, interleukin-6, tumor necrosis factor-α, epithelial-cadherin, and α-smooth muscle actin; H: Assessment of renal tubular epithelial cell apoptosis using terminal deoxynucleotidyl transferase-mediated deoxyuridine triphosphate-nick end labelling staining. Representative images are shown for each group (scale bars = 50 μm). E-cadherin: Epithelial-cadherin; TGF-β1: Transforming growth factor-β1; α-SMA: α-smooth muscle actin; IL-6: Interleukin-6; TNF-α: Tumor necrosis factor-α; GAPDH: Glyceraldehyde 3-phosphate dehydrogenase; L-KKBS: Low-dose Kunkui Baoshen decoction; H-KKBS: High-dose Kunkui Baoshen decoction; TUNEL: Terminal deoxynucleotidyl transferase-mediated deoxyuridine triphosphate-nick end labelling. bP < 0.01 vs db/m group, cP < 0.001 vs db/m group, dP < 0.0001 vs db/m group; eP < 0.05 vs db/db group, fP < 0.01 vs db/db group, gP < 0.001 vs db/db group, and hP < 0.0001 vs db/db group.
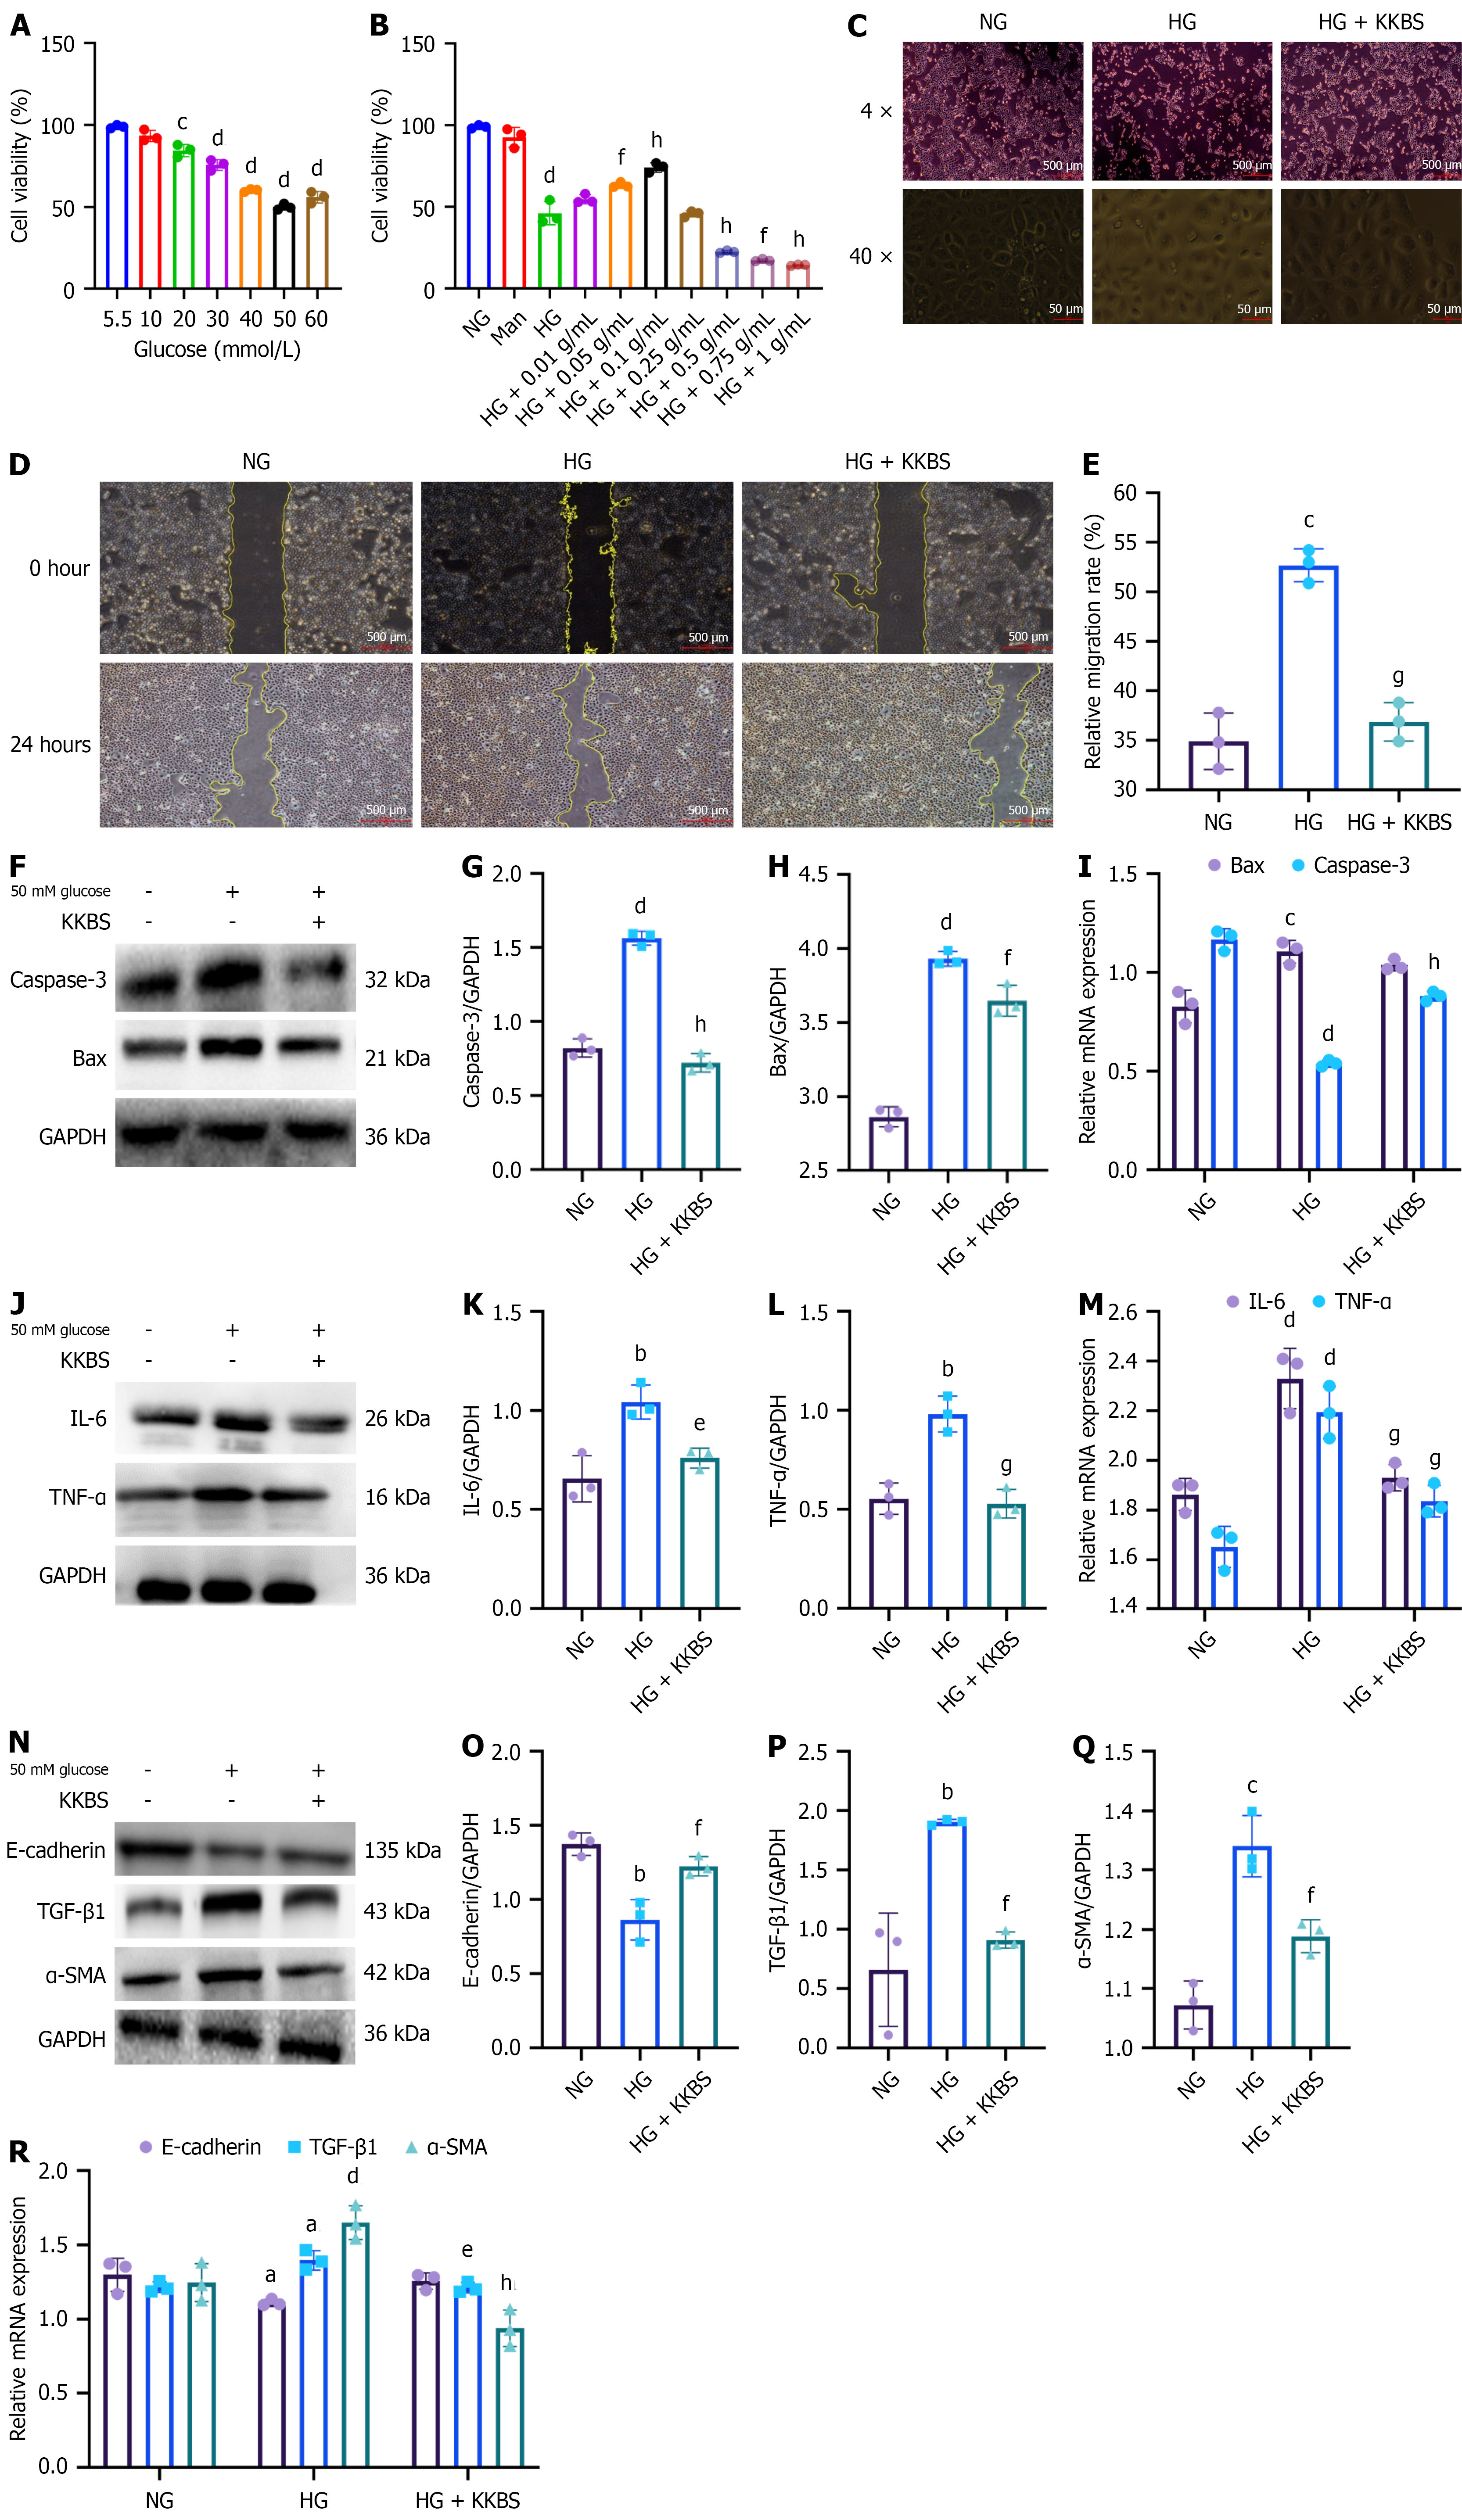
Figure 4 Kunkui Baoshen decoction alleviates inflammation, fibrosis, and cellular apoptosis in high glucose-induced human kidney-2 cells.
A: Human kidney-2 (HK-2) cell viability under different glucose concentrations compared to the normal group (NG, 5.5 mmol/L glucose); B: HK-2 cell viability under high glucose (HG, 50 mmol/L glucose) with varying concentrations of Kunkui Baoshen decoction; C: Morphological changes of HK-2 cells observed at 4 × and 40 × magnification (scale bar = 500 μm); D: Wound healing assay to evaluate HK-2 cell migration under different treatments (scale bar = 500 μm); E: Quantification of migration rate; F-I: Western blot and quantitative reverse transcription-polymerase chain reaction (qRT-PCR) analyses of cysteine-aspartic acid protease-3 and Bcl-2 associated X protein in HK-2 cells; J-M: Western blot and qRT-PCR analyses of interleukin-6 and tumor necrosis factor-α in HK-2 cells; N-R: Western blot and qRT-PCR analyses of epithelial-cadherin, α-smooth muscle actin, and transforming growth factor-β1 in HK-2 cells. NG: Normal group; Man: Mannitol (osmotic control); HG: High glucose; KKBS: Kunkui Baoshen decoction; Caspase-3: Cysteine-aspartic acid protease-3; Bax: Bcl-2 associated X; GAPDH: Glyceraldehyde 3-phosphate dehydrogenase; IL-6: Interleukin-6; TNF-α: Tumor necrosis factor-α; E-cadherin: Epithelial-cadherin; TGF-β1: Transforming growth factor-β1; α-SMA: α-smooth muscle actin. aP < 0.05 vs normal group, bP < 0.01 vs normal group, cP < 0.001 vs normal group, dP < 0.0001 vs normal group; eP < 0.05 vs high glucose group, fP < 0.01 vs high glucose group, gP < 0.001 vs high glucose group, hP < 0.0001 vs high glucose group.
Figure 5 Component identification of Kunkui Baoshen decoction and metabolomics analysis.
A: Total ion chromatogram of Kunkui Baoshen decoction (KKBS) obtained via liquid chromatography-mass spectrometry/mass spectrometry, showing the compound distribution profile; B: Representative chemical structures of key quality control components identified in KKBS; C: Sample correlation heatmap. Each cell represents the correlation coefficient between two samples. Color intensity indicates the strength of correlation, and hierarchical clustering (dendrograms on the top and side) reflects similarity—samples on the same branch are more similar to each other; D: Principal component analysis plot: Dimensionality reduction was performed to project samples onto principal components 1 and 2. The relative positions of points reflect similarity, and closer points indicate more similar metabolic profiles. Analysis of similarities was used to assess between-group differences. The R value (range: -1 to 1) indicates effect size, with values closer to 1 suggesting strong inter-group separation; the P value tests for significance; E: Partial least squares discriminant analysis score plot demonstrating group separation based on metabolite profiles. Component 1 and component 2 represent the major explanatory variables; F: Partial least squares discriminant analysis permutation test to evaluate the model’s statistical reliability. The X-axis shows model accuracy, and the Y-axis shows the number of random permutations. Red bars = Q2 values; blue bars = R2Y values. P value = (number of permutations outperforming the original model)/(total permutations). A P < 0.05 indicates model validity; G: Kyoto Encyclopedia of Genes and Genomes (KEGG) pathway enrichment analysis. Bar graph showing the number of KKBS-related metabolites mapped to different KEGG pathways. The Y-axis shows KEGG subcategories, and the X-axis shows the number of mapped compounds. Pathways are grouped into seven categories: Metabolism, genetic information processing, environmental information processing, cellular processes, organismal systems, human diseases, and drug development, with distinct colors representing each category. TIC: Total ion chromatogram; PLS-DA: Partial least squares discriminant analysis; PCA: Principal component analysis; TFA: Total fatty acids; PC1: Component 1; PC2: Component 2; KKBS: Kunkui Baoshen decoction; KEGG: Kyoto Encyclopedia of Genes and Genomes.
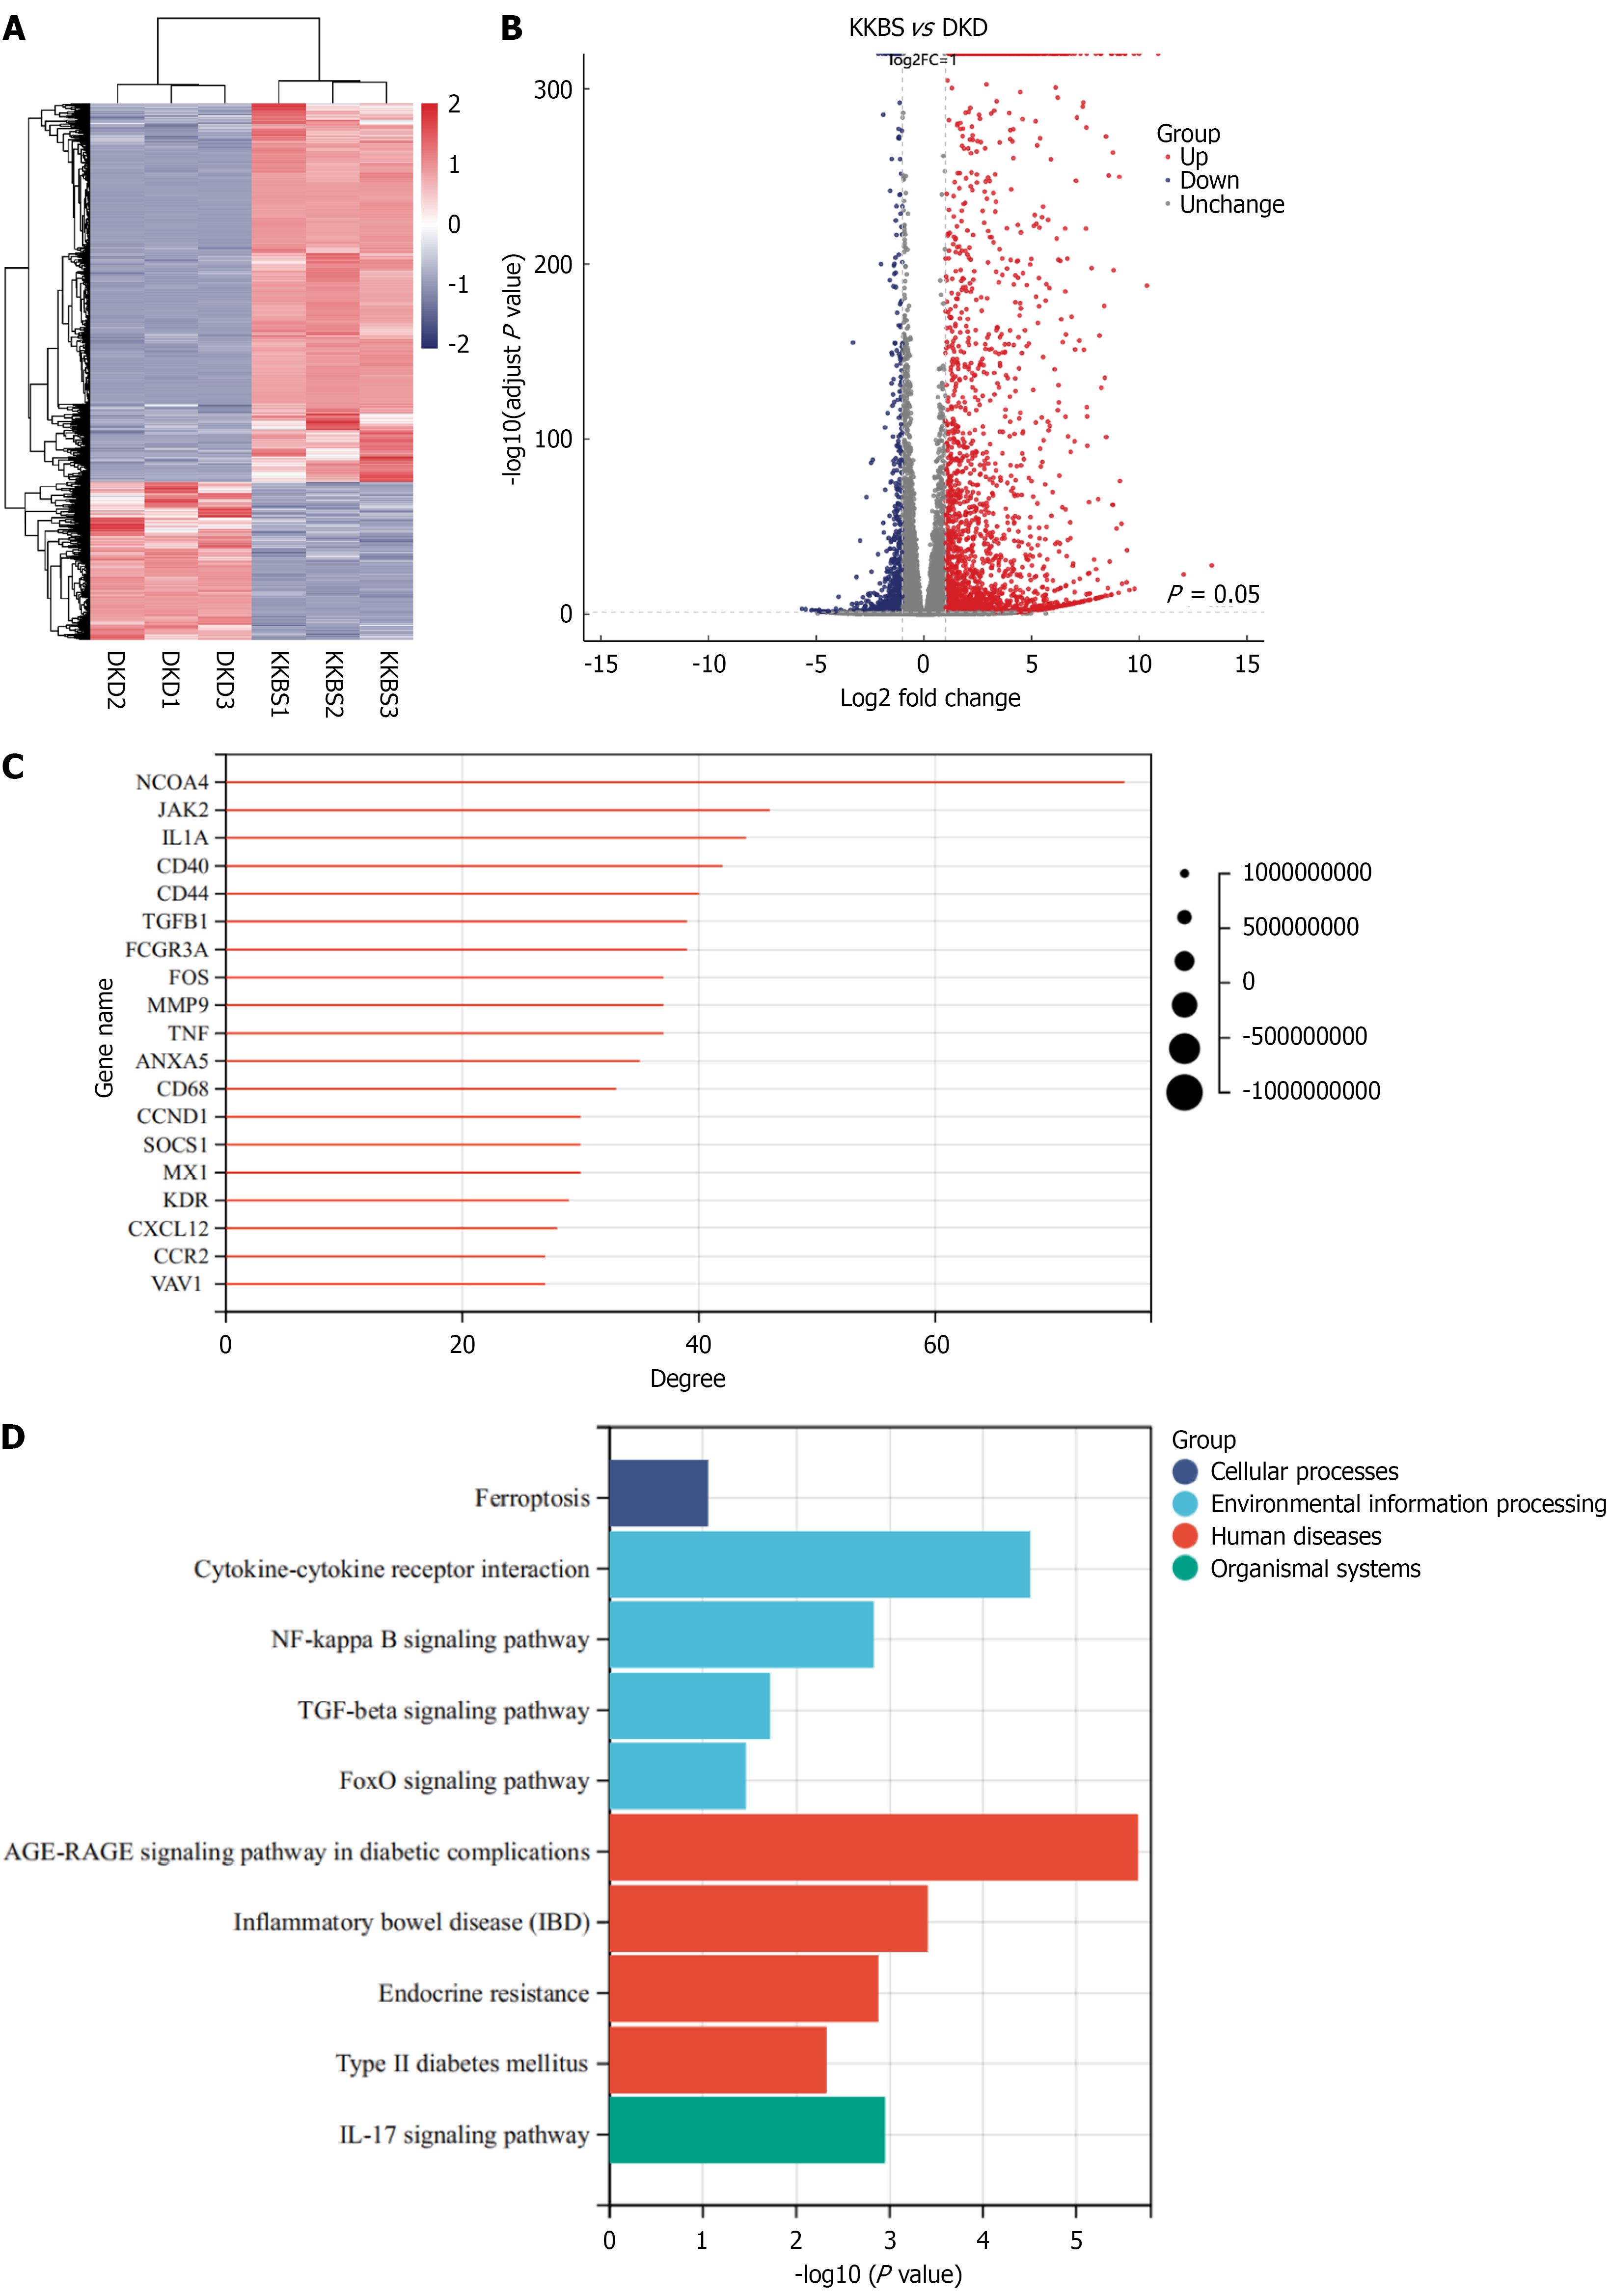
Figure 6 Transcriptomic analysis of renal tissues following Kunkui Baoshen decoction treatment.
A: Hierarchical clustering heatmap of diffe
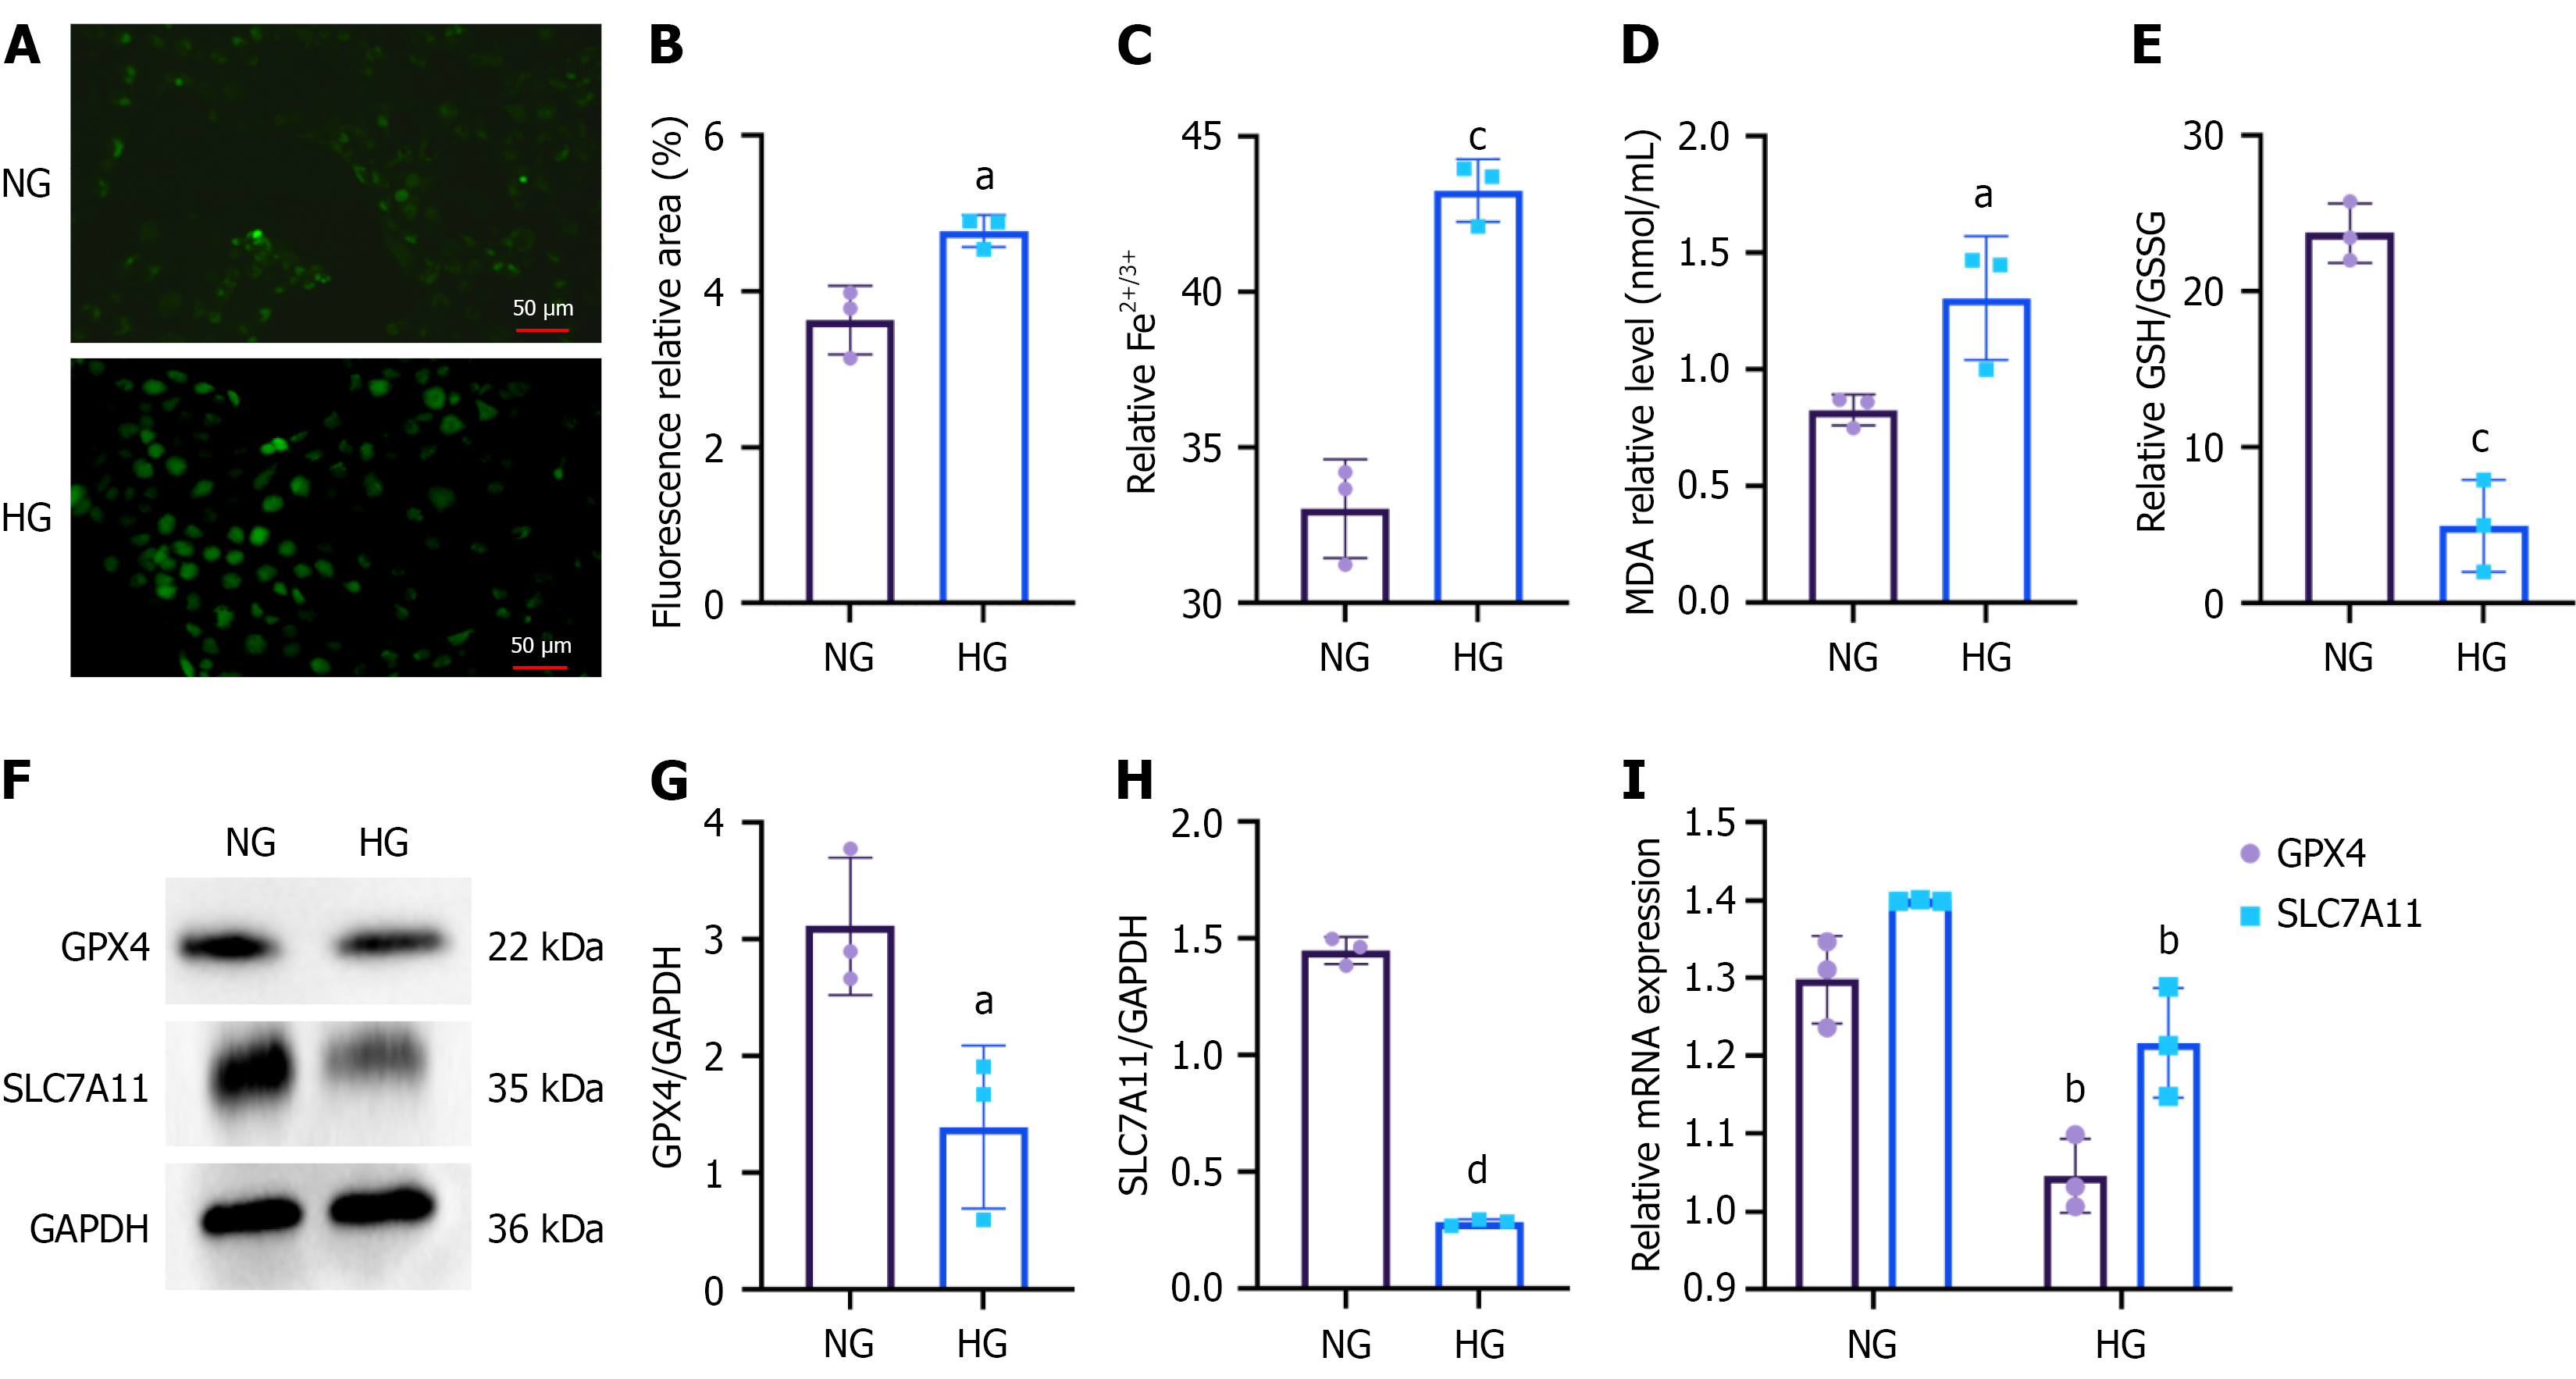
Figure 7 Ferroptosis in human kidney-2 cells under high-glucose conditions.
A: Intracellular reactive oxygen species levels in the normal (NG) and high glucose (HG) groups were visualized using fluorescence microscopy (scale bars = 50 μm); B: Quantification of reactive oxygen species fluorescence intensity (expressed as relative fluorescent area%) in the NG and HG groups; C: Intracellular iron (Fe2+/Fe3+) levels in the NG and HG groups; D: Malondialdehyde levels in the NG and HG groups; E: Glutathione to oxidized glutathione ratio in the NG and HG groups; F-I: Expression levels of ferroptosis-related markers glutathione peroxidase 4 and recombinant solute carrier family 7 member 11 were analyzed by Western blot and quantitative reverse transcription-polymerase chain reaction in the NG and HG groups. NG: Normal group; HG: High glucose; MDA: Malondialdehyde; GSH: Glutathione; GSSG: Oxidized glutathione; GPX4: Glutathione peroxidase 4; SLC7A11: Solute carrier family 7 member 11; GAPDH: Glyceraldehyde 3-phosphate dehydrogenase. aP < 0.05 vs normal group, bP < 0.01 vs normal group, cP < 0.001 vs normal group, and dP < 0.0001 vs normal group.
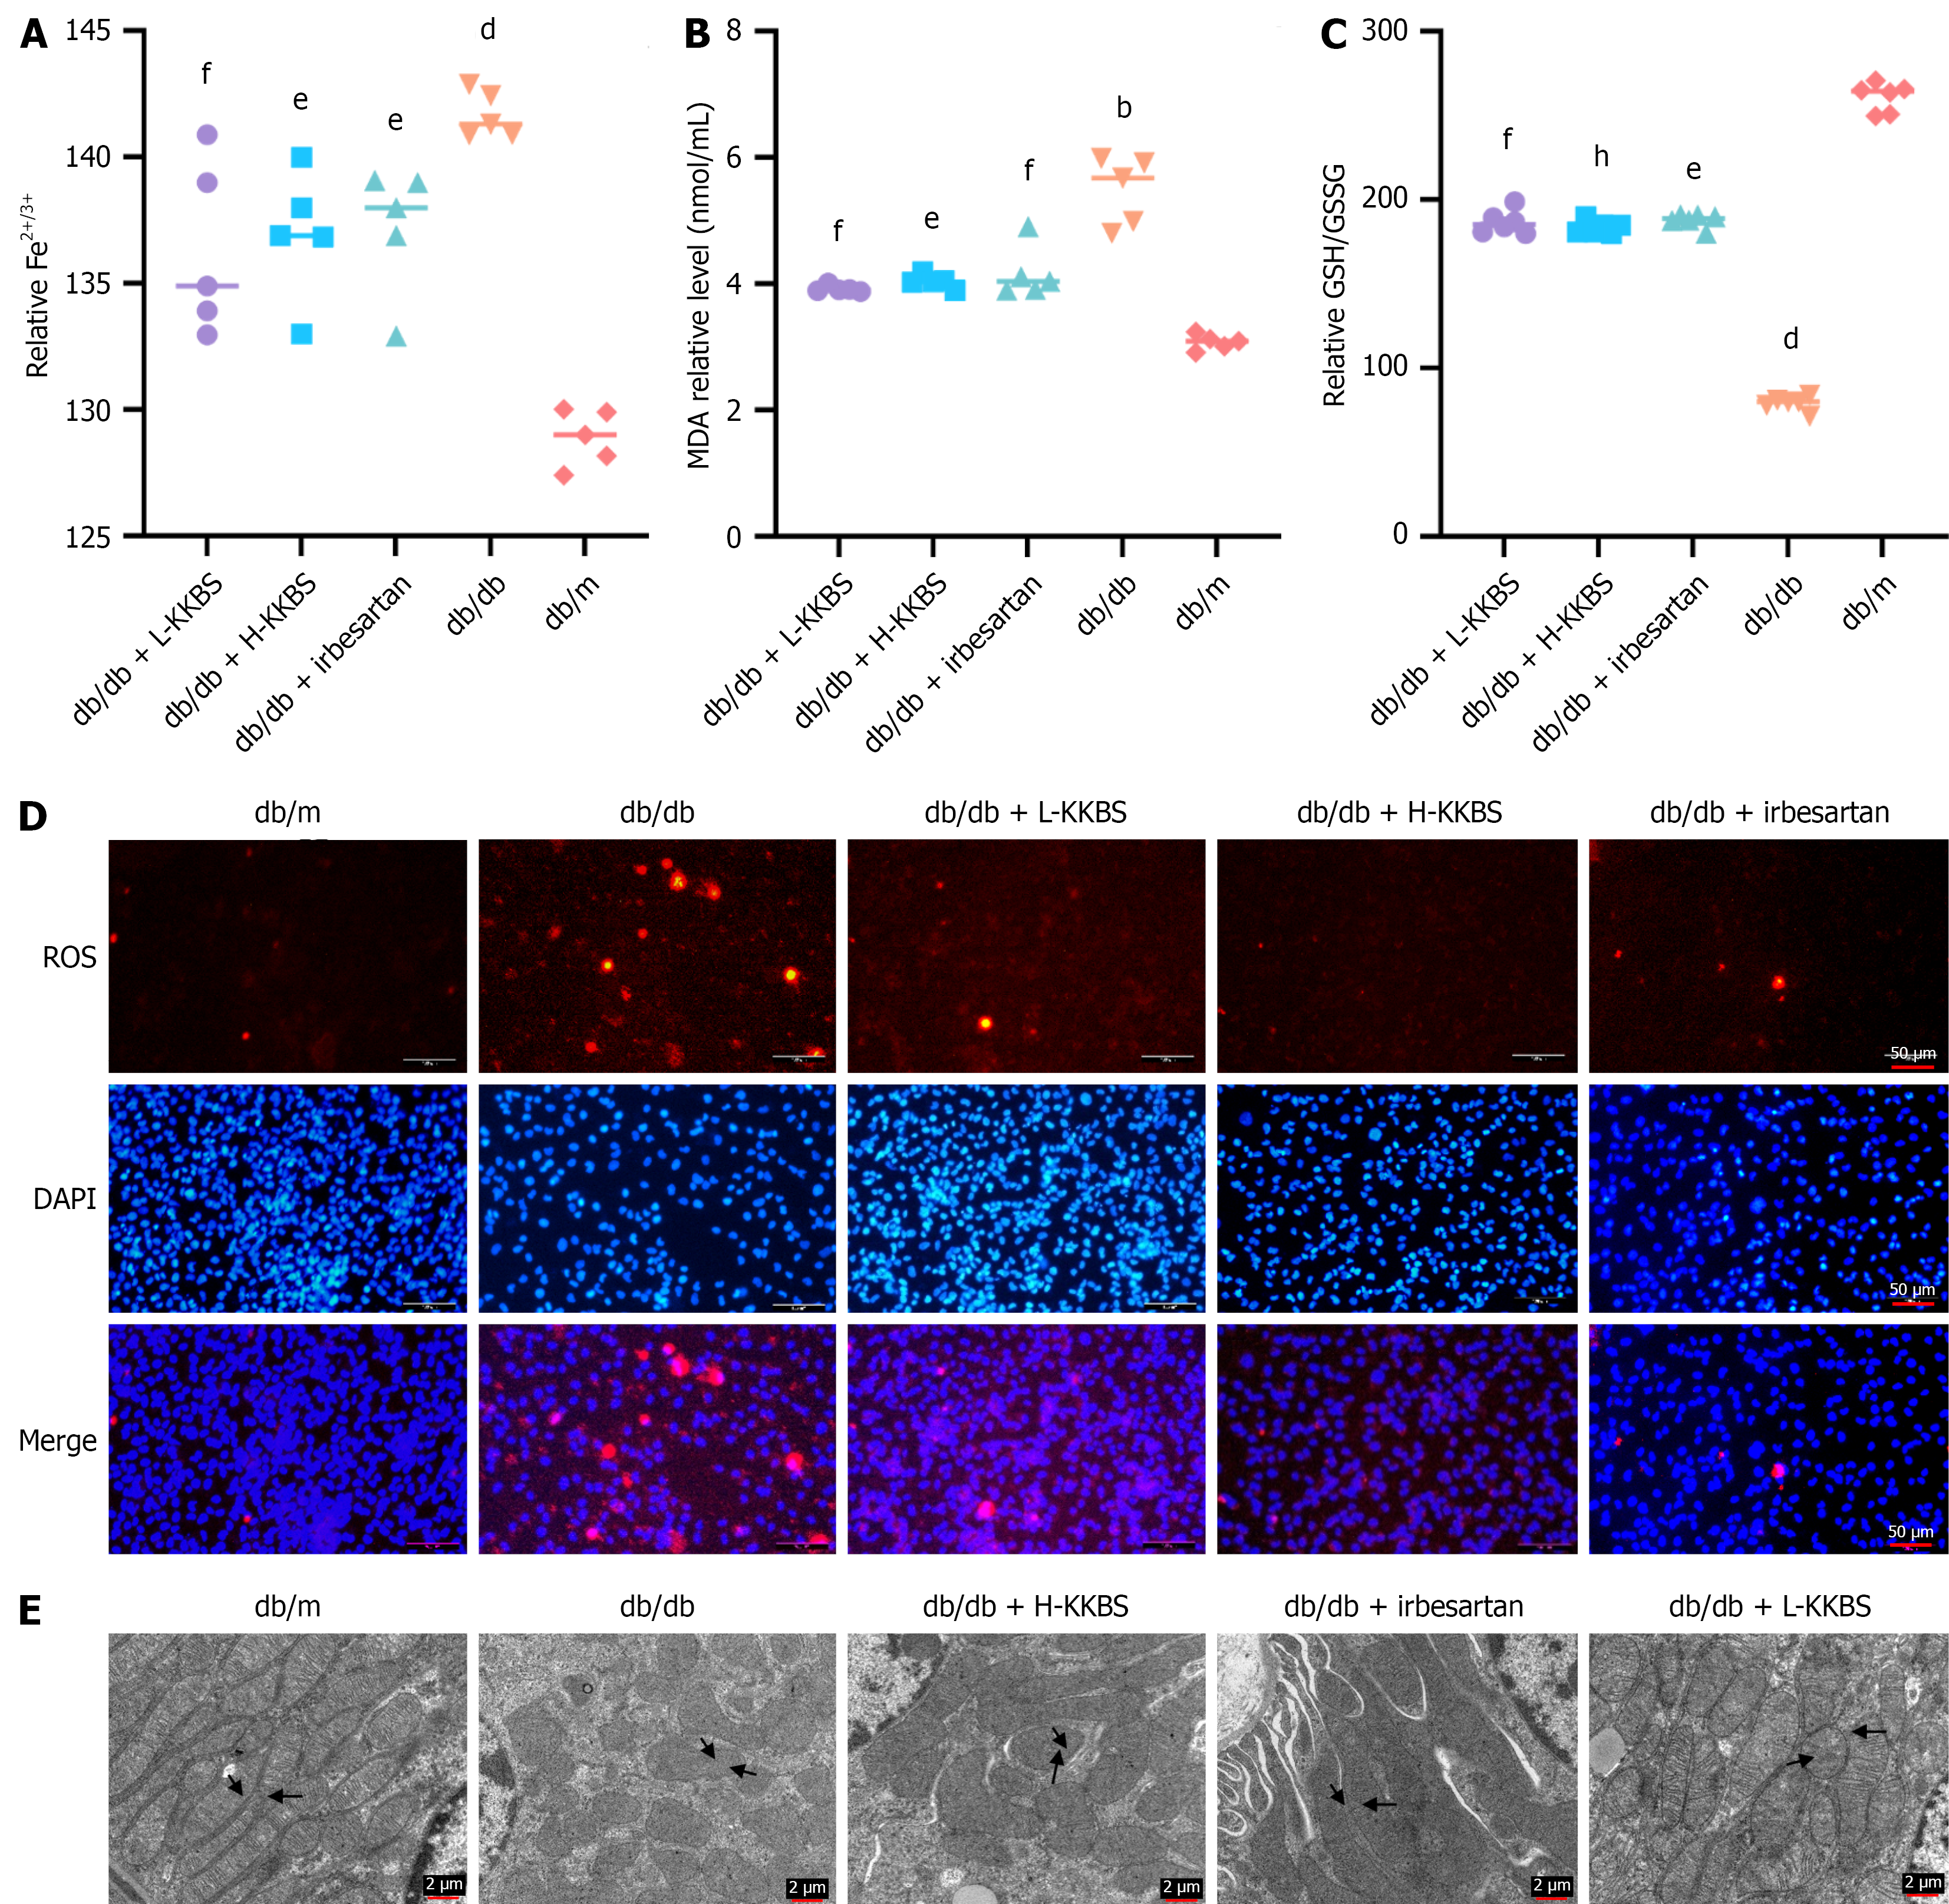
Figure 8 Kunkui Baoshen decoction alleviates fibrosis by inhibiting ferroptosis in vitro and in vivo.
A-C: Levels of Fe2+/Fe3+, malondialdehyde, and glutathione/oxidized glutathione in renal tissues; D: Reactive oxygen species levels assessed by fluorescence microscopy in renal tissues (scale bars = 50 μm); E: Transmission electron microscopy images showing mitochondrial morphological changes related to ferroptosis in renal tissues (scale bars = 2 μm). L-KKBS: Low-dose Kunkui Baoshen decoction; H-KKBS: High-dose Kunkui Baoshen decoction; MDA: Malondialdehyde; GSH: Glutathione; GSSG: Oxidized glutathione; ROS: Reactive oxygen species. bP < 0.01 vs db/m group, dP < 0.0001 vs db/m group, eP < 0.05 vs db/db group, fP < 0.01 vs db/db group, and hP < 0.0001 vs db/db group.
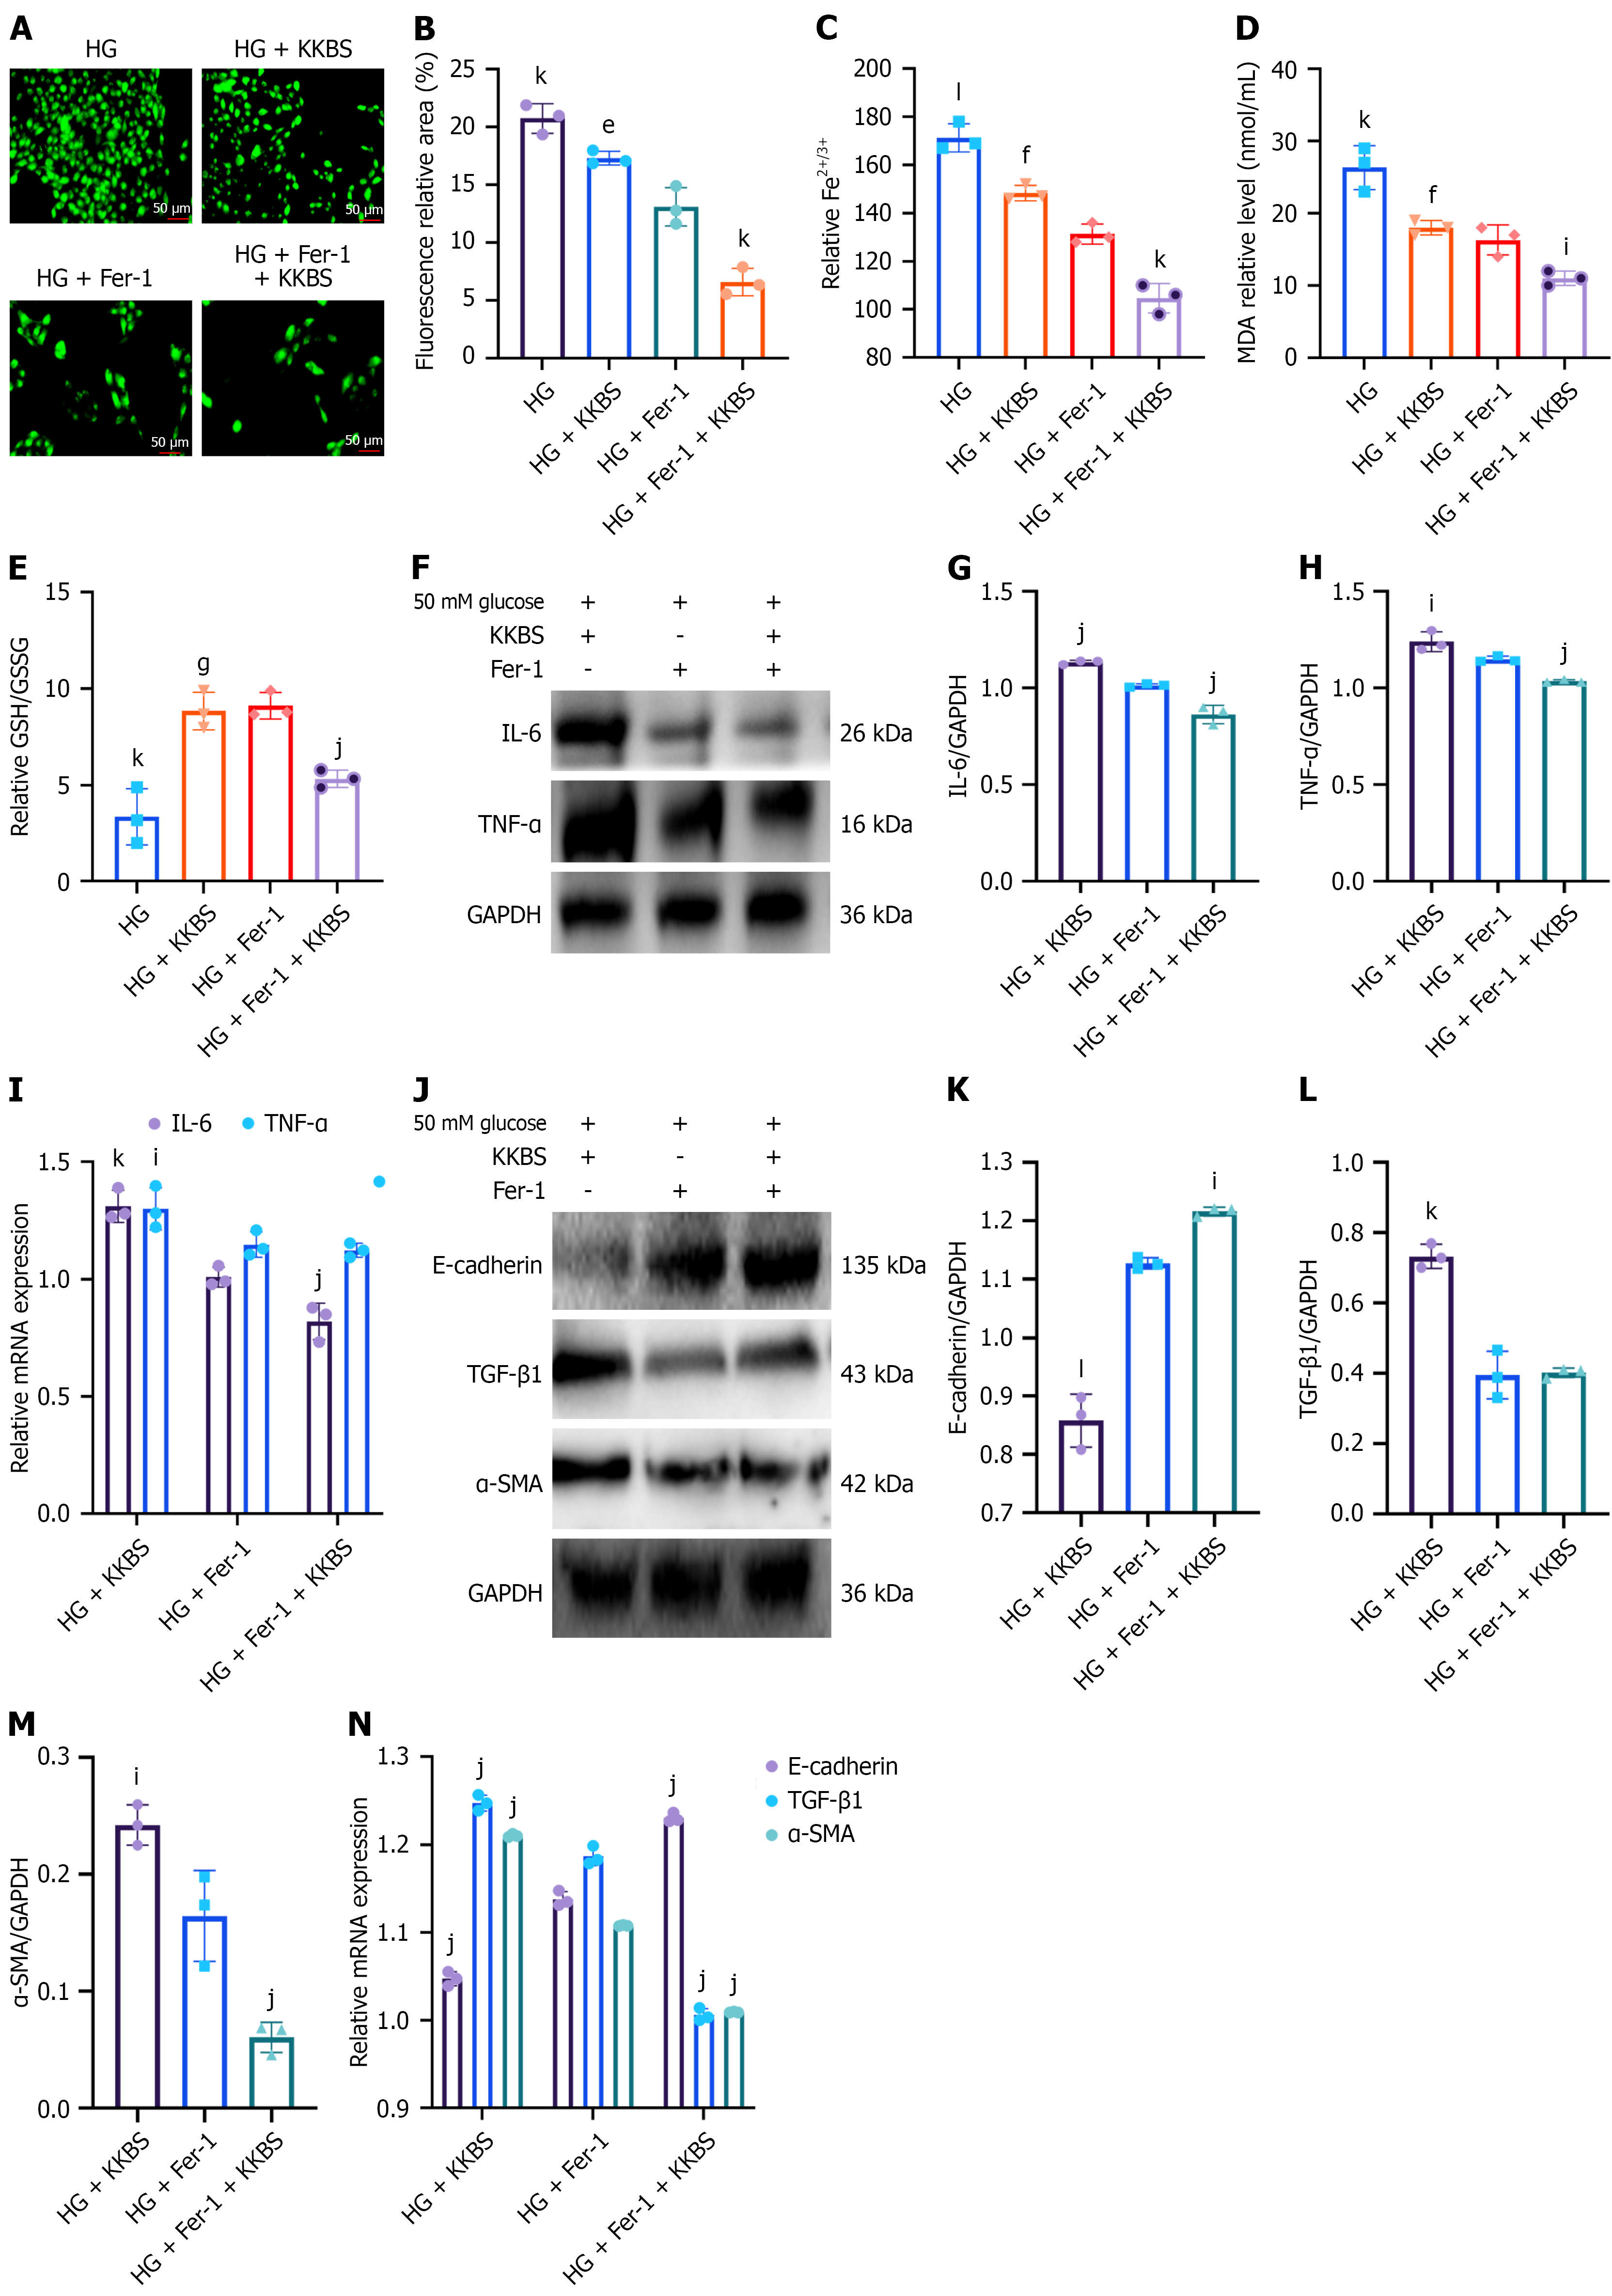
Figure 9 Kunkui Baoshen decoction alleviates fibrosis by inhibiting ferroptosis in vitro and in vivo.
A and B: Reactive oxygen species expression and fluorescence area quantification in human kidney-2 (HK-2) cells (scale bars = 50 μm); C-E: Levels of Fe2+/Fe3+, malondialdehyde, and glutathione/oxidized glutathione in HK-2 cells; F-I: Western blot and quantitative reverse transcription-polymerase chain reaction analyses of the inflammatory cytokines interleukin-6 and tumor necrosis factor-α in HK-2 cells; J-N: Western blot and quantitative reverse transcription-polymerase chain reaction analyses of epithelial-cadherin, α-smooth muscle actin, and transforming growth factor-β1 in HK-2 cells. KKBS: Kunkui Baoshen decoction; HG: High glucose; Fer-1: Ferrostatin-1; IL-6: Interleukin-6; TNF-α: Tumor necrosis factor-α; E-cadherin: Epithelial-cadherin; TGF-β1: Transforming growth factor-β1; α-SMA: α-smooth muscle actin; GAPDH: Glyceraldehyde 3-phosphate dehydrogenase. eP < 0.05 vs high glucose group, fP < 0.01 vs high glucose group, gP < 0.001 vs high glucose group; iP < 0.05 vs high glucose + ferrostatin-1 group, jP < 0.01 vs high glucose + ferrostatin-1 group, kP < 0.001 vs high glucose + ferrostatin-1 group, lP < 0.0001 vs high glucose + ferrostatin-1 group.
Figure 10 Kunkui Baoshen decoction modulates ferroptosis by regulating nuclear receptor coactivator 4-mediated ferritinophagy.
A-G: Western blot and quantitative reverse transcription-polymerase chain reaction analyses of autophagy related 7 (ATG7), nuclear receptor coactivator 4 (NCOA4), microtubule-associated protein light chain 3 (LC3), sequestosome 1 (SQSTM1/p62), and ferritin heavy chain 1 (FTH1) in normal and high glucose groups; H: Co-localization of ferritinophagy-related proteins observed by immunofluorescence double staining in human kidney-2 cells (scale bars = 50 μm); I-O: Western blot and quantitative reverse transcription-polymerase chain reaction analyses of ATG7, NCOA4, LC3, SQSTM1/p62, and FTH1 in the four groups; P-V: Western blot analysis of ATG7, glutathione peroxidase 4, solute carrier family 7 member 11, LC3, SQSTM1/p62, and FTH1 after NCOA4 knockdown. NG: Normal group; HG: High glucose; ATG7: Autophagy related 7; NCOA4: Nuclear receptor coactivator 4; LC3: Microtubule-associated protein light chain 3; SQSTM1/p62: Sequestosome 1; FTH1: Ferritin heavy chain 1; Fer-1: Ferrostatin-1; KKBS:: Kunkui Baoshen decoction; GPX4: Glutathione peroxidase 4; SLC7A11: Solute carrier family 7 member 11; GAPDH: Glyceraldehyde 3-phosphate dehydrogenase; si-NC: Negative control small interfering RNA; si-NCOA4: Nuclear receptor coactivator 4-targeting small interfering RNA. aP < 0.05 vs normal group, bP < 0.01 vs normal group, dP < 0.0001 vs normal group; eP < 0.05 vs high glucose group, fP < 0.01 vs high glucose group, gP < 0.001 vs high glucose group, hP < 0.0001 vs high glucose group; iP < 0.05 vs high glucose + ferrostatin-1 group, jP < 0.01 vs high glucose + ferrostatin-1 group, kP < 0.001 vs high glucose + ferrostatin-1 group, lP < 0.0001 vs high glucose + ferrostatin-1 group; mP < 0.05 vs negative control small interfering RNA group; nP < 0.05 vs nuclear receptor coactivator 4-targeting small interfering RNA group, and oP < 0.01 vs nuclear receptor coactivator 4-targeting small interfering RNA group.
Figure 11 Kunkui Baoshen decoction inhibits autophagy-dependent ferroptosis by enhancing the ubiquitination of nuclear receptor coactivator 4 via homologous to E6-AP C-terminus and RCC1-like domain-containing E3 ubiquitin protein ligase.
A-D: Western blot analysis of nuclear receptor coactivator 4 (NCOA4) protein levels in human kidney-2 (HK-2) cells under high glucose conditions following treatment with Kunkui Baoshen decoction (KKBS), MG132 (10 μM), and 3-MA (5 mmol/L); E: Co-immunoprecipitation was performed using NCOA4 or immunoglobulin G antibodies to evaluate NCOA4 ubiquitination in high glucose-treated HK-2 cells with or without KKBS and MG132 pretreatment. Ubiquitination levels were assessed by Western blot; F-H: KKBS significantly upregulates homologous to E6-AP C-terminus and RCC1-like domain-containing E3 ubiquitin protein ligase (HERC2) expression at both the protein and mRNA levels; I: Co-localization of NCOA4 (red) and HERC2 (green) was observed via immunofluorescence double staining. DAPI (blue) was used for nuclear staining (scale bars = 50 μm); J: Co-immunoprecipitation analysis was conducted using NCOA4 and HERC2 antibodies to confirm protein-protein interactions; K and L: Protein and mRNA expression levels of interleukin-6, tumor necrosis factor-α, epithelial-cadherin, α-smooth muscle actin, and transforming growth factor-β1 in HK-2 cells after HERC2 overexpression; M-O: Expression of NCOA4 following HERC2 overexpression; P: After KKBS intervention, immunoblotting of HK-2 cells was performed using His- and Myc-tag antibodies to evaluate tagged protein expression; Q: Ubiquitination assay evaluating changes in NCOA4 ubiquitination levels following ectopic transfection with different ubiquitin lysine-mutant constructs; R: Molecular docking analysis validating the interaction between HERC2 (PDB ID: 7Q40) and NCOA4 (PDB ID: 1T5Z). NCOA4: Nuclear receptor coactivator 4; HG: High glucose; KKBS: Kunkui Baoshen decoction; UB: Ubiquitin; NG: Normal group; HERC2: Homologous to E6-AP C-terminus and RCC1-like domain-containing E3 ubiquitin protein ligase; IL-6: Interleukin-6; TNF-α: Tumor necrosis factor-α; E-cadherin: Epithelial-cadherin; TGF-β1: Transforming growth factor-β1; α-SMA: α-smooth muscle actin; GAPDH: Glyceraldehyde 3-phosphate dehydrogenase; His-UB: Histidine-ubiquitin; OE-HERC2: Overexpression of homologous to E6-AP C-terminus and RCC1-like domain-containing E3 ubiquitin protein ligase. aP < 0.05 vs normal group, bP < 0.01 vs normal group; fP < 0.01 vs high glucose group, gP < 0.001 vs high glucose group; pP < 0.01 vs high glucose + Kunkui Baoshen decoction group; qP < 0.05 vs vector group, and rP < 0.01 vs vector group.
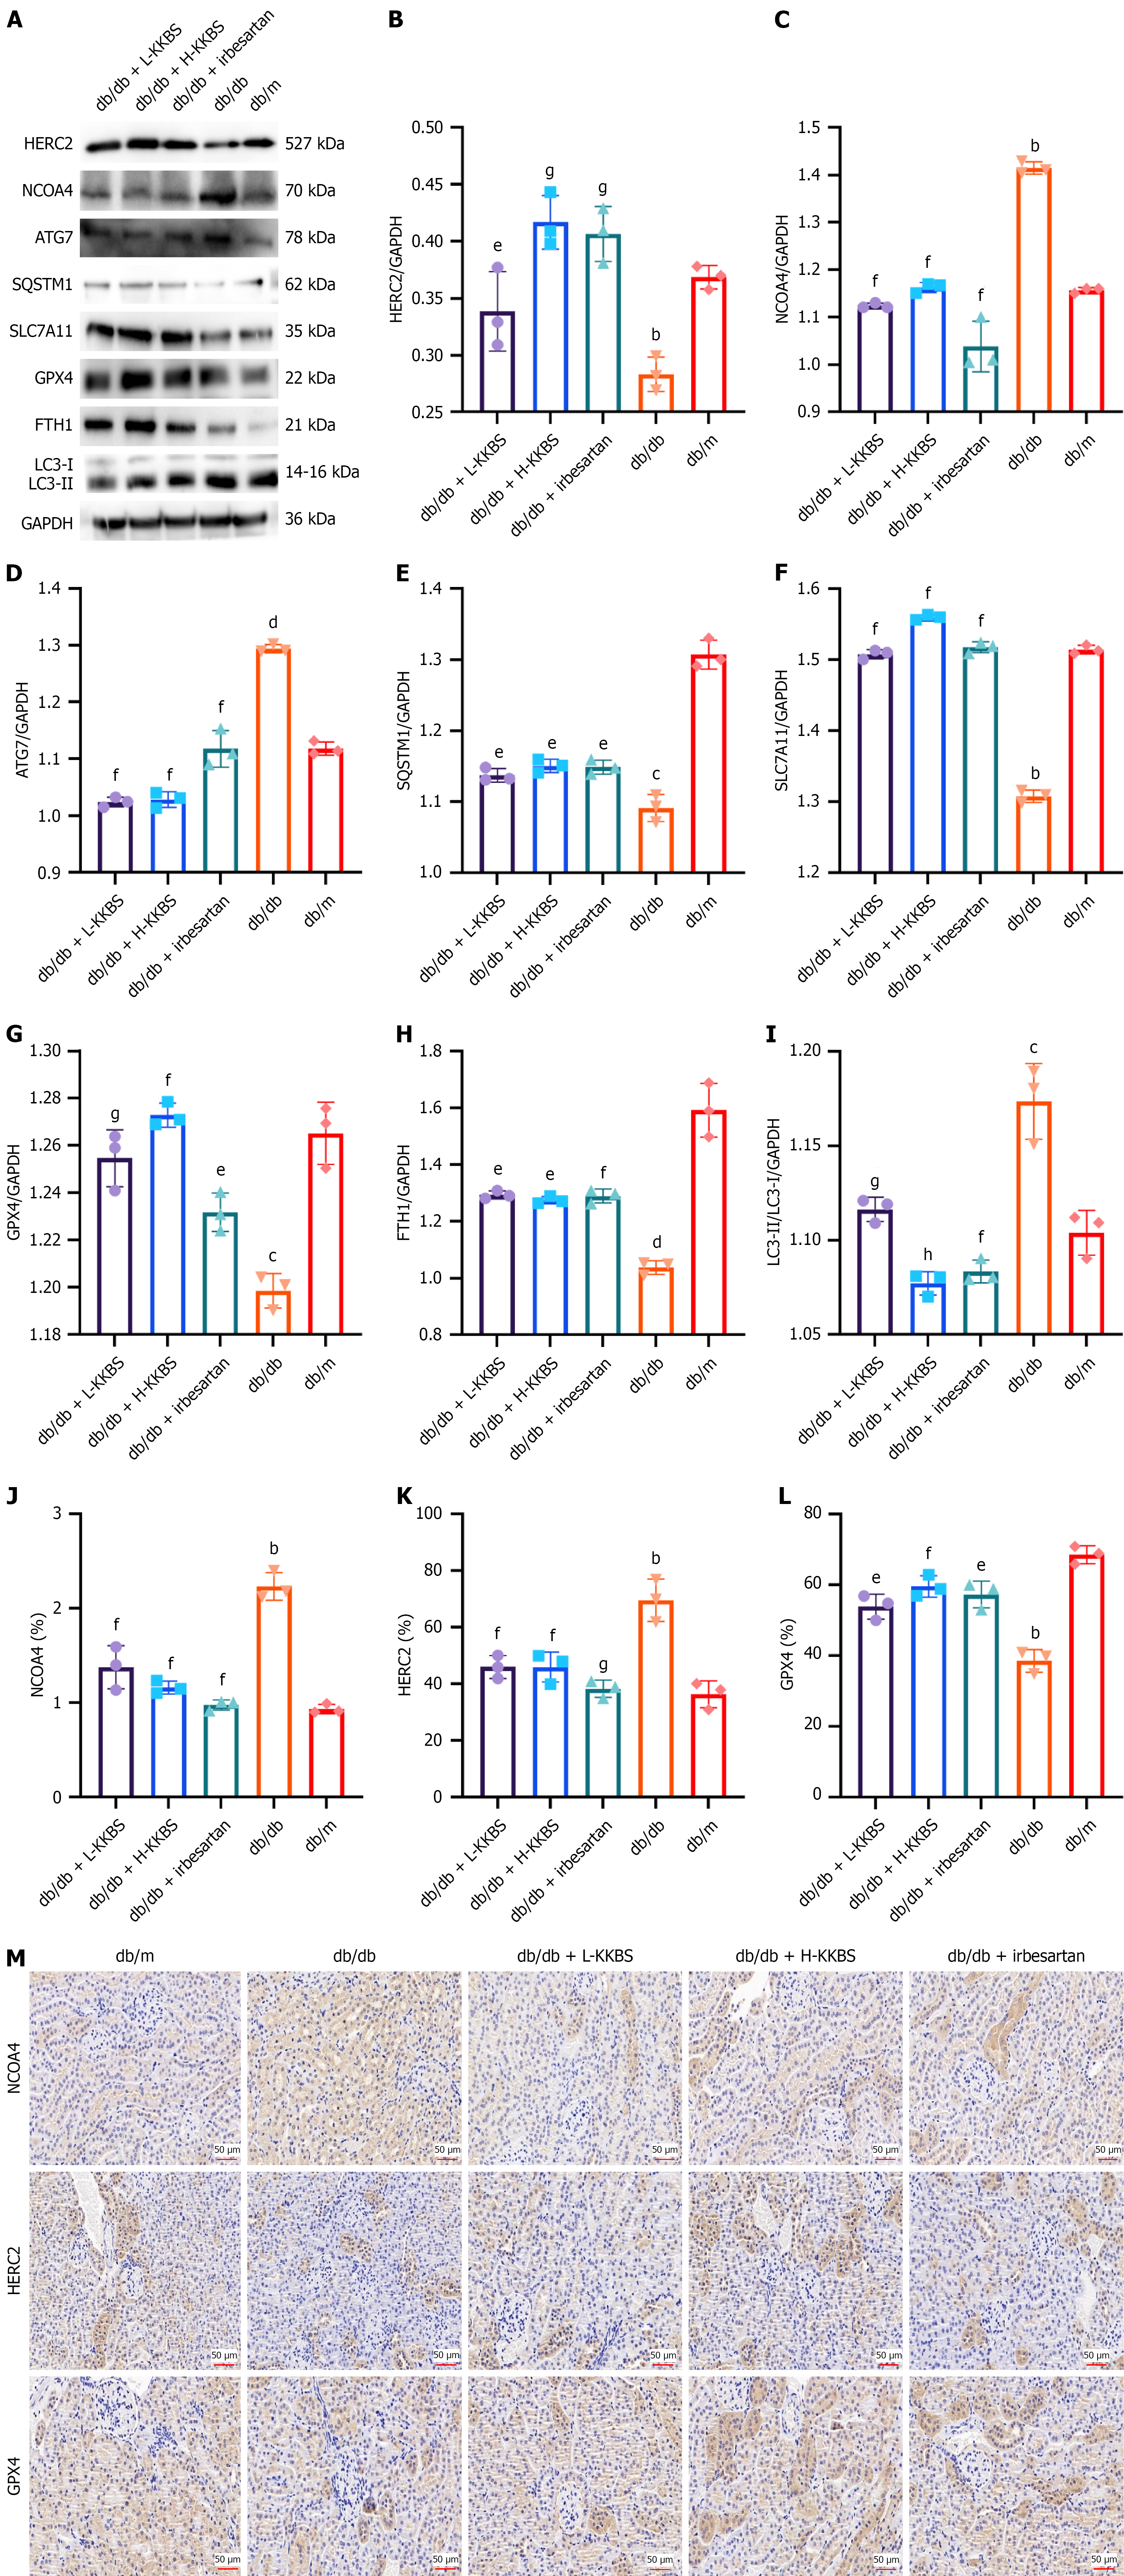
Figure 12 Effects of Kunkui Baoshen decoction on the homologous to E6-AP C-terminus and RCC1-like domain-containing E3 ubiquitin protein ligase/nuclear receptor coactivator 4-mediated autophagy-dependent ferroptosis pathway in db/db mice.
A-L: Western blot analysis of key proteins involved in the homologous to E6-AP C-terminus and RCC1-like domain-containing E3 ubiquitin protein ligase/nuclear receptor coactivator 4-mediated autophagy-dependent ferroptosis pathway in db/db mice; M: Immunohistochemical staining of renal tissues showing the expression of nuclear receptor coactivator 4, homologous to E6-AP C-terminus and RCC1-like domain-containing E3 ubiquitin protein ligase, and glutathione peroxidase 4. HERC2: Homologous to E6-AP C-terminus and RCC1-like domain-containing E3 ubiquitin protein ligase; NCOA4: Nuclear receptor coactivator 4; ATG7: Autophagy related 7; SQSTM1: Sequestosome 1; SLC7A11: Solute carrier family 7 member 11; GPX4: Glutathione peroxidase 4; FTH1: Ferritin heavy chain 1; LC3: Microtubule-associated protein light chain 3; GAPDH: Glyceraldehyde 3-phosphate dehydrogenase; L-KKBS: Low-dose Kunkui Baoshen decoction; H-KKBS: High-dose Kunkui Baoshen decoction. bP < 0.01 vs db/m group, cP < 0.001 vs db/m group, dP < 0.0001 vs db/m group; eP < 0.05 vs db/db group, fP < 0.01 vs db/db group, gP < 0.001 vs db/db group, and hP < 0.0001 vs db/db group.
- Citation: Song SY, Shan CC, Zhou PP, Xu WL, Tan Y, Zhou XQ, Huang LJ, Yan QH, Yu JY. Nephroprotective mechanism of Kunkui Baoshen decoction in diabetic kidney disease: Targeting the HERC2/NCOA4-mediated autophagy-dependent ferroptosis pathway. World J Diabetes 2025; 16(10): 109568
- URL: https://www.wjgnet.com/1948-9358/full/v16/i10/109568.htm
- DOI: https://dx.doi.org/10.4239/wjd.v16.i10.109568


