Copyright
©The Author(s) 2024.
World J Diabetes. Sep 15, 2024; 15(9): 1932-1941
Published online Sep 15, 2024. doi: 10.4239/wjd.v15.i9.1932
Published online Sep 15, 2024. doi: 10.4239/wjd.v15.i9.1932
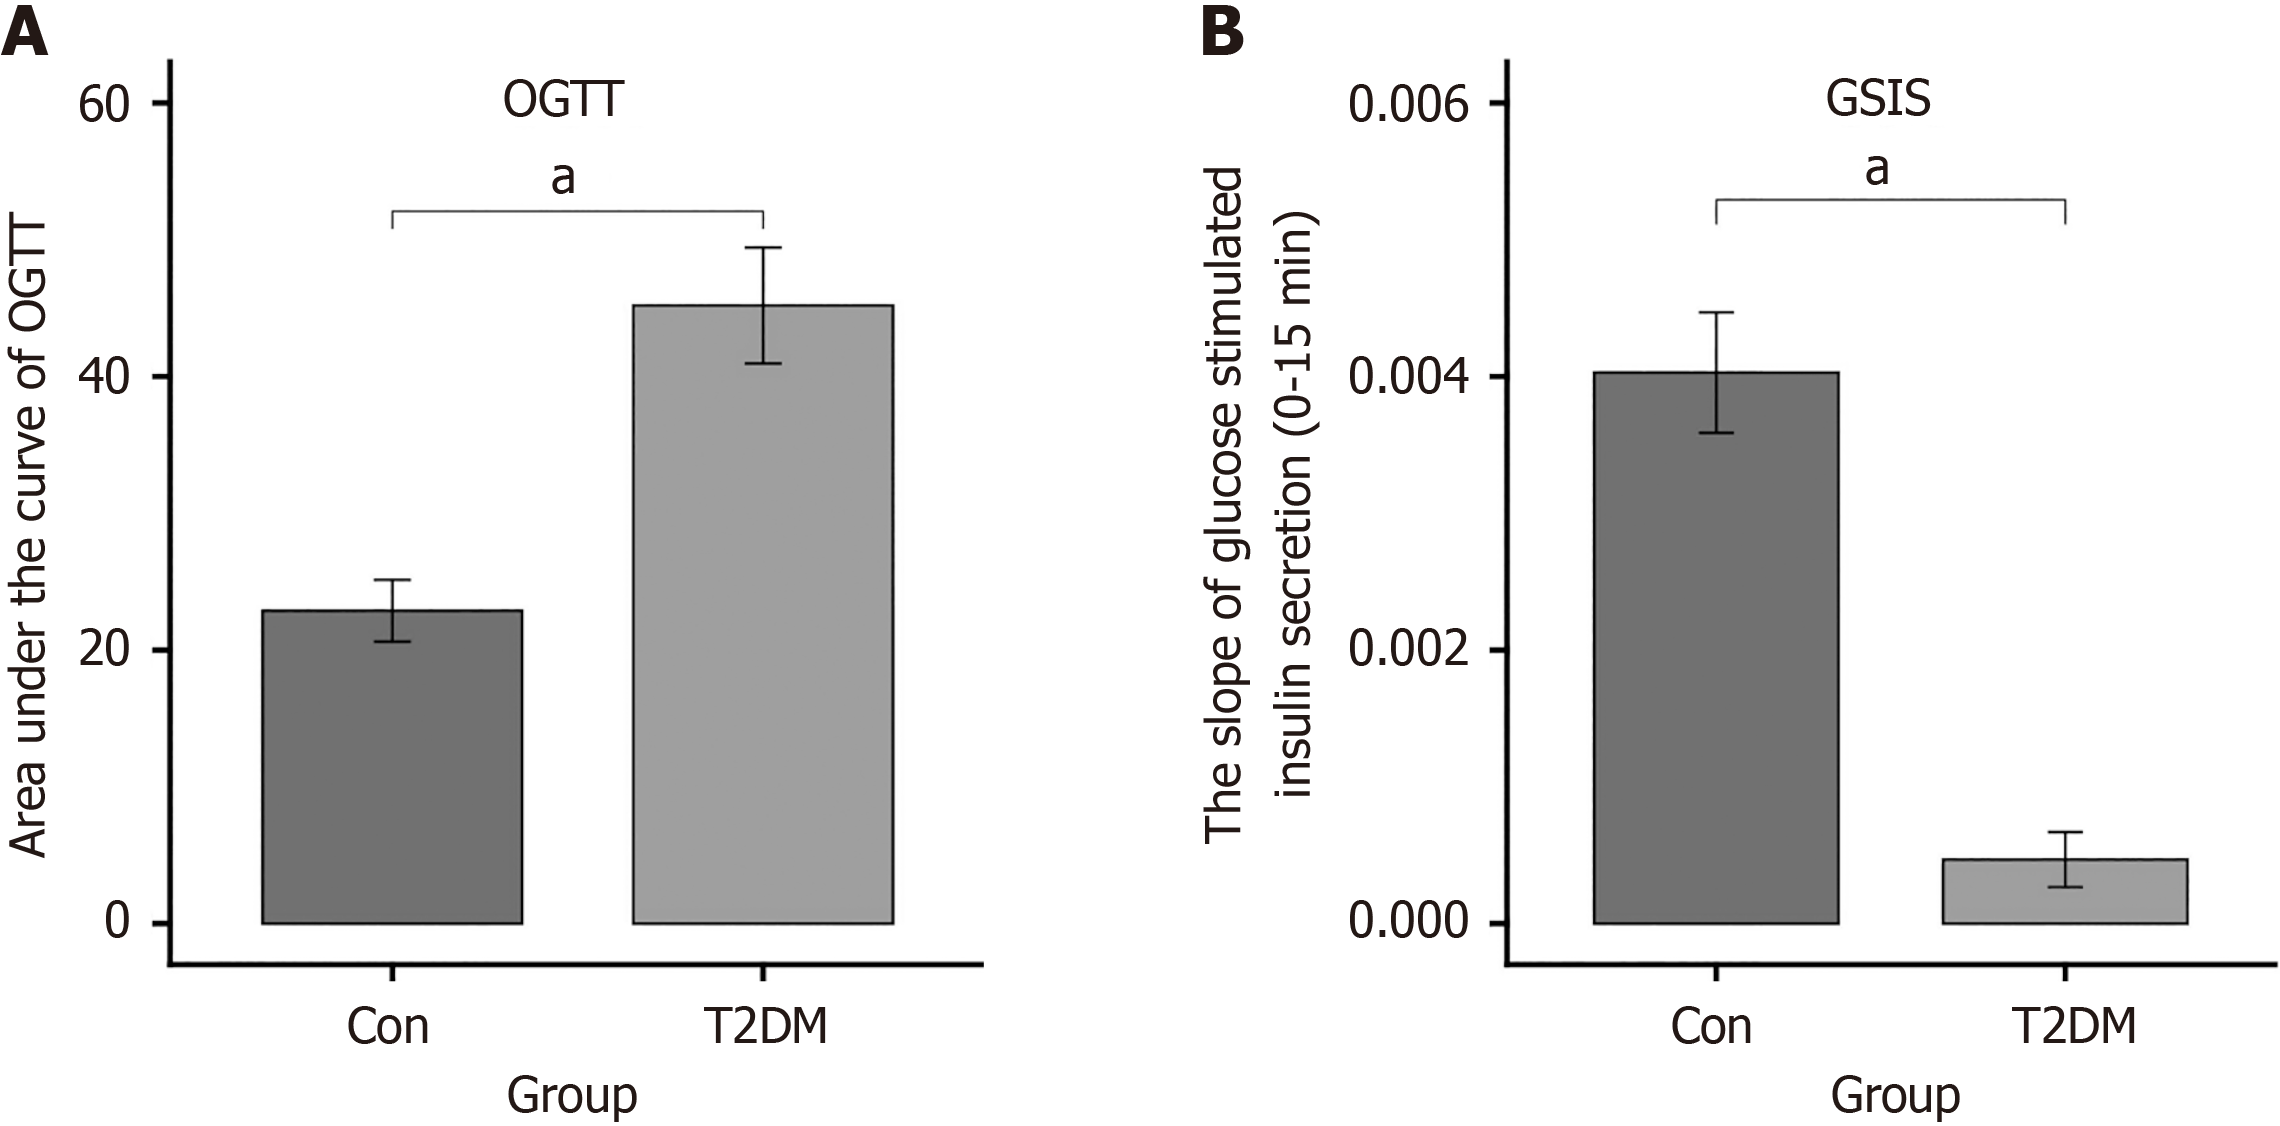
Figure 1 Changes of the glucose tolerance test, glucose-stimulated insulin secretion test in diabetes mellitus type 2 mice.
A: In the control group and diabetes mellitus type 2 (T2DM) groups, the glucose tolerance test curve and the area under the curve were assessed after orally gavage with glucose; B: After stimulation of glucose, plasma insulin concentrations were measured in different phases during glucose-stimulated insulin secretion test in control group and T2DM group. aP < 0.0001. T2DM: Diabetes mellitus type 2; OGTT: Glucose tolerance test; GSIS: Glucose-stimulated insulin secretion test.
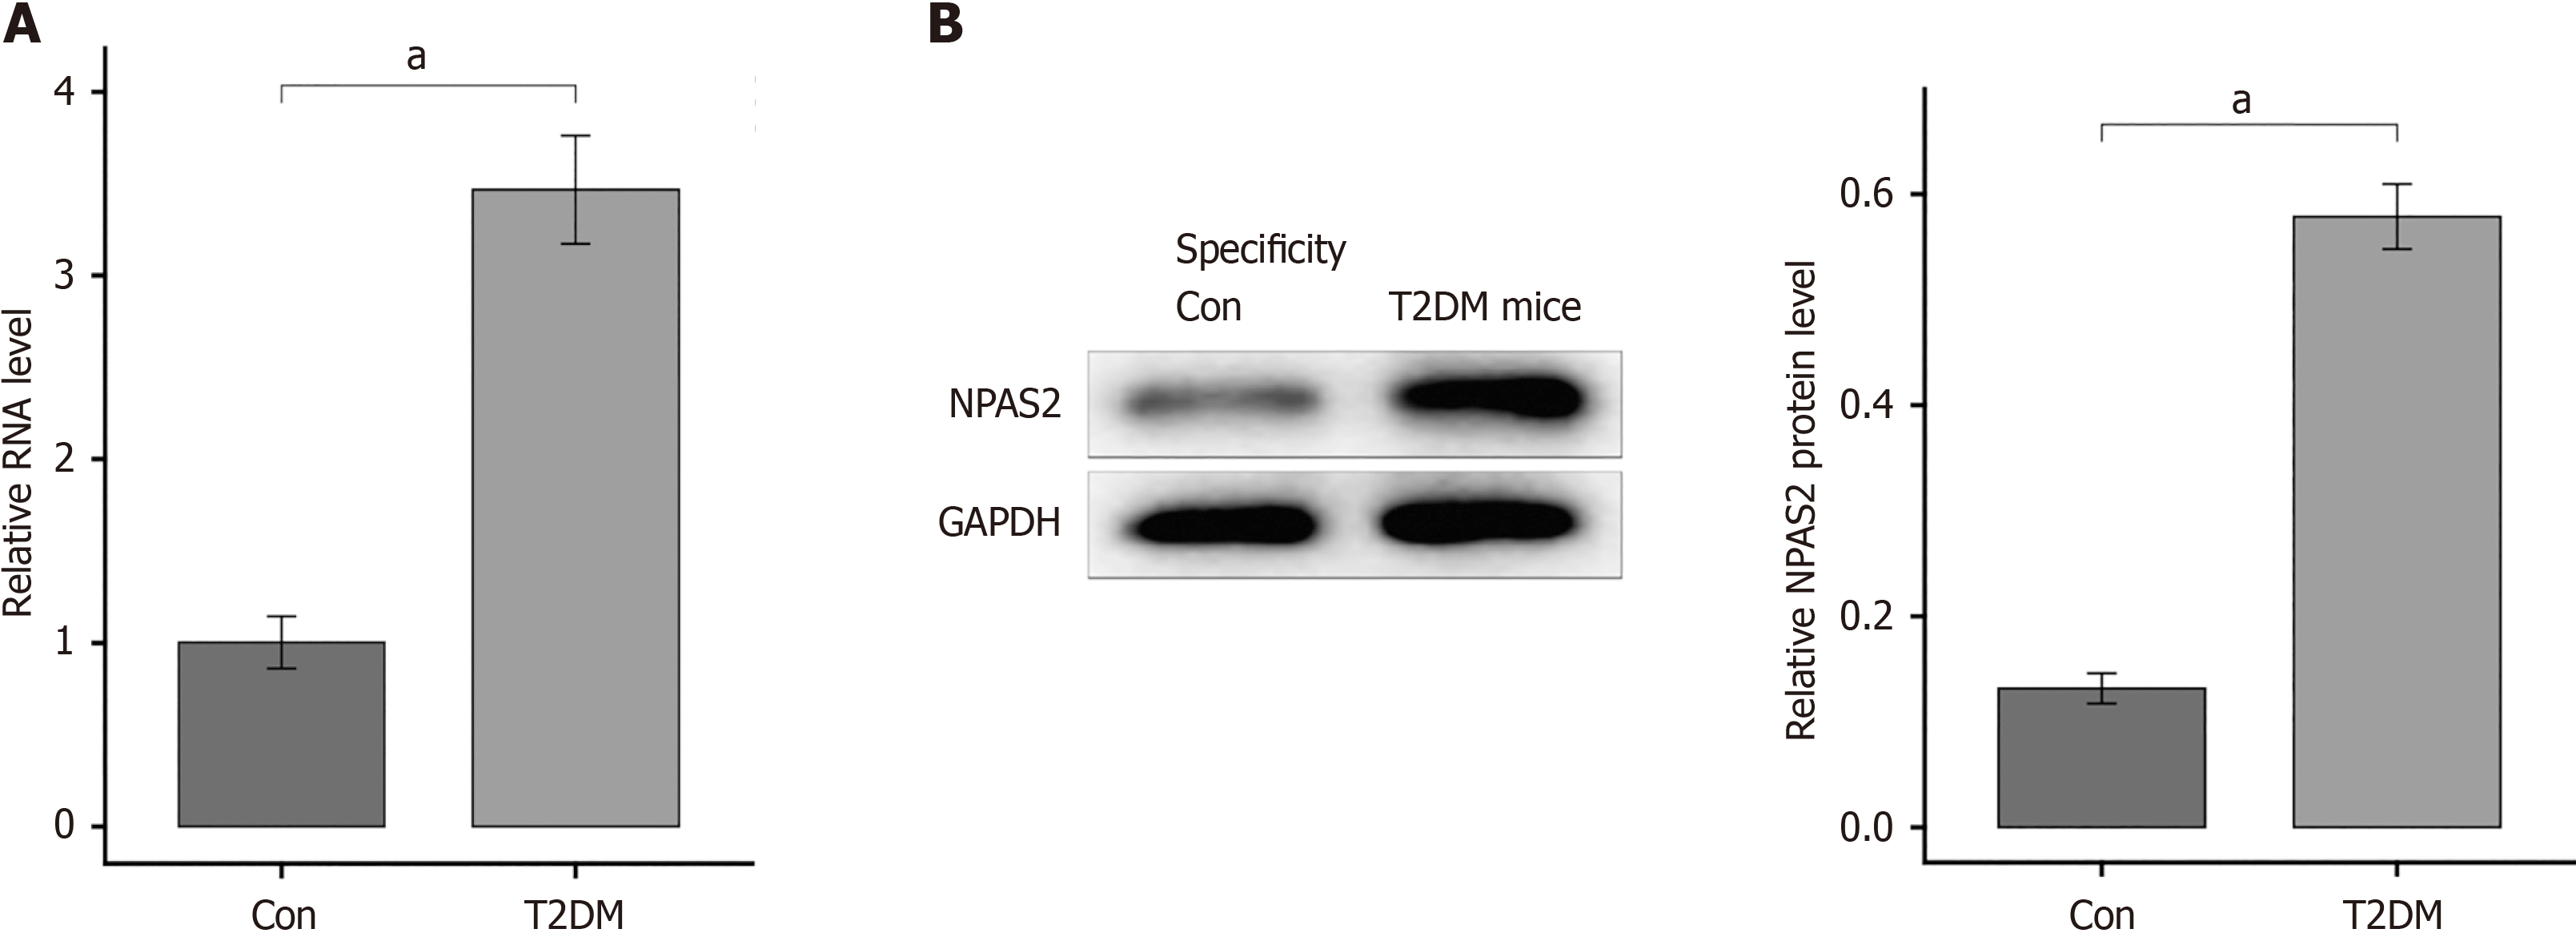
Figure 2 NPAS2 is highly expressed in diabetes mellitus type 2 samples.
A: NPAS2 levels in islet tissues of control group and diabetes mellitus type 2 (T2DM) group were detected by reverse transcription-PCR; B: Western blotting showed the overexpression of NPAS2 in T2DM. aP < 0.0001. T2DM: Diabetes mellitus type 2.
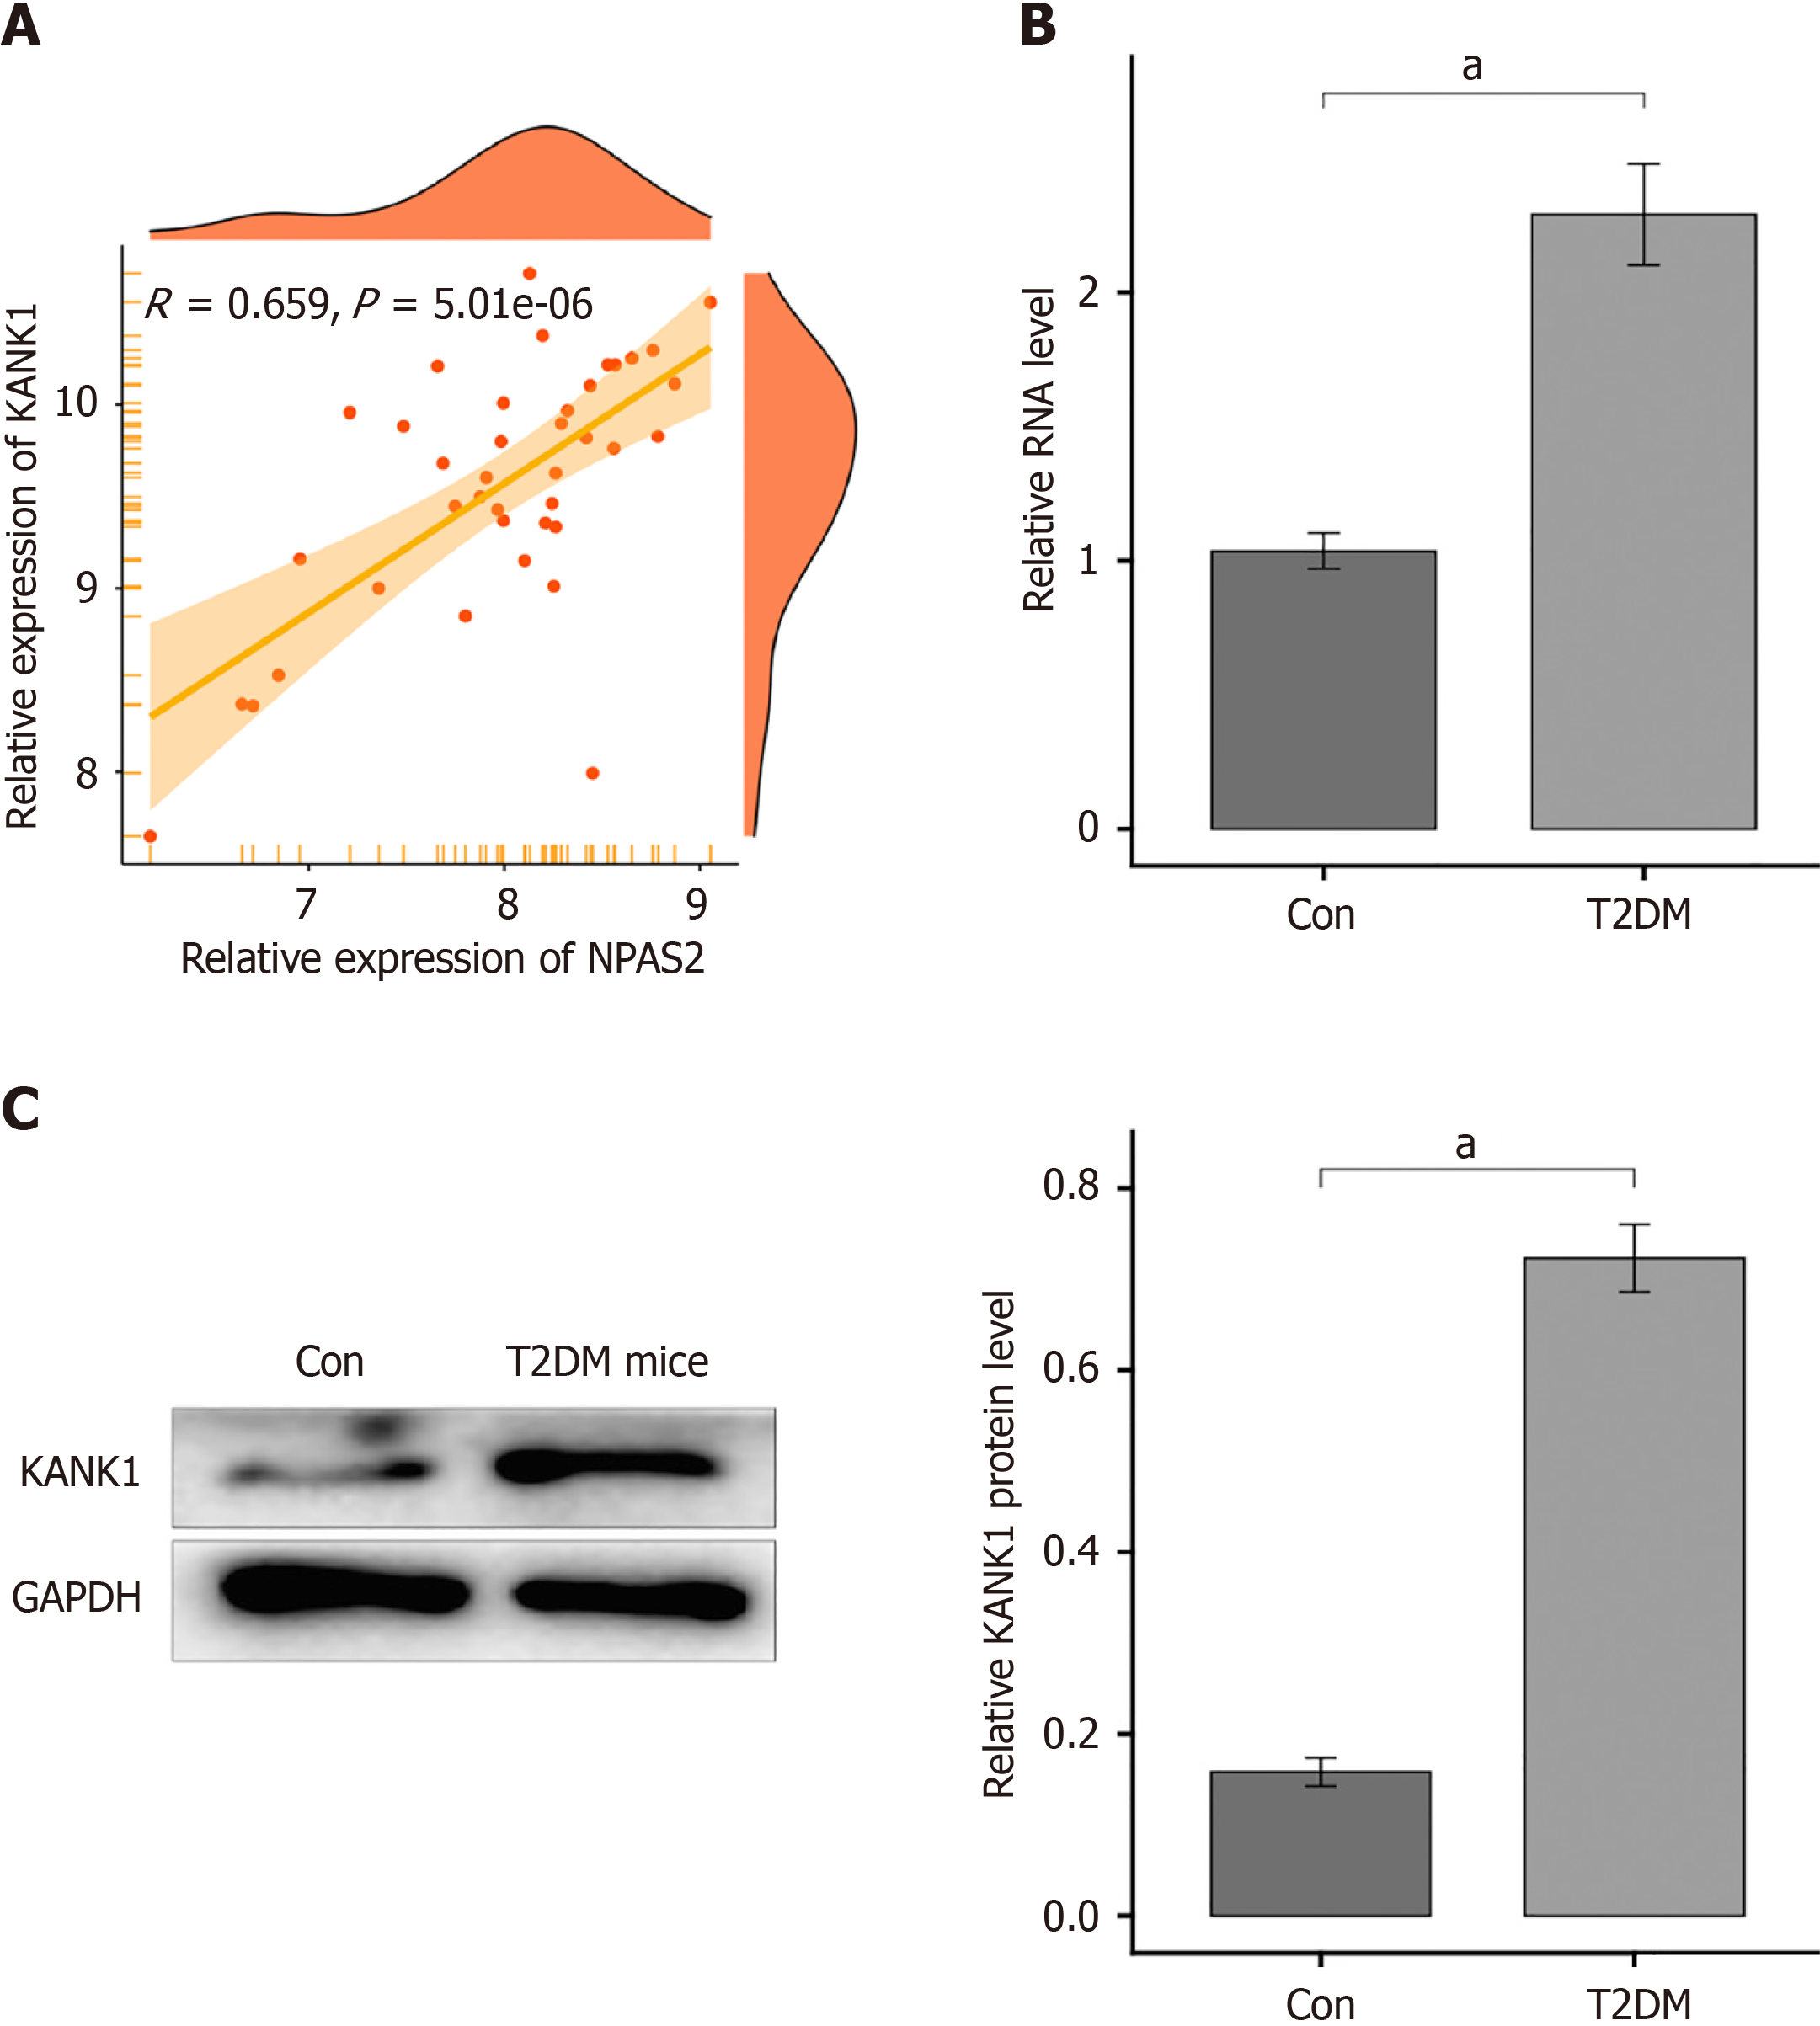
Figure 3 KANK1 was the potential target gene of NPAS2.
A: Scatter plot revealed the favorable connection between KANK1 and NPAS2 in diabetes mellitus type 2 (T2DM); B and C: The expression of KANK1 in T2DM group was higher than that in control group. aP < 0.0001. T2DM: Diabetes mellitus type 2.
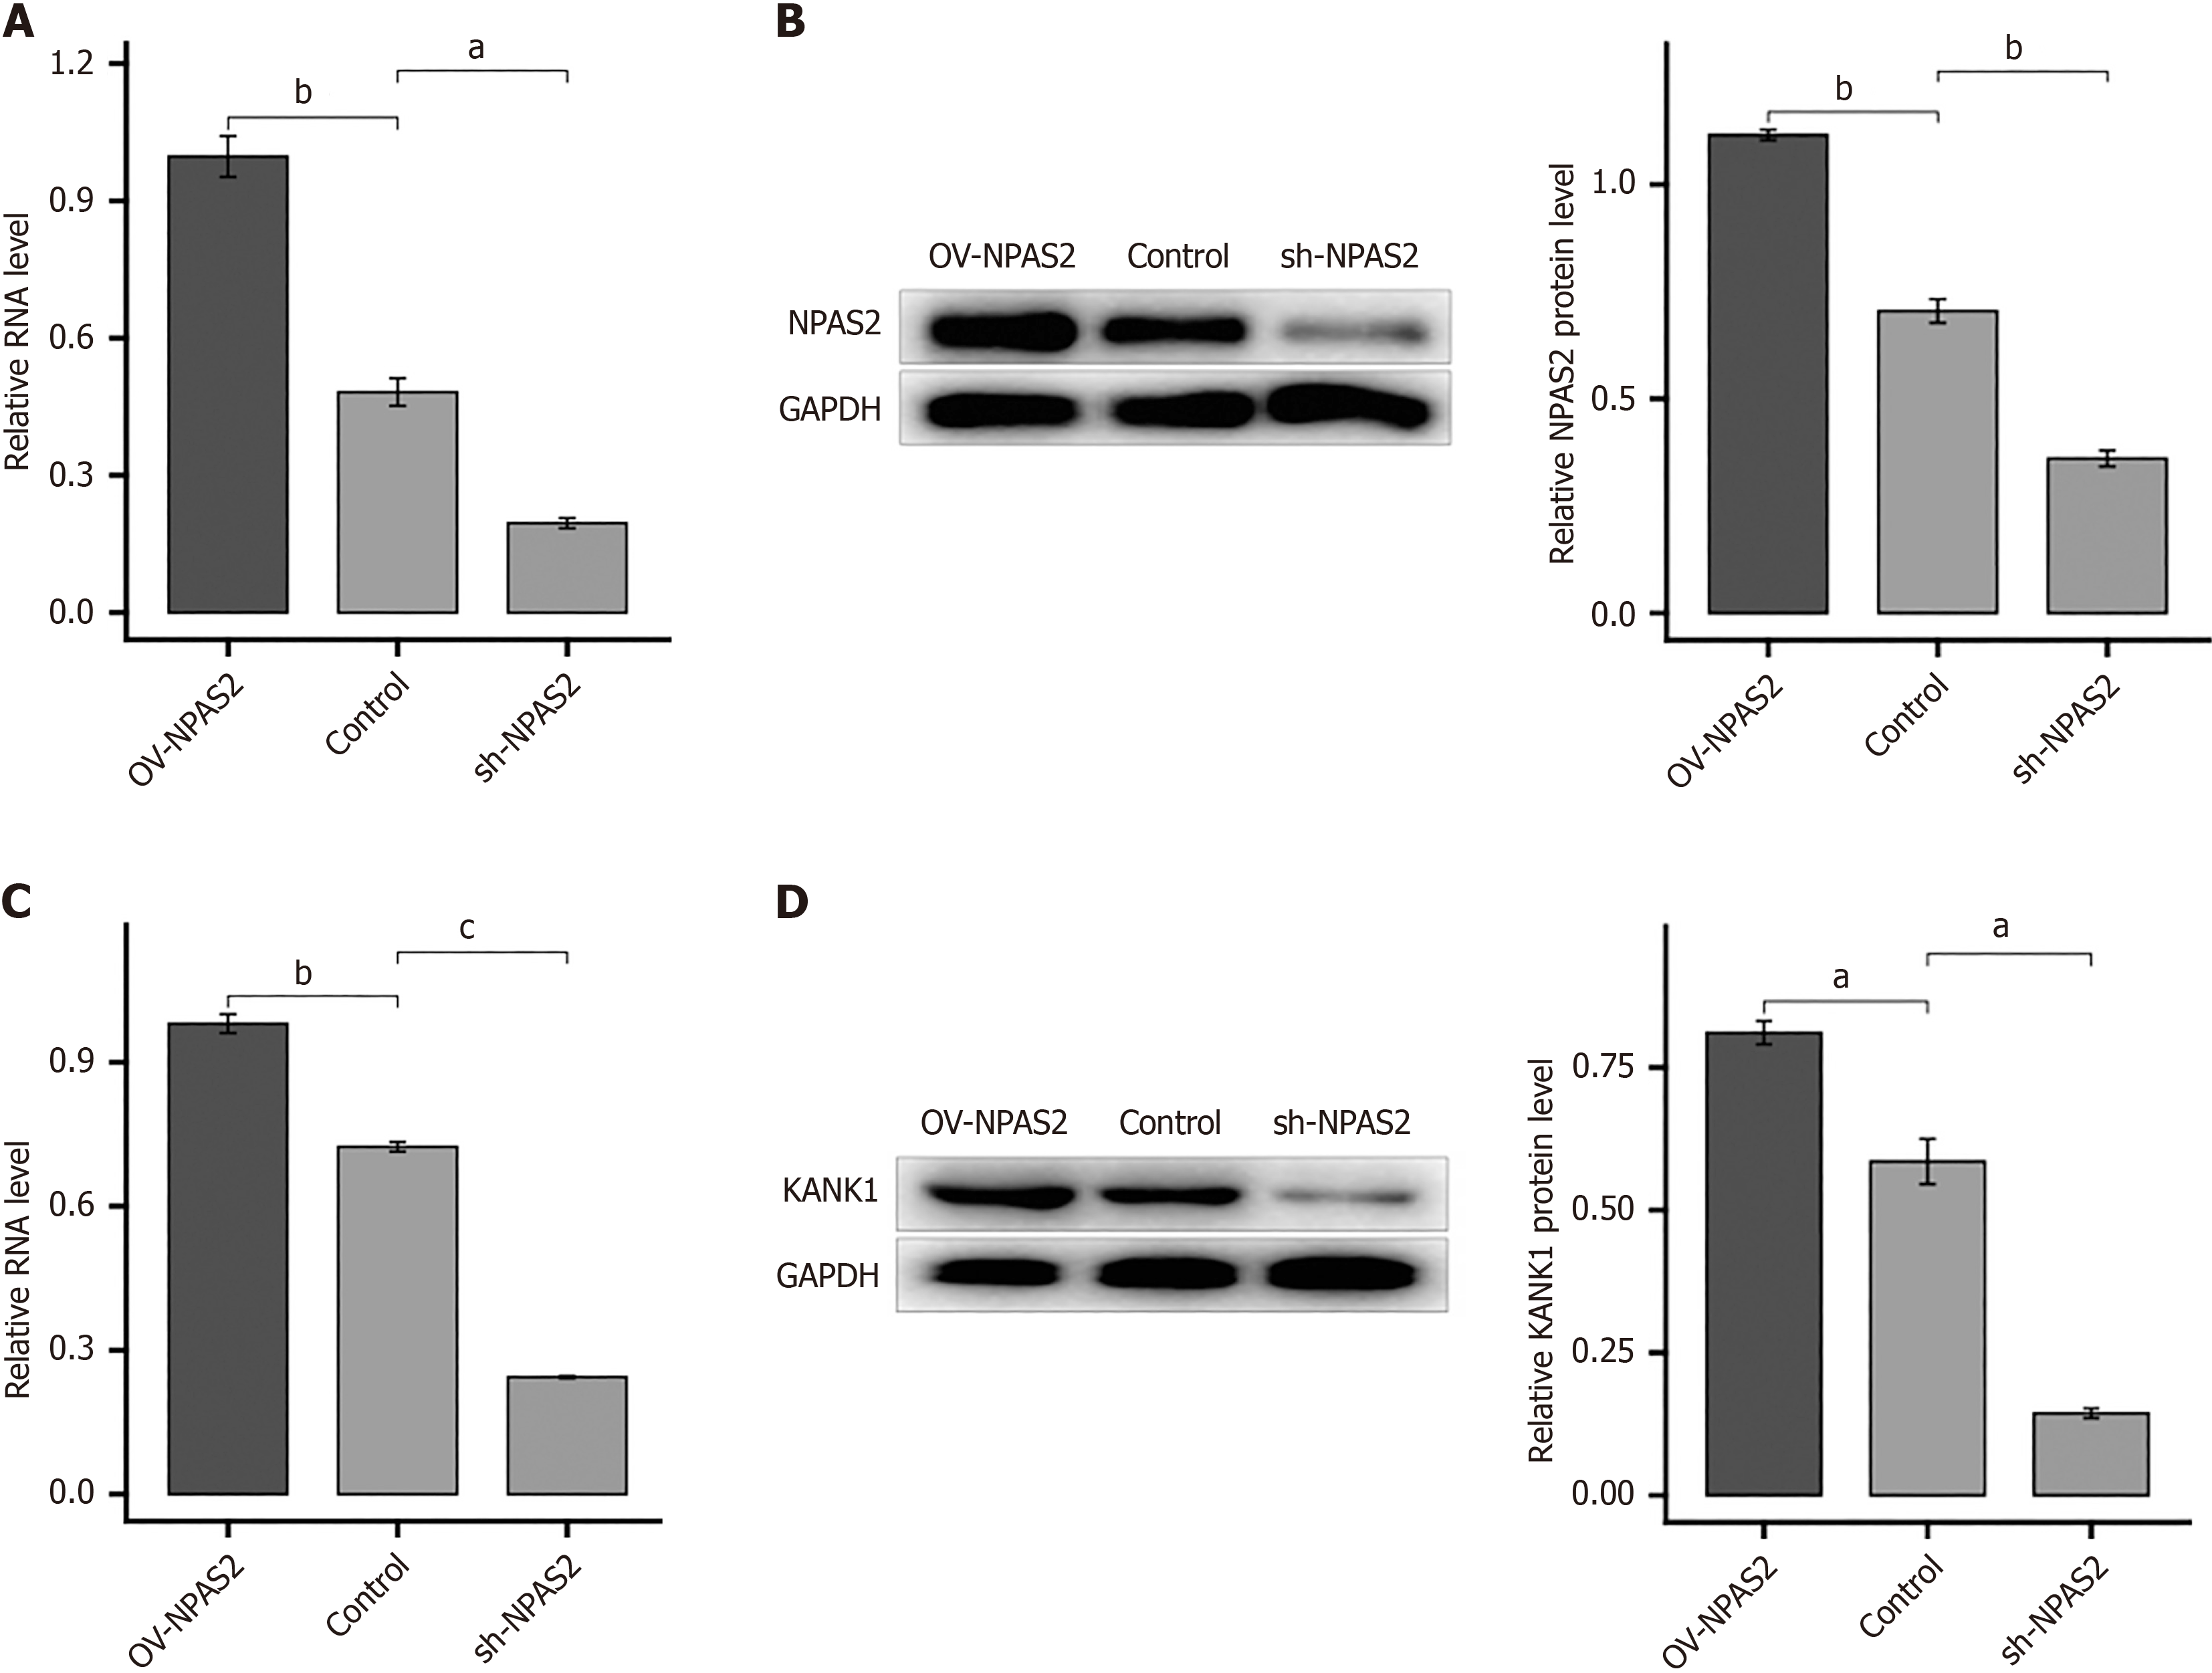
Figure 4 NPAS2 regulates KANK1expression.
A: Quantitative reverse transcriptase PCR (qRT-PCR) showed that NPAS2 overexpression increased the mRNA level of KANK1; B: Western blotting showed that NPAS2 overexpression enhanced the protein of KANK1; C: qRT-PCR showed knocking down NPAS2 with shRNA decreased the mRNA level of KANK1; D: Western blotting showed knocking down NPAS2 with shRNA decreased the protein of KANK1. aP < 0.01, bP < 0.001, cP < 0.0001. T2DM: Diabetes mellitus type 2.
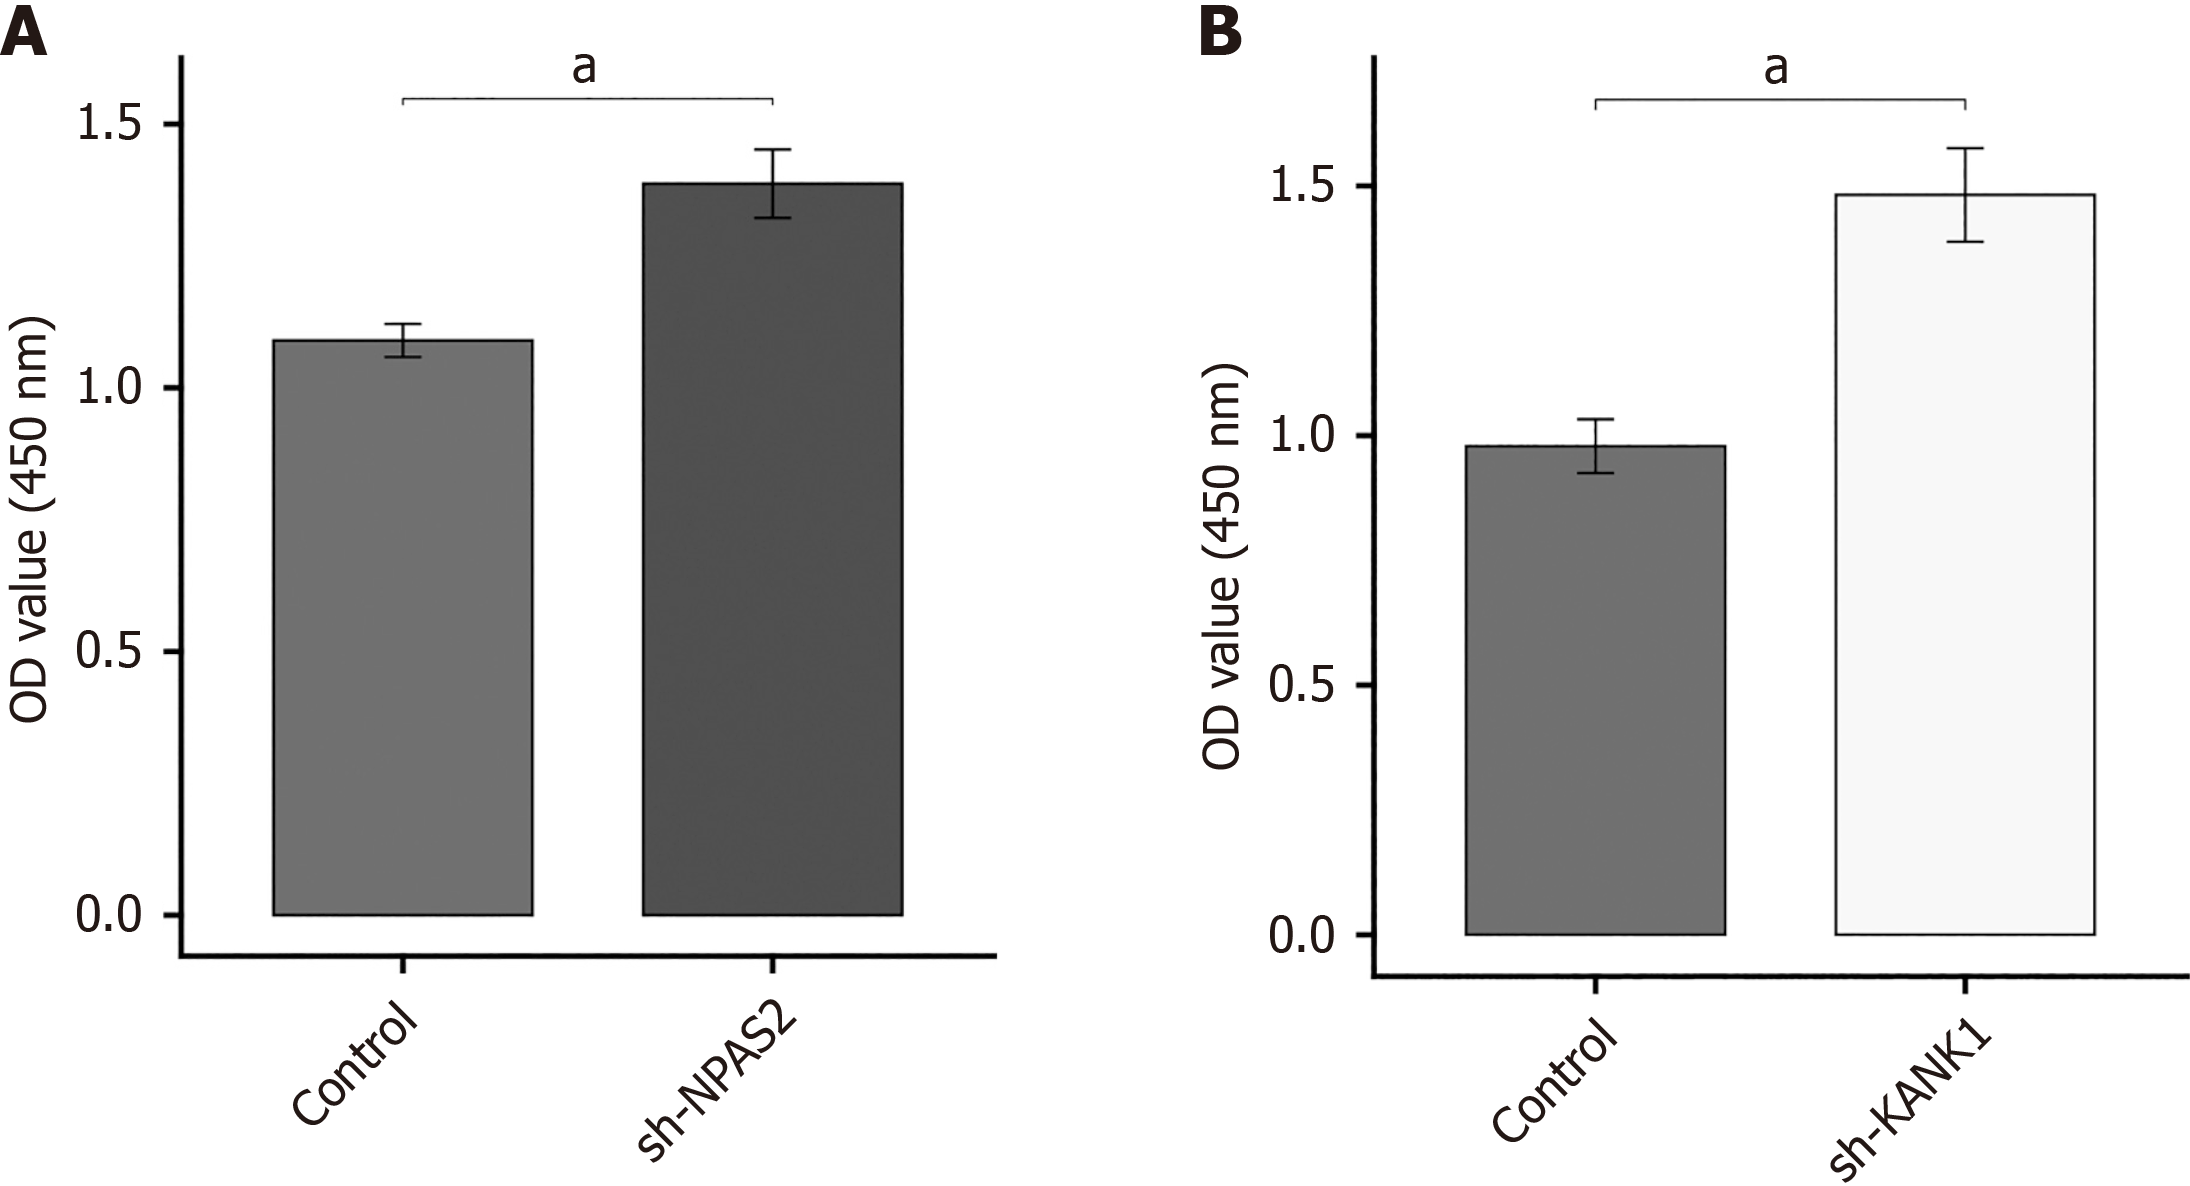
Figure 5 NPAS2 and KANK1 deceased β-cell survival.
A and B: CCK-8 tests showed that knocking down NPAS2 and KANK1 increased the proliferation of MIN6 cells. aP < 0.01.
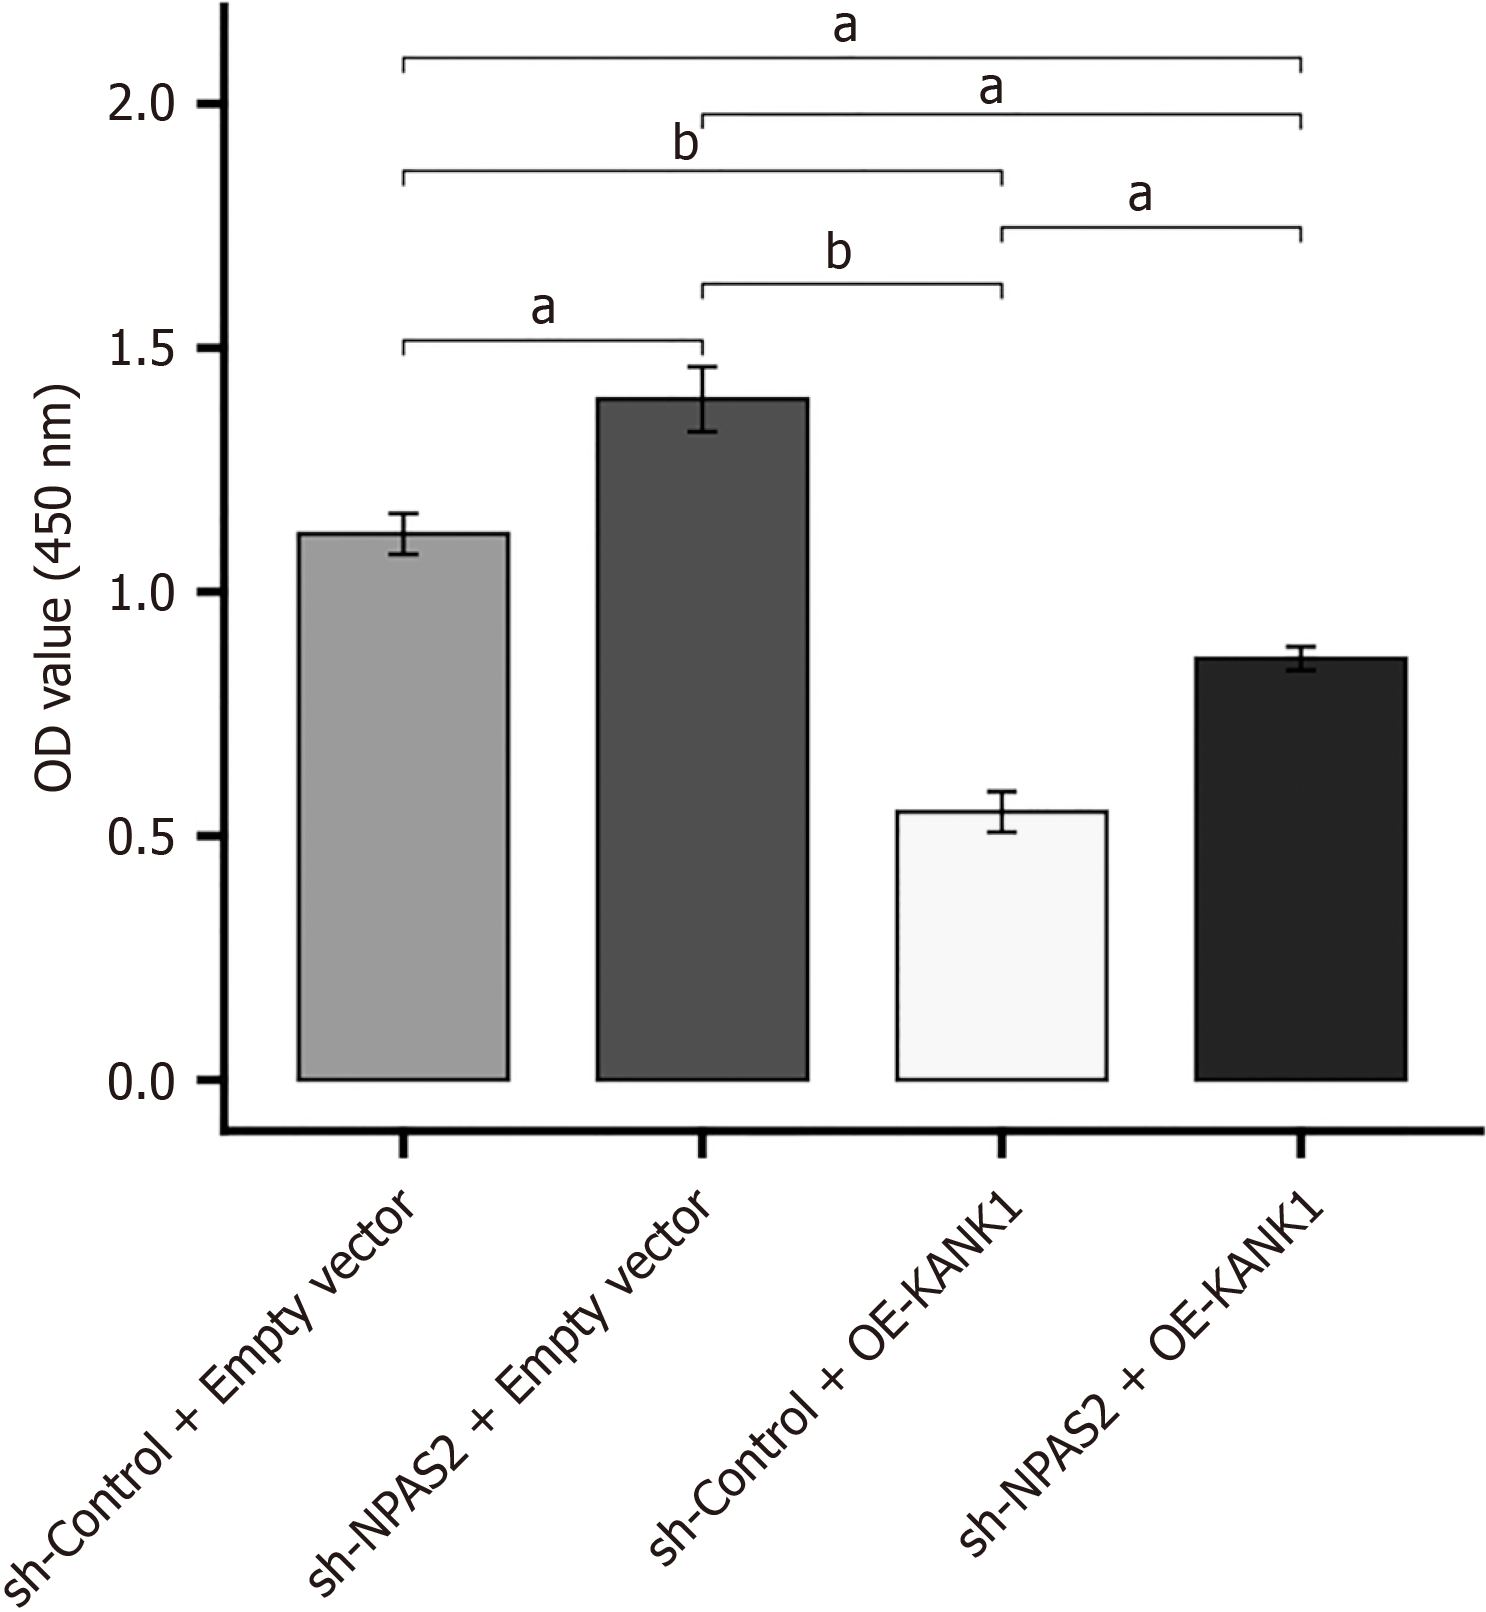
Figure 6 NPAS2 deceased β-cell survival by regulating KANK1 expression.
The cell proliferation rate in sh-Control + Empty vector, sh-NPAS2 + Empty vector, sh-Control + OE-KANK1 and sh-NPAS2 + OE-KANK1, MIN6 cell injury model and the Empty vector + sh-Control model by CCK8 test. aP < 0.01, bP < 0.001.
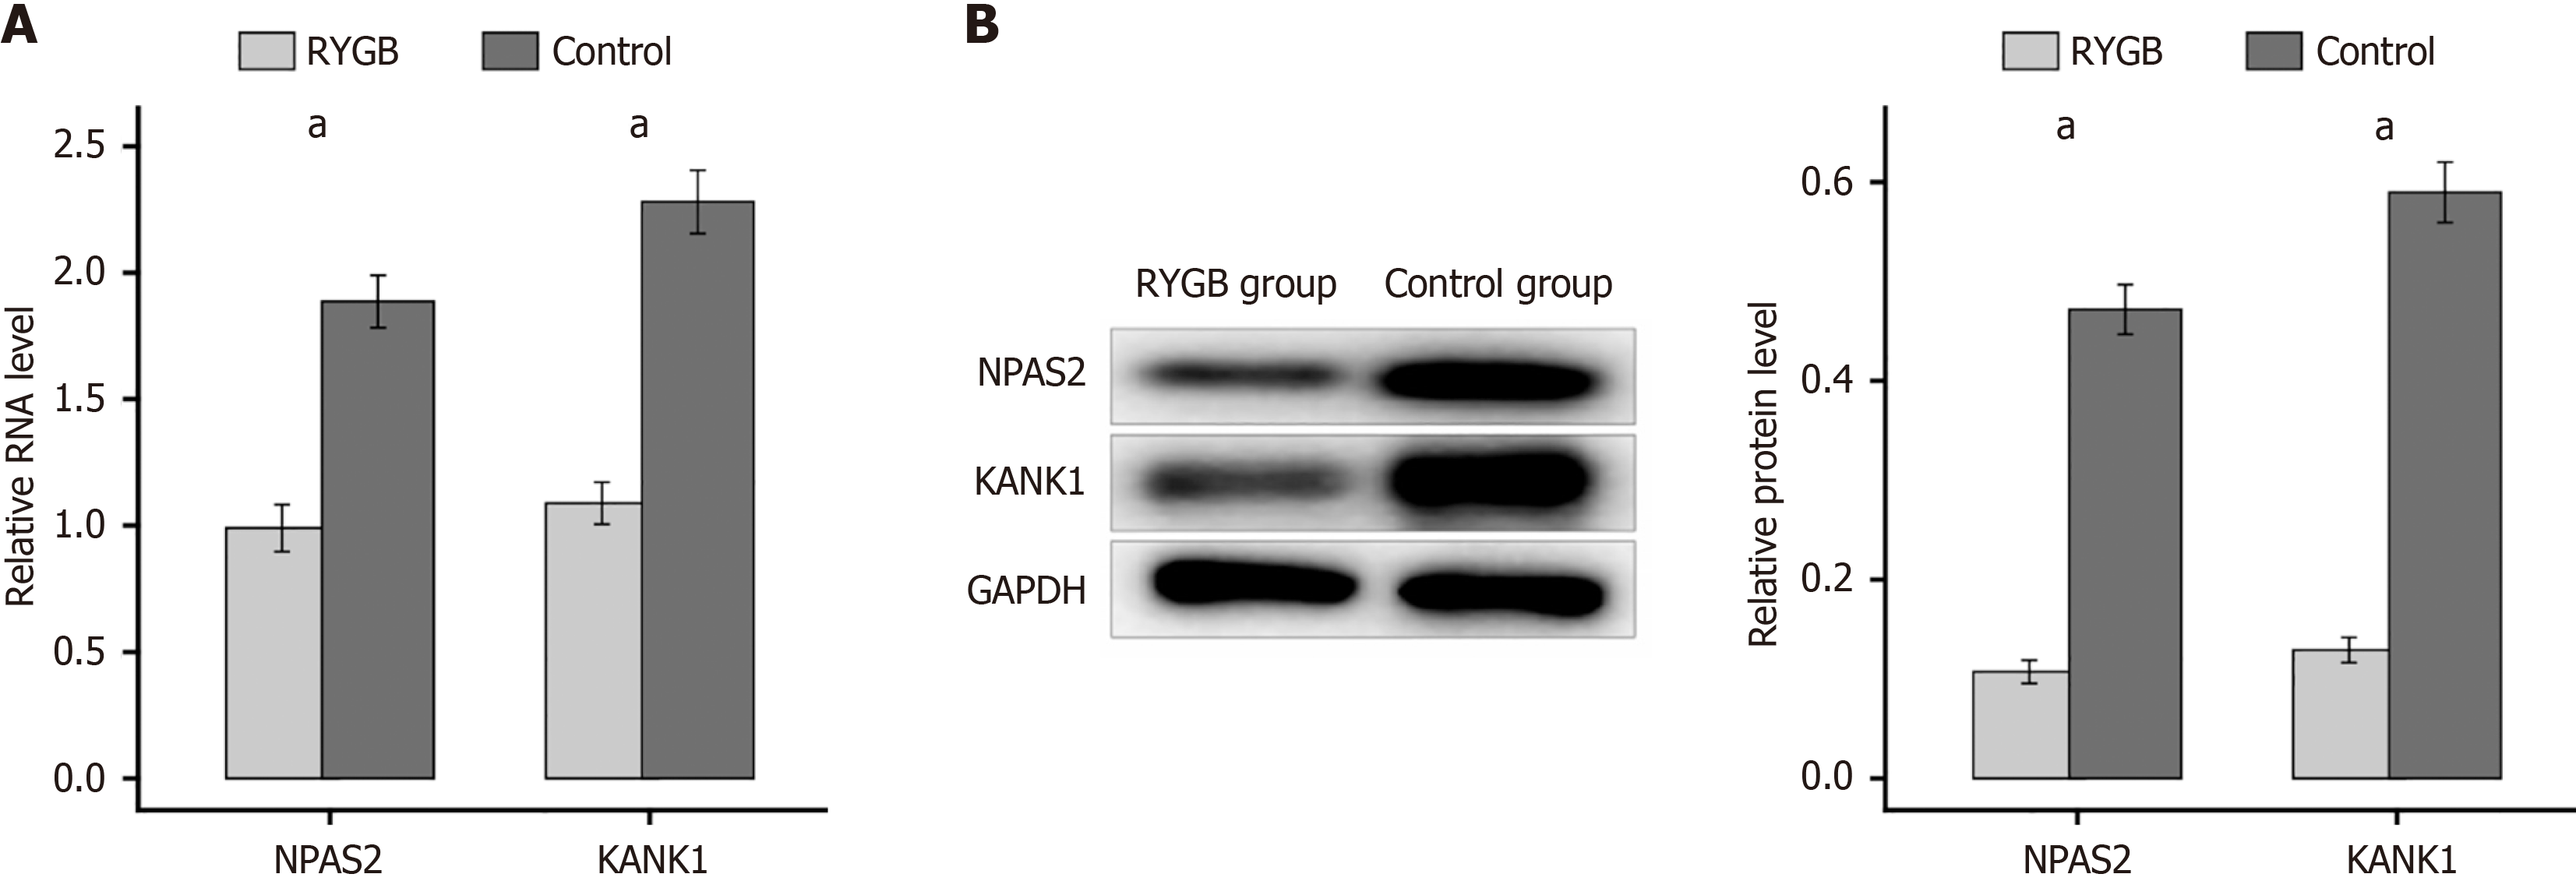
Figure 7 Gastric bypass may treat type 2 diabetes by down-regulating NPAS2 and KANK1.
A: Quantitative reverse transcriptase PCR showed the mRNA content of KANK1 and NPAS2 in the β-cell of mice; B: Western blotting indicated the protein of KANK1 and NPAS2 in the β-cell of mice. aP < 0.0001.
- Citation: Yin YB, Ji W, Liu YL, Gao QH, He DD, Xu SL, Fan JX, Zhang LH. cNPAS2 induced β cell dysfunction by regulating KANK1 expression in type 2 diabetes. World J Diabetes 2024; 15(9): 1932-1941
- URL: https://www.wjgnet.com/1948-9358/full/v15/i9/1932.htm
- DOI: https://dx.doi.org/10.4239/wjd.v15.i9.1932


