Copyright
©The Author(s) 2024.
World J Diabetes. Aug 15, 2024; 15(8): 1734-1741
Published online Aug 15, 2024. doi: 10.4239/wjd.v15.i8.1734
Published online Aug 15, 2024. doi: 10.4239/wjd.v15.i8.1734
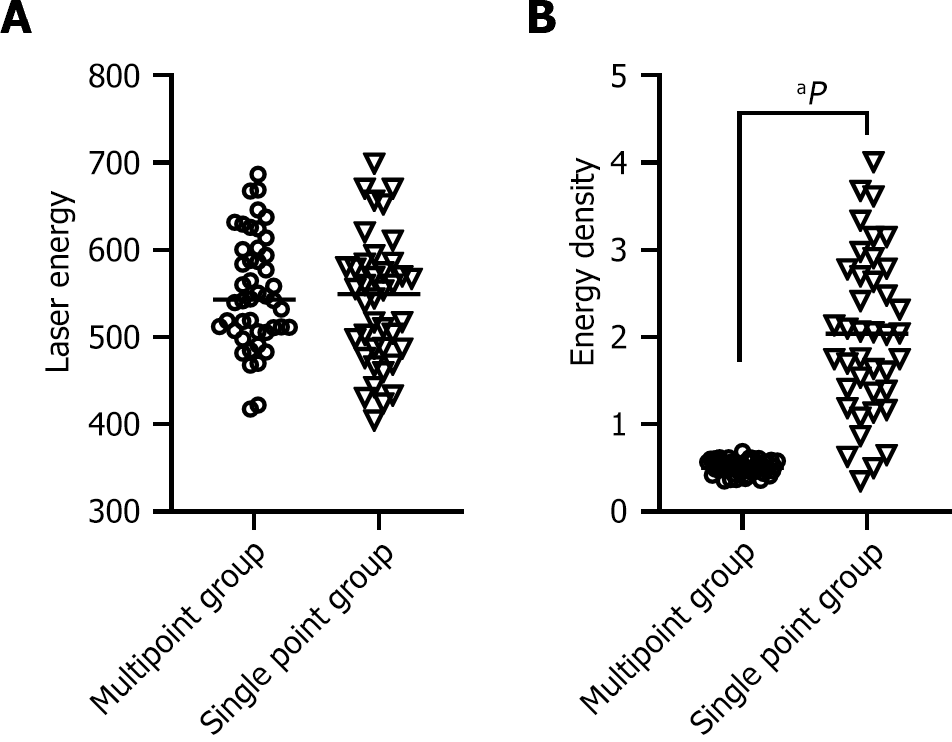
Figure 1 The laser energy in the multipoint group and single point group.
A: The difference of laser energy between multi-point group and single-point group was not statistically significant (P > 0.05); B: The energy density of multi-point group was lower than that of single-point group, and the difference was statistically significant (P < 0.05). aP < 0.05.
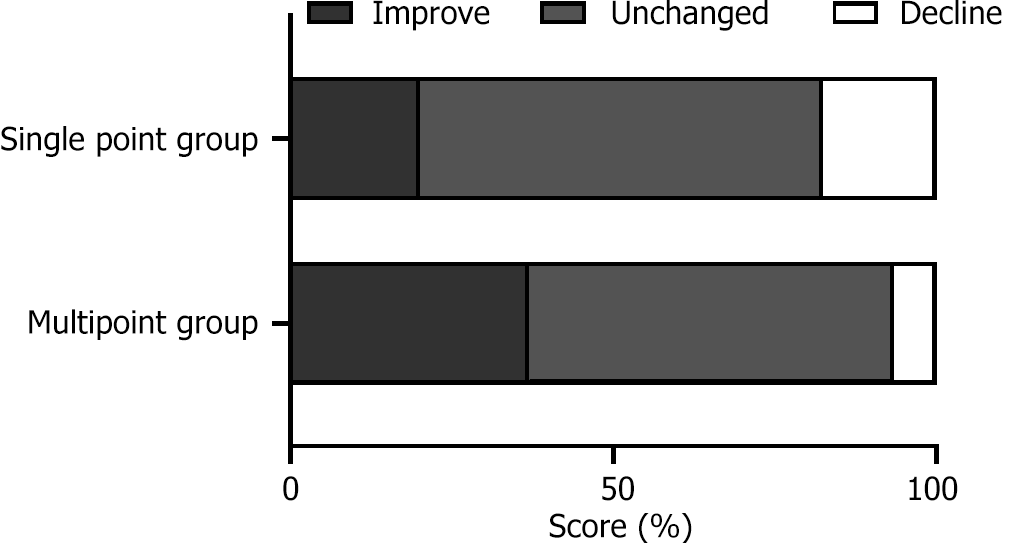
Figure 2 Distinction in therapy effectiveness.
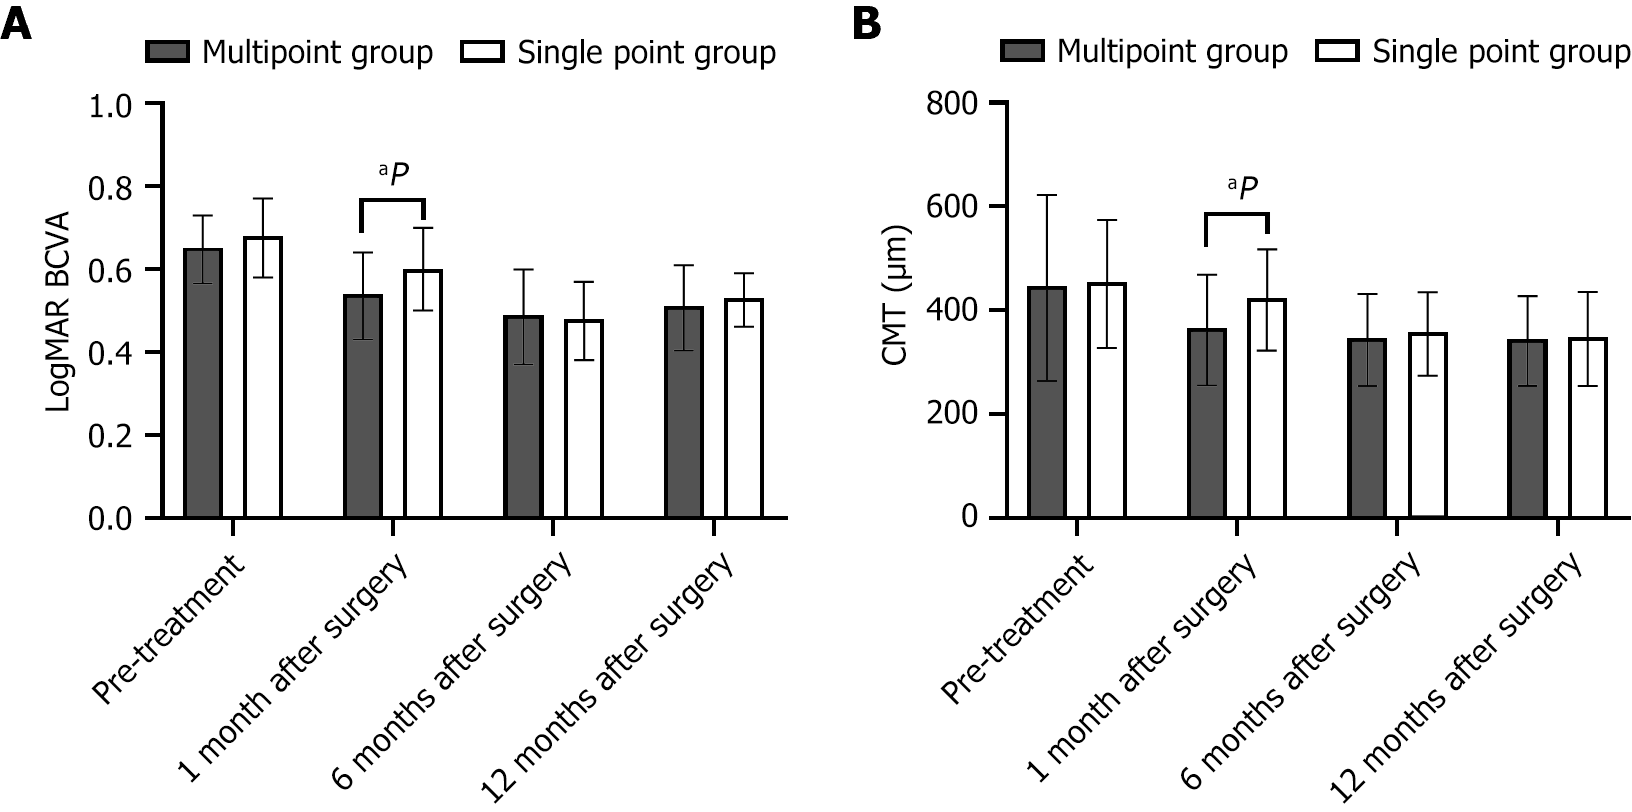
Figure 3 Comparison of LogMAR best-corrected visual acuity between the two groups before and after treatment.
A: LogMAR best-corrected visual acuity; B: Central macular thickness. There was no significant difference between the multi-point group and the single-point group before treatment (P > 0.05), and the multi-point group was lower than the single-point group 1 month after treatment (P < 0.05), and there was no significant difference between the multi-point group and the single-point group 6 months and 12 months after treatment (P > 0.05). aP < 0.05. CMT: Central macular thickness.
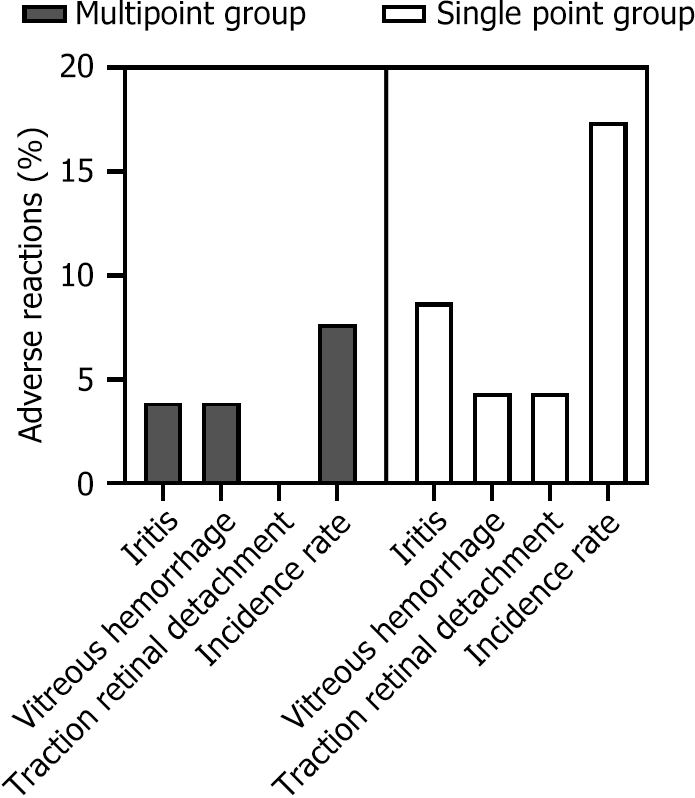
Figure 4 Comparison of adverse reaction rates.
- Citation: Zhang YZ, Gong H, Yang J, Bu JP, Yang HL. Efficacy comparison of multipoint and single point scanning panretinal laser photocoagulation in non-proliferative diabetic retinopathy treatment. World J Diabetes 2024; 15(8): 1734-1741
- URL: https://www.wjgnet.com/1948-9358/full/v15/i8/1734.htm
- DOI: https://dx.doi.org/10.4239/wjd.v15.i8.1734


