Copyright
©The Author(s) 2024.
World J Diabetes. Jun 15, 2024; 15(6): 1340-1352
Published online Jun 15, 2024. doi: 10.4239/wjd.v15.i6.1340
Published online Jun 15, 2024. doi: 10.4239/wjd.v15.i6.1340
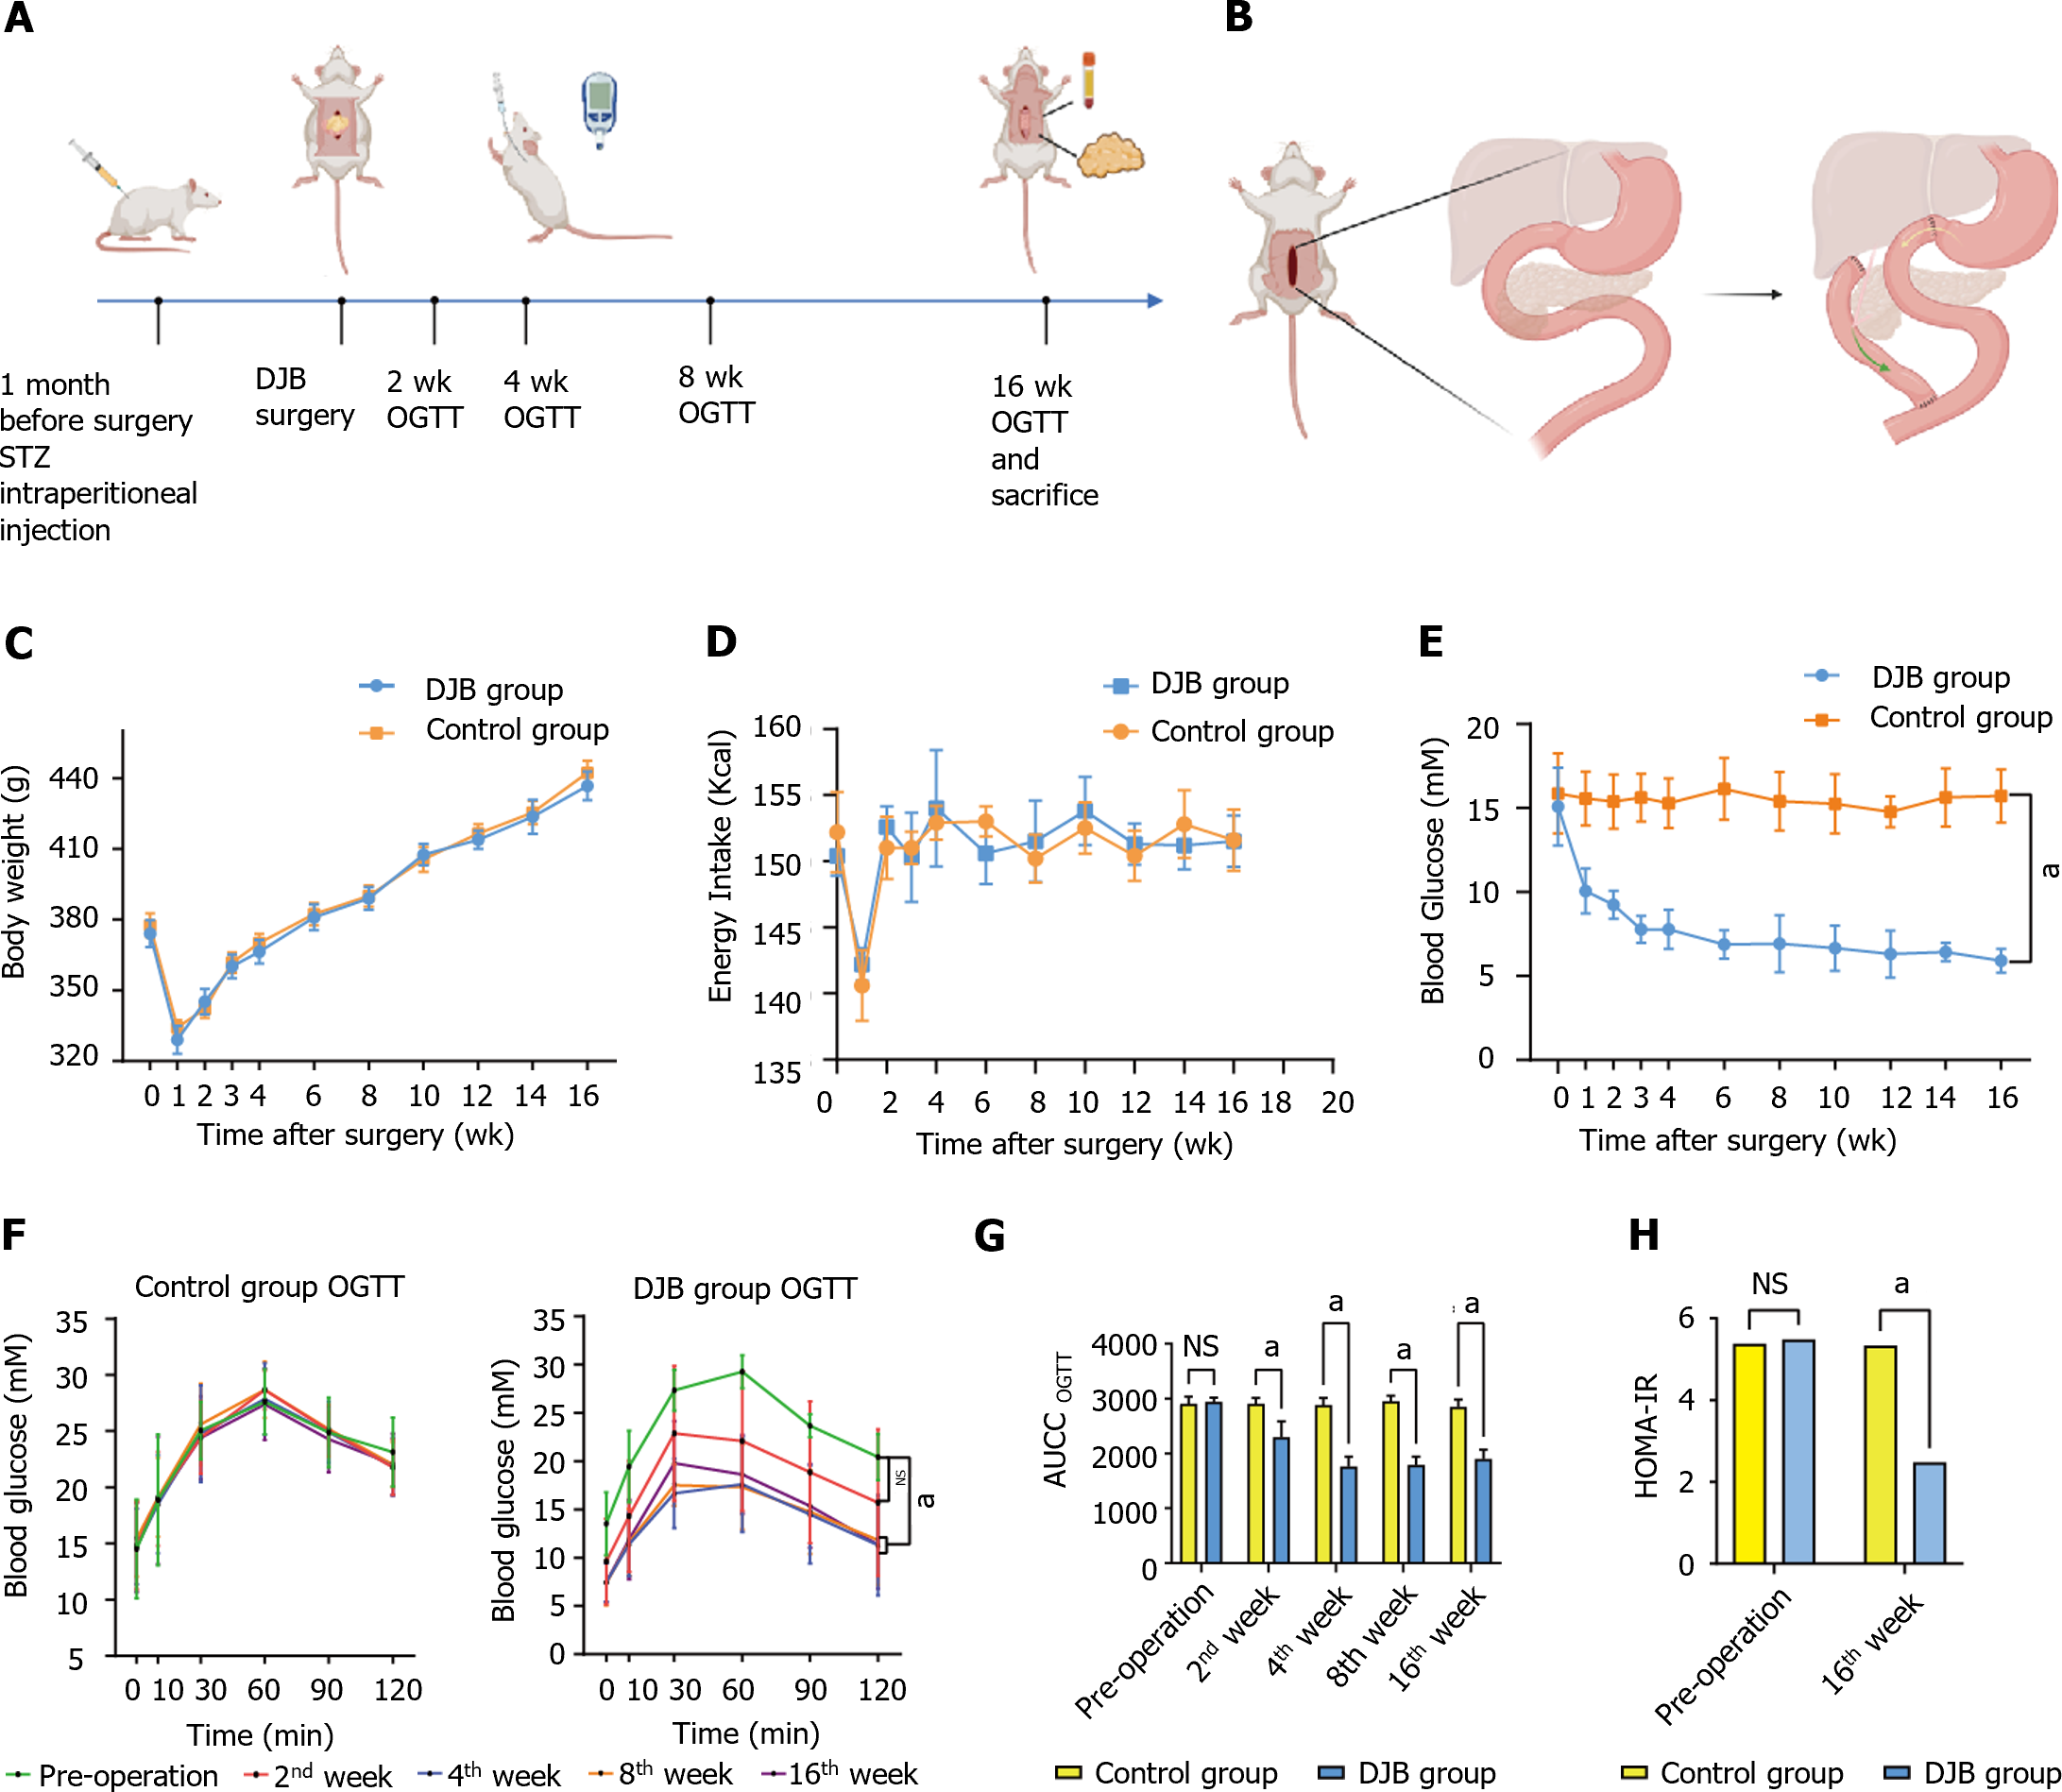
Figure 1 Body weight, energy intake and glucose metabolism of duodenal-jejunal bypass and control groups.
A: Schematic timeline of experiment; B: Schematic of duodenal-jejunal bypass (DJB) surgery; C: Body weight; D: Energy intake; E: Fasting blood glucose; F: Oral glucose tolerance test (OGTT) of DJB and control group; G: Area under curve for OGTT; H: Homeostasis model of assessment for insulin resistance of DJB and control group. Control vs DJB, aP < 0.001 or ns = not significant. STZ: Streptozotocin; OGTT: Oral glucose tolerance test; DJB: Duodenal-jejunal bypass; HOMA-IR: Homeostasis model of assessment for insulin resistance; AUC: Area under curve.
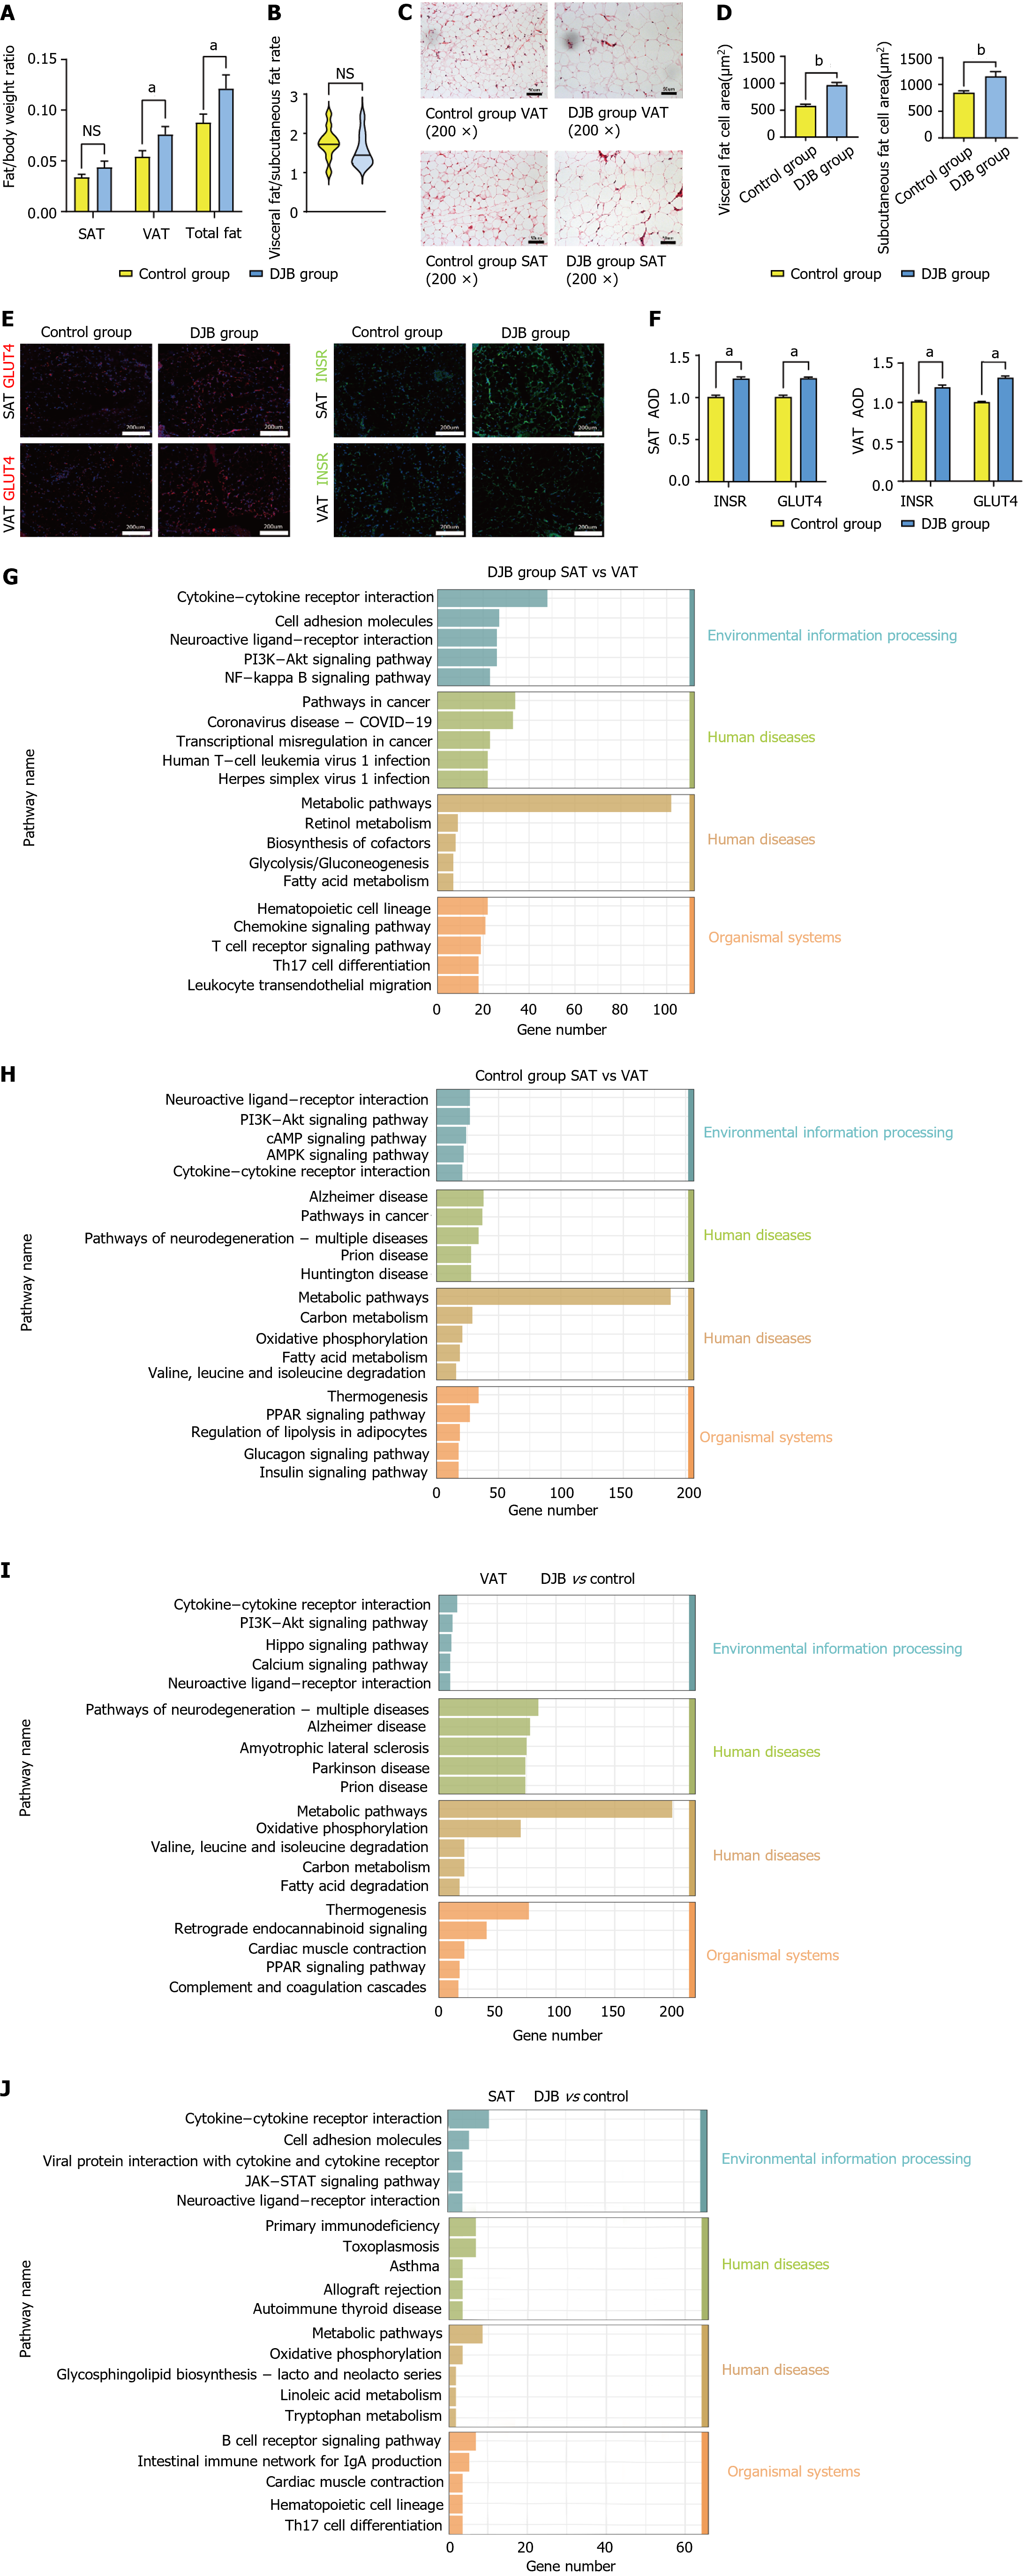
Figure 2 Morphological and transcriptomic evaluation of adipose tissue.
A: Fat/body weight ratio; B: Visceral adipose tissue (VAT)/subcutaneous adipose tissue (SAT) in control and duodenal-jejunal bypass (DJB) group; C: Morphological evaluation of VAT and SAT in control and DJB group; D: Adipocyte area of VAT and SAT; E: Immunofluorescent staining of GLUT4 and INSR; F: Average optical density of the Immunofluorescent staining; G and H: KEGG enrichment analysis between SAT and VAT in DJB group (G) and control group (H); I and J: KEGG enrichment analysis between DJB and control group in VAT (I) and SAT (J). Control vs DJB, aP < 0.05, bP < 0.001 or ns = not significant. DJB: Duodenal-jejunal bypass; SAT: Subcutaneous adipose tissue; VAT: Visceral adipose tissue; AOD: Average optical density.
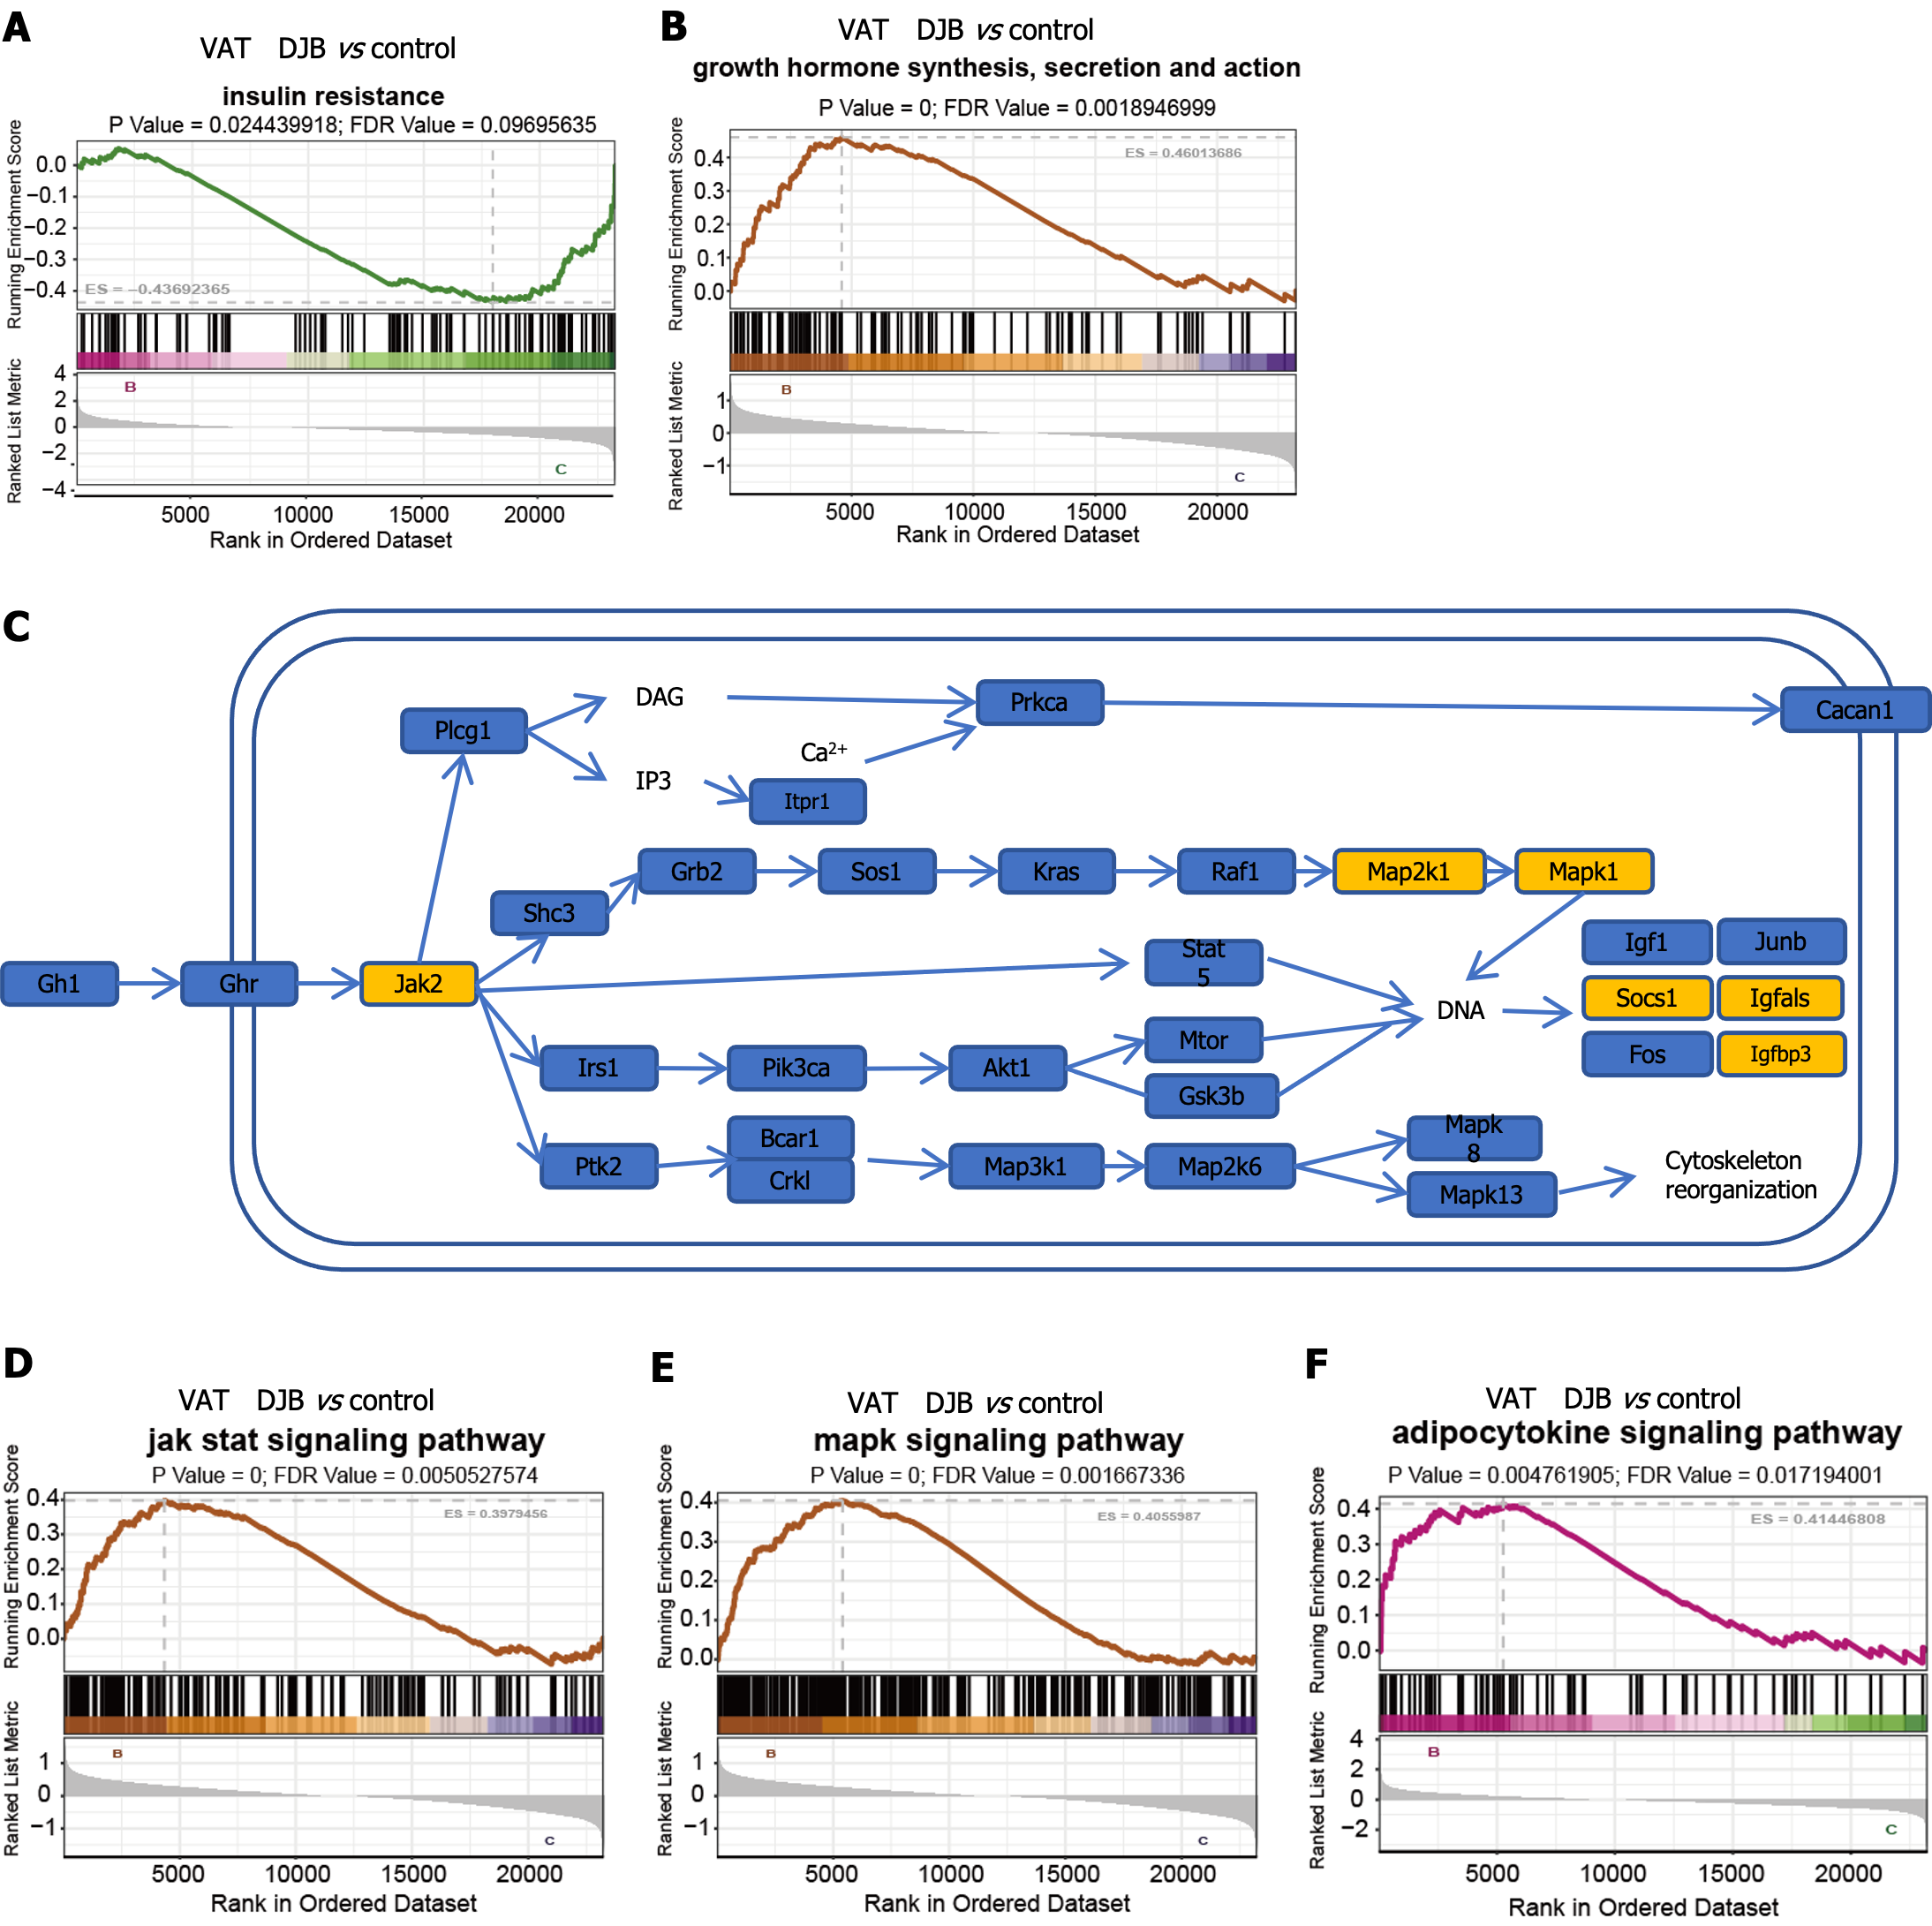
Figure 3 Gene set enrichment analysis analysis in visceral adipose tissue between control group and duodenal-jejunal bypass group.
A and B: Gene set enrichment analysis (GSEA) analysis of insulin resistance (A) and growth hormone (B) action; C: KEGG map of growth hormone action in adipocytes; D-F: GSEA analysis of JAK-STAT signaling pathway (D), MAPK signaling pathway (E), and adipocytokine signaling pathway (F). DJB vs control group. DJB: Duodenal-jejunal bypass; SAT: Subcutaneous adipose tissue; VAT: Visceral adipose tissue.
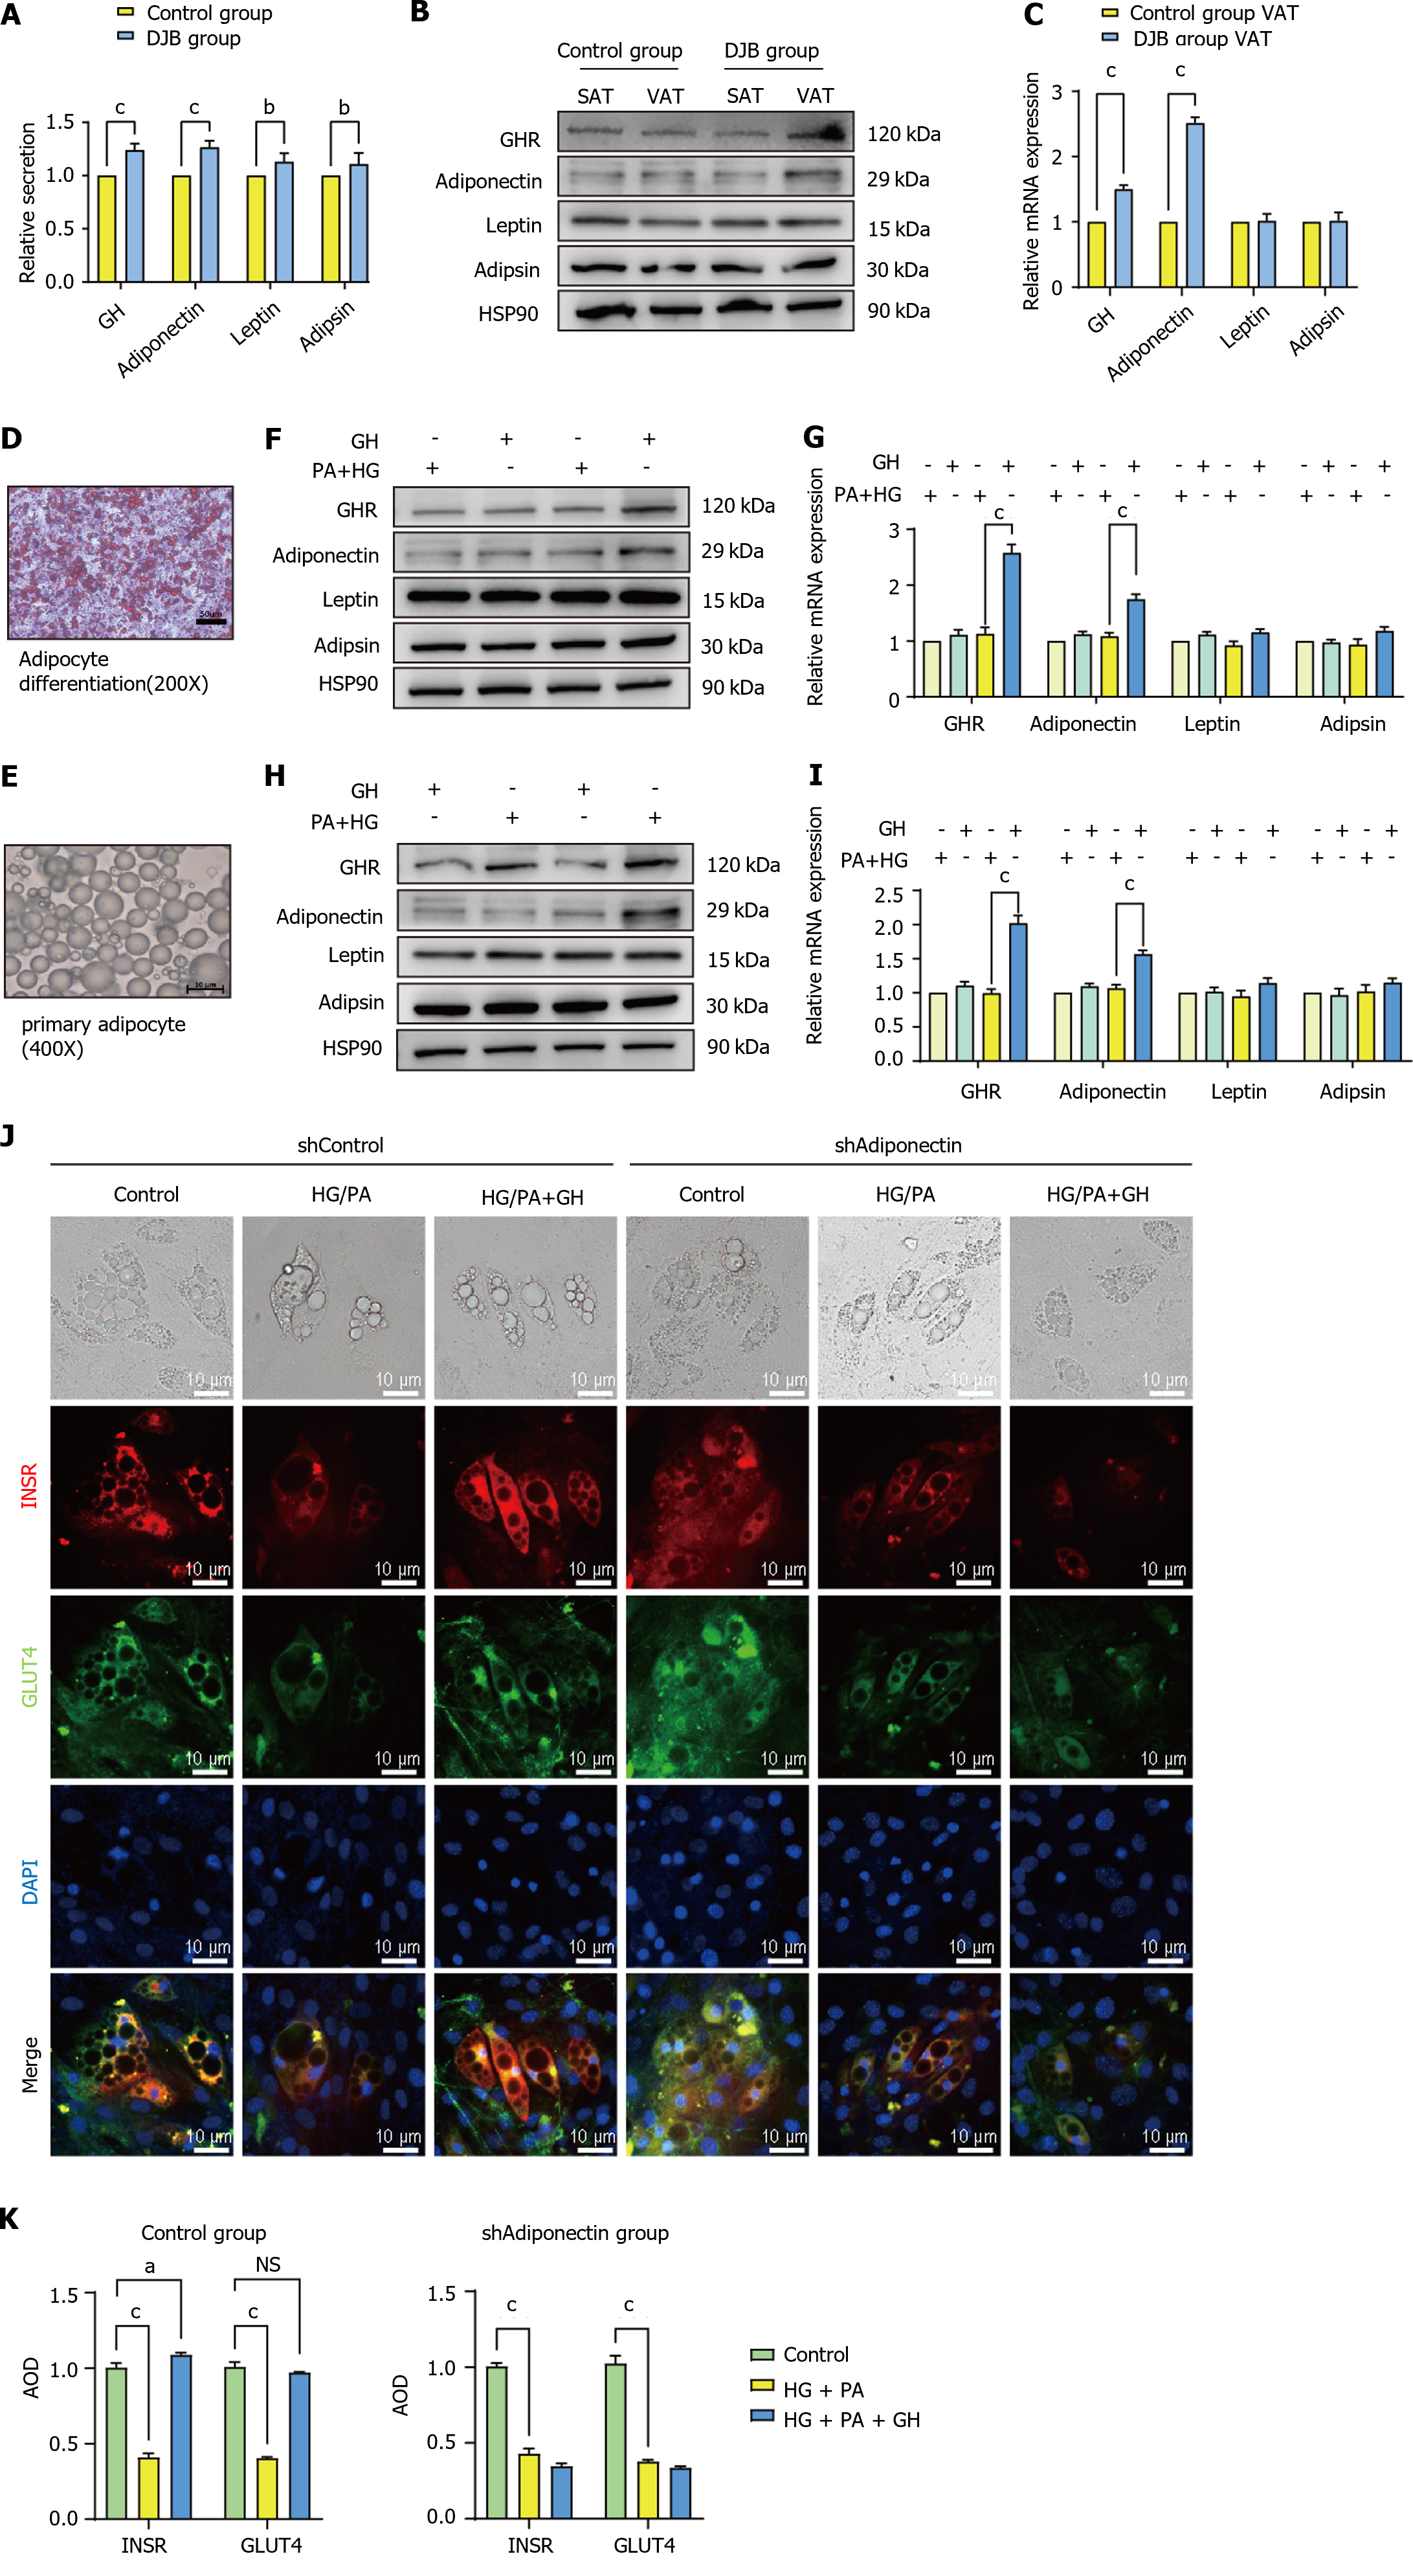
Figure 4 The functions of growth hormone and adipocytokine after duodenal-jejunal bypass.
A: Serum concentrations of growth hormone (GH), adiponectin, leptin and adipsin; B and C: Western blot (B) and reverse transcription-qPCR (RT-qPCR; C) analysis of GH receptor (GHR), adiponectin, leptin and adipsin in visceral adipose tissue; D: Oil red O staining of mature adipocytes; E: Phase microscope of primary visceral adipocyte; F and G: Western blot (F) and RT-qPCR (G) analysis of GHR, adiponectin, leptin and adipsin in mature adipocytes; H and I: Western blot (H) and RT-qPCR (I) analysis of GHR, adiponectin, leptin and adipsin in primary visceral adipocyte; J: Immunofluorescent staining of GLUT4 and INSR of mature adipocytes with or without Adiponectin knockdown; K: Average optical density of Immunofluorescent staining. aP < 0.05, bP < 0.01, cP < 0.001. GH: Growth hormone; GHR: Growth hormone receptor; PA: Palmitic acid; HG: High glucose; DJB: Duodenal-jejunal bypass; SAT: Subcutaneous adipose tissue; VAT: Visceral adipose tissue; AOD: Average optical density.
- Citation: Liu ZT, Yang GW, Zhao X, Dong SH, Jiao Y, Ge Z, Yu A, Zhang XQ, Xu XZ, Cheng ZQ, Zhang X, Wang KX. Growth hormone improves insulin resistance in visceral adipose tissue after duodenal-jejunal bypass by regulating adiponectin secretion. World J Diabetes 2024; 15(6): 1340-1352
- URL: https://www.wjgnet.com/1948-9358/full/v15/i6/1340.htm
- DOI: https://dx.doi.org/10.4239/wjd.v15.i6.1340


