Copyright
©The Author(s) 2024.
World J Diabetes. Apr 15, 2024; 15(4): 783-792
Published online Apr 15, 2024. doi: 10.4239/wjd.v15.i4.783
Published online Apr 15, 2024. doi: 10.4239/wjd.v15.i4.783
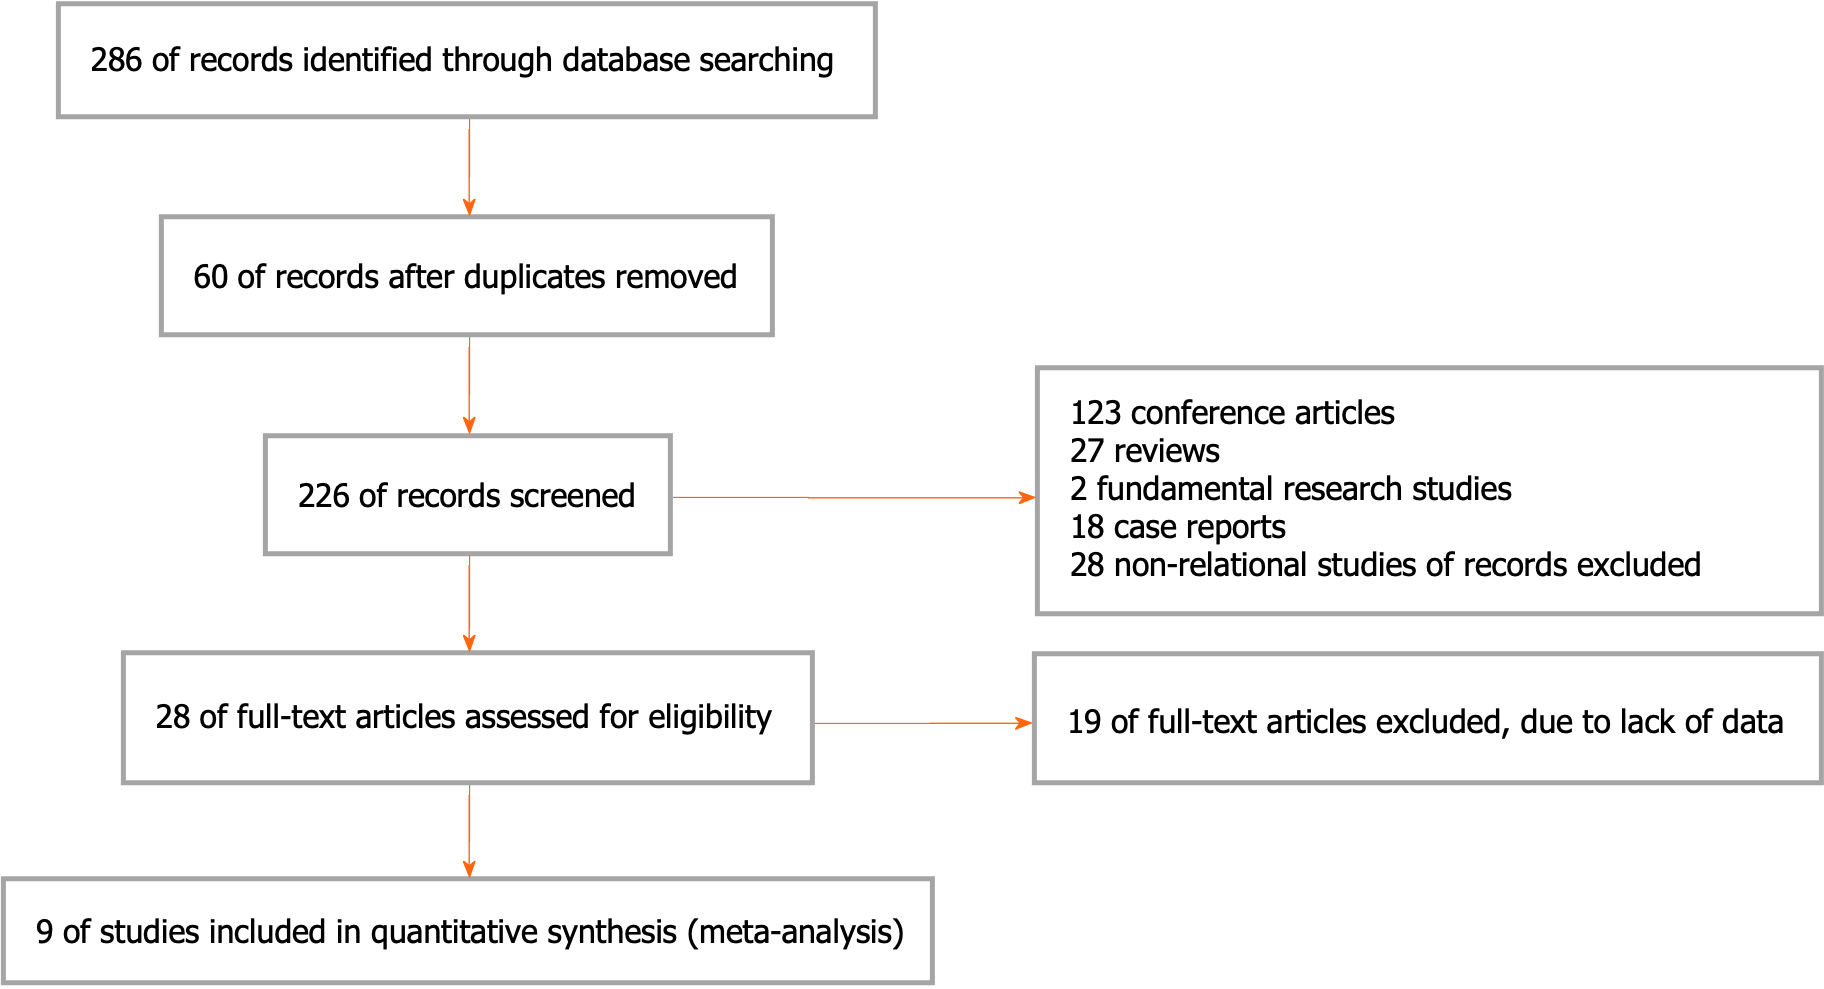
Figure 1 Study selection procedure.
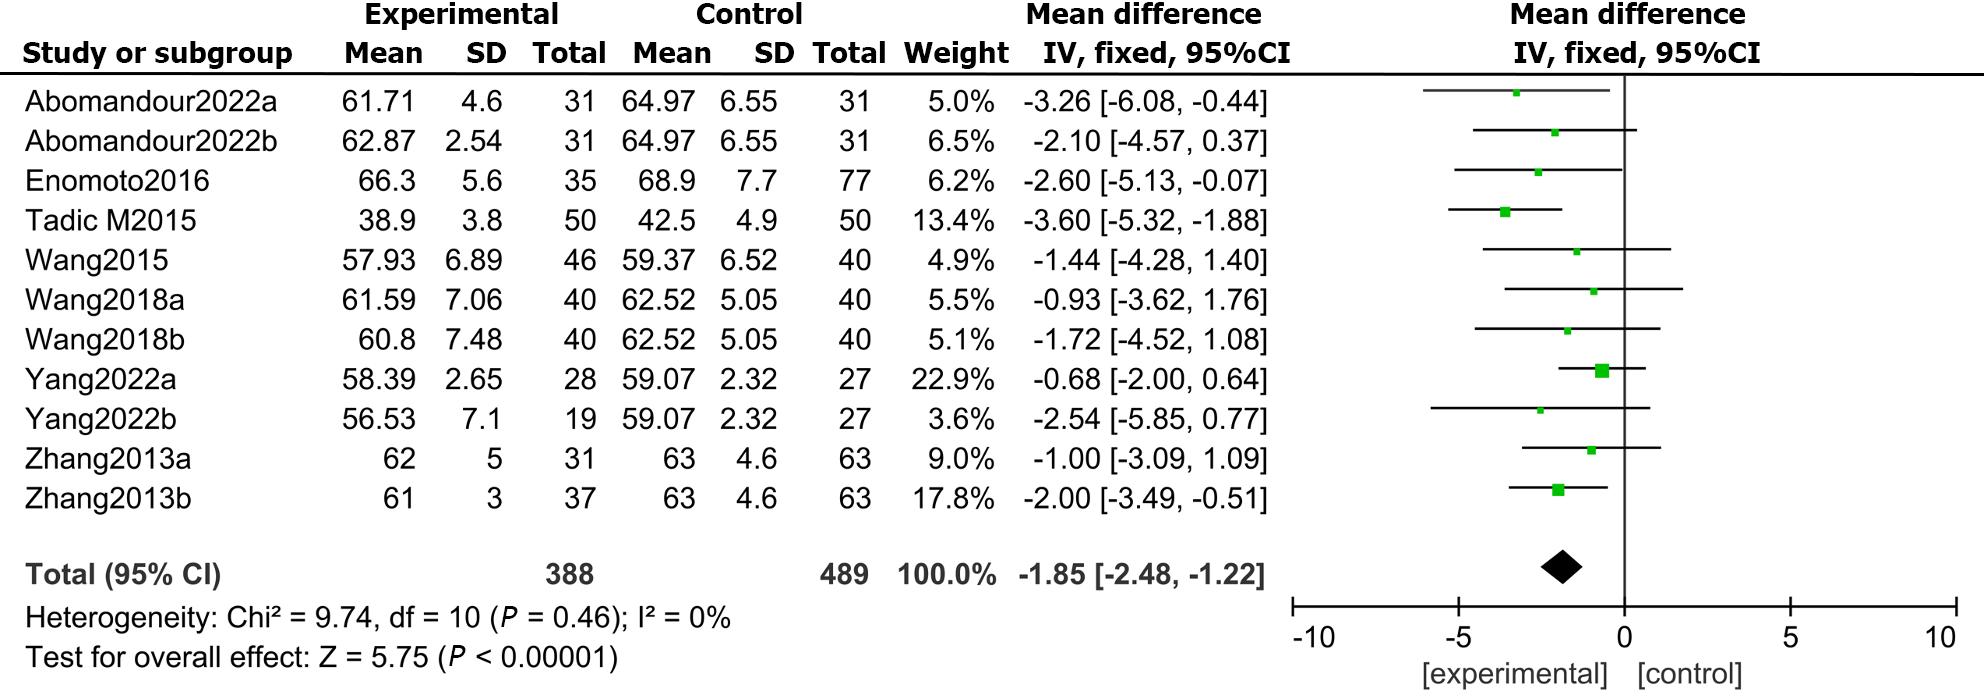
Figure 2 Forest plot showing the comparison of the left ventricular myocardial contractile function between diabetes mellitus and controls based on left ventricular ejection fraction.
95%CI: 95% confidence interval.
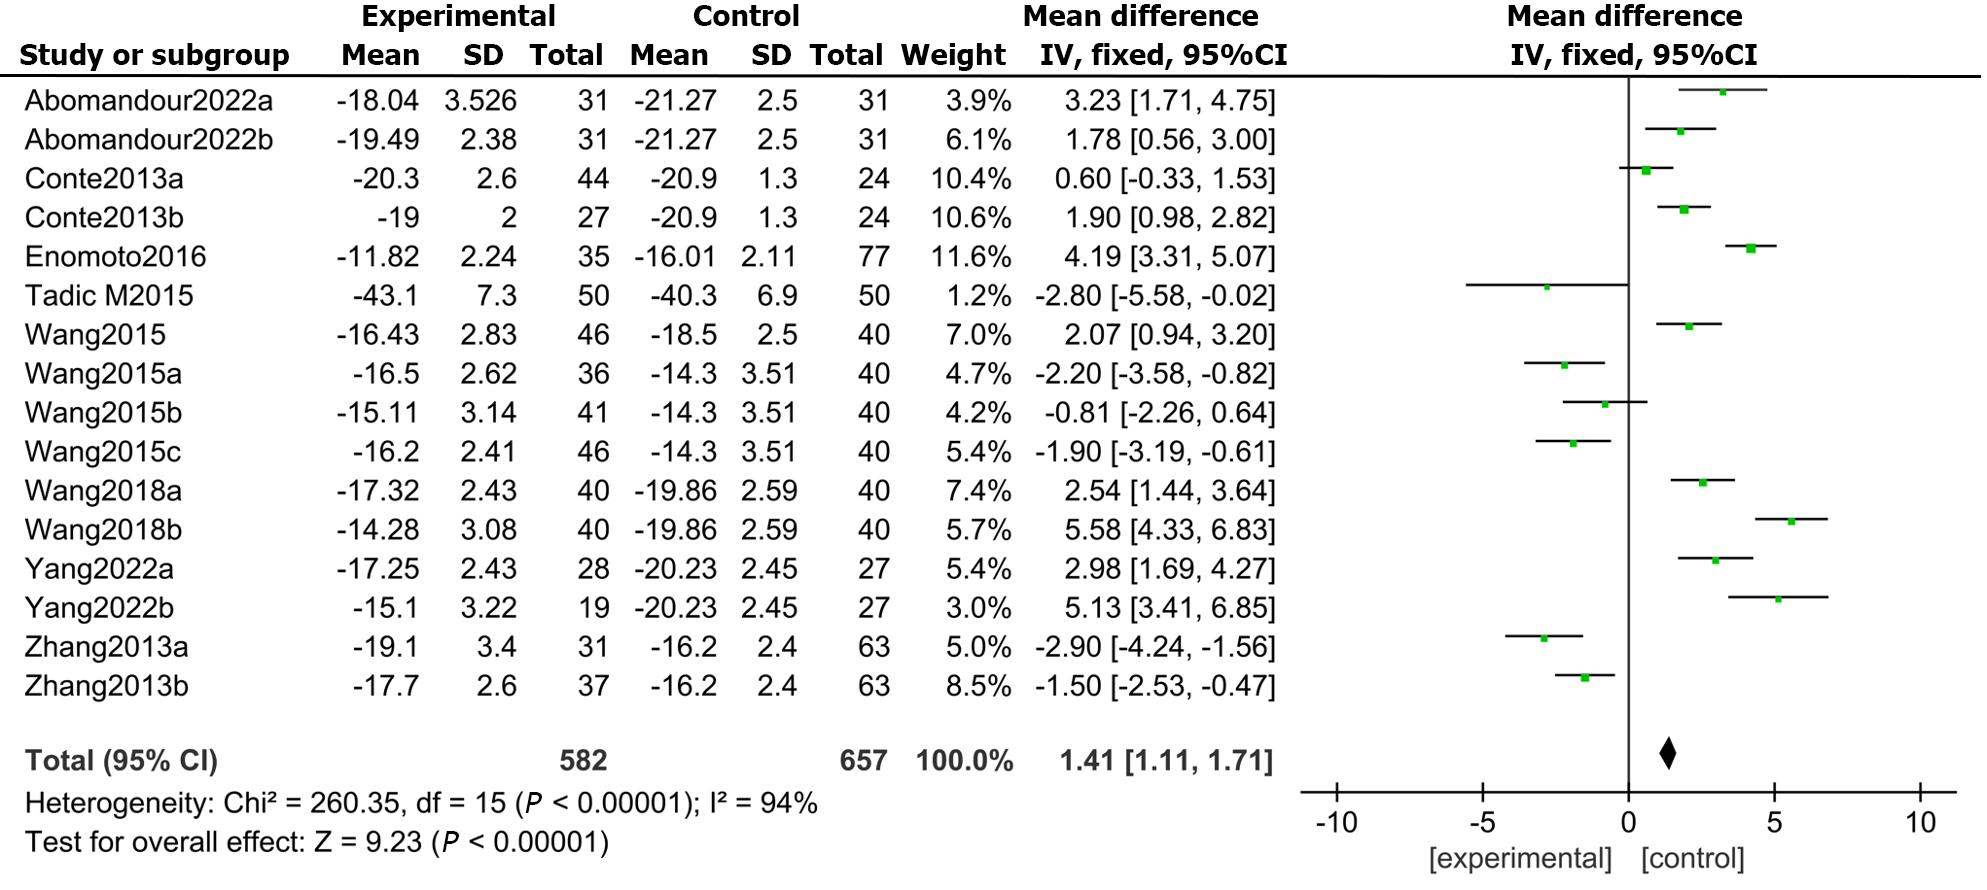
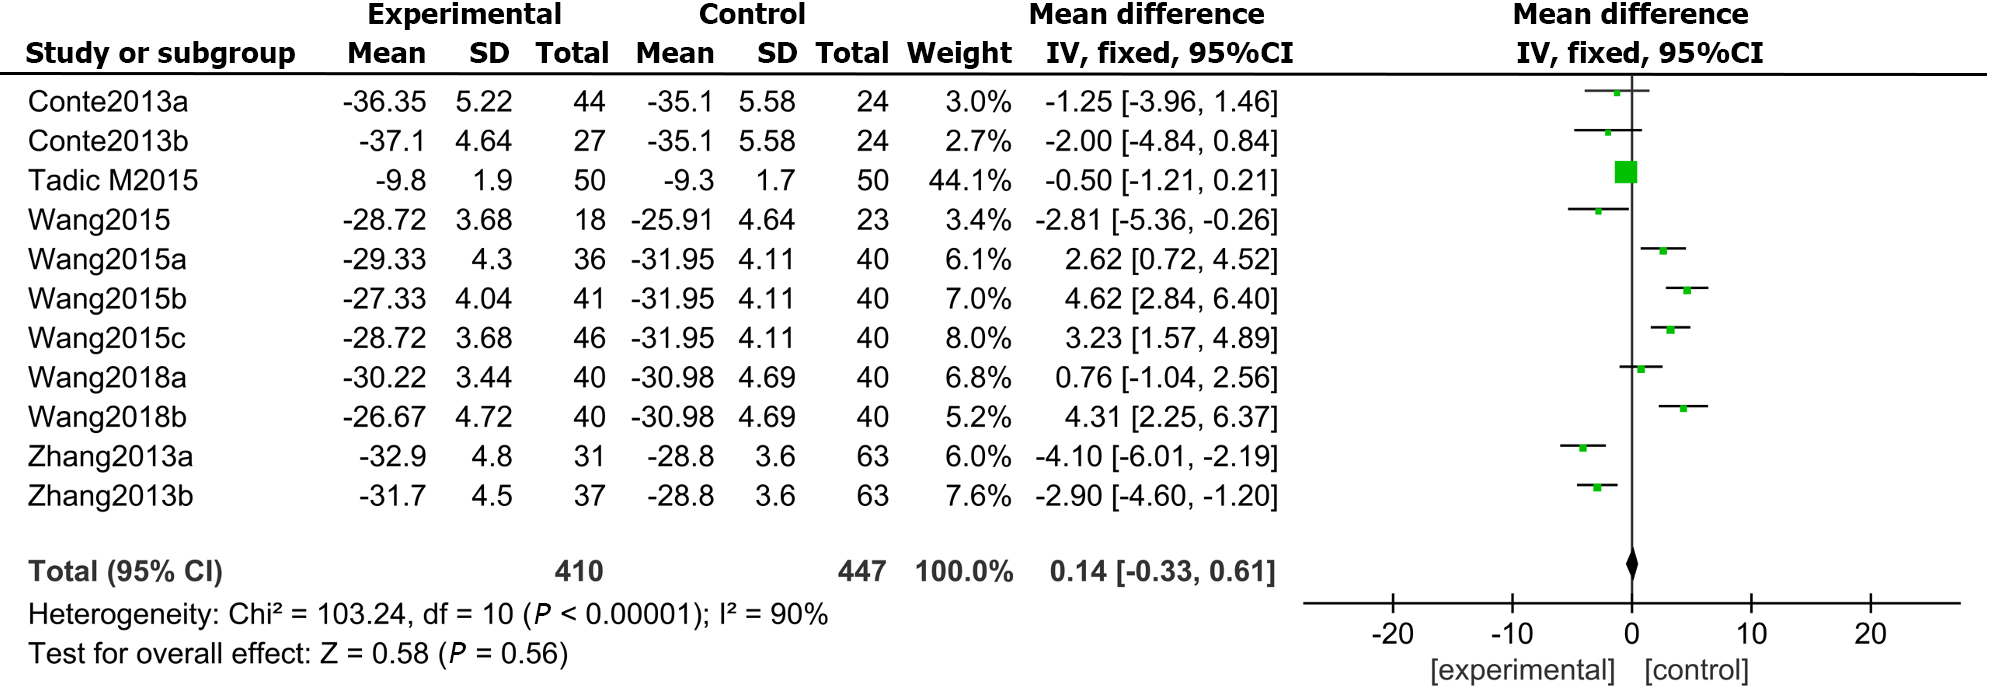
Figure 3 Forest plot showing the comparison of the left ventricular myocardial contractile function between diabetes mellitus and controls based on global longitudinal strain.
95%CI: 95% confidence interval.
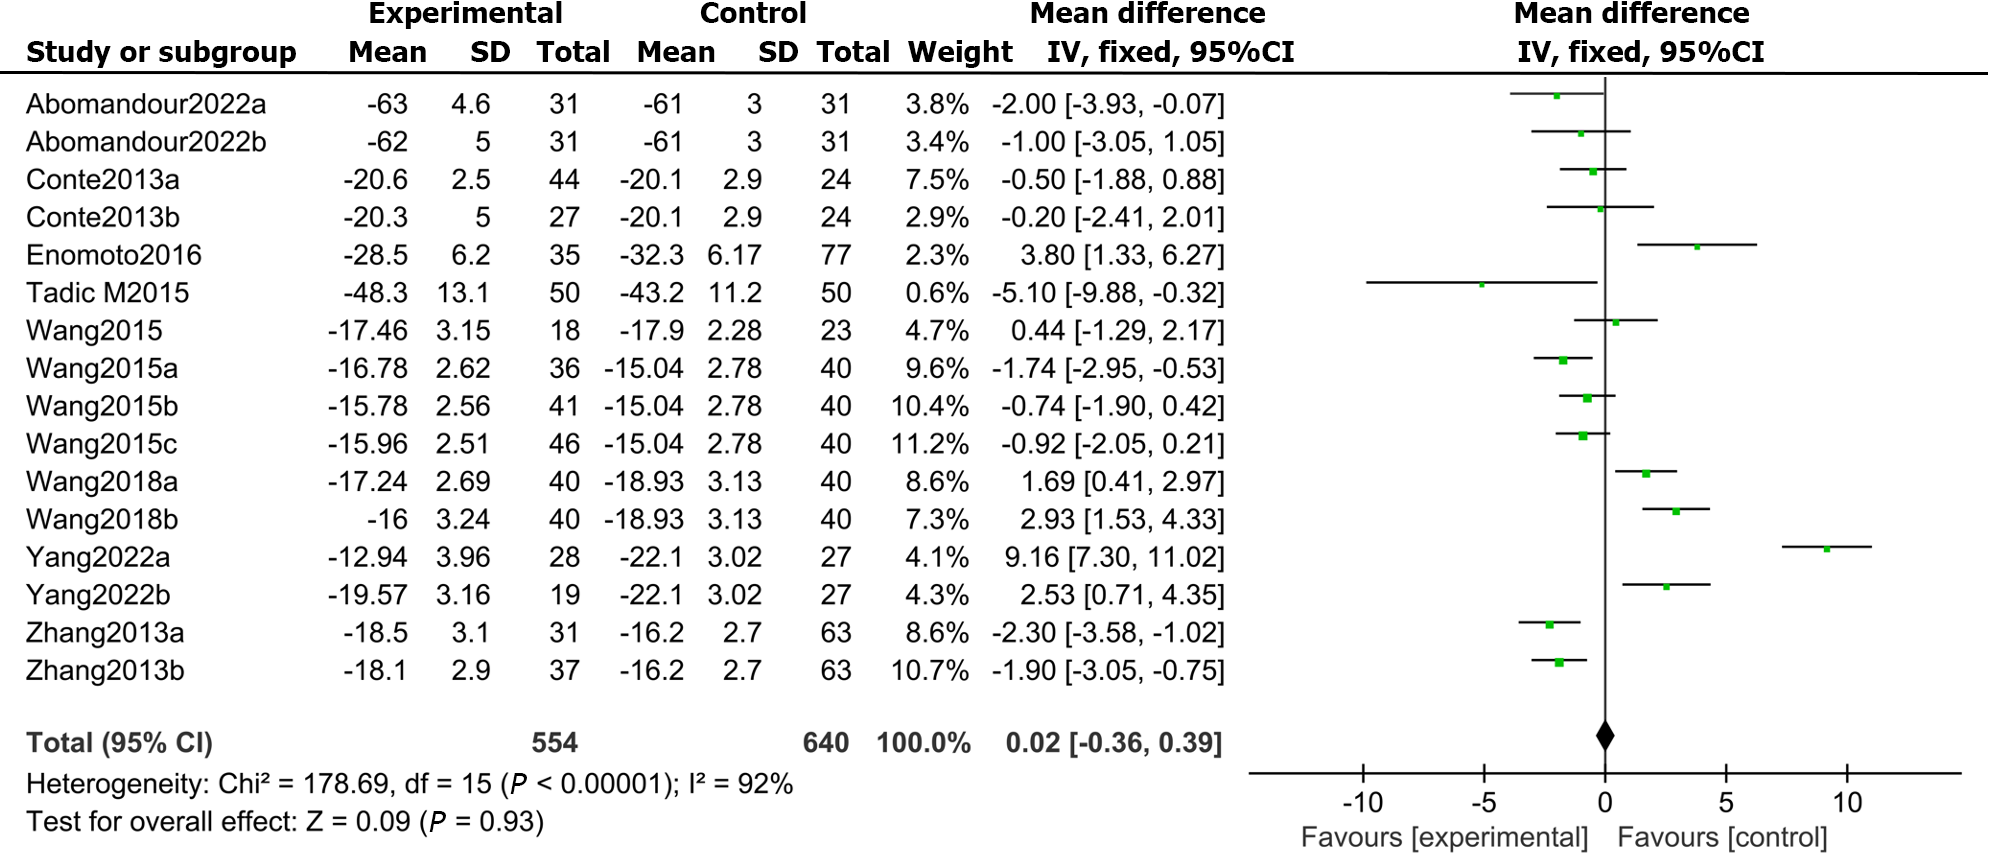
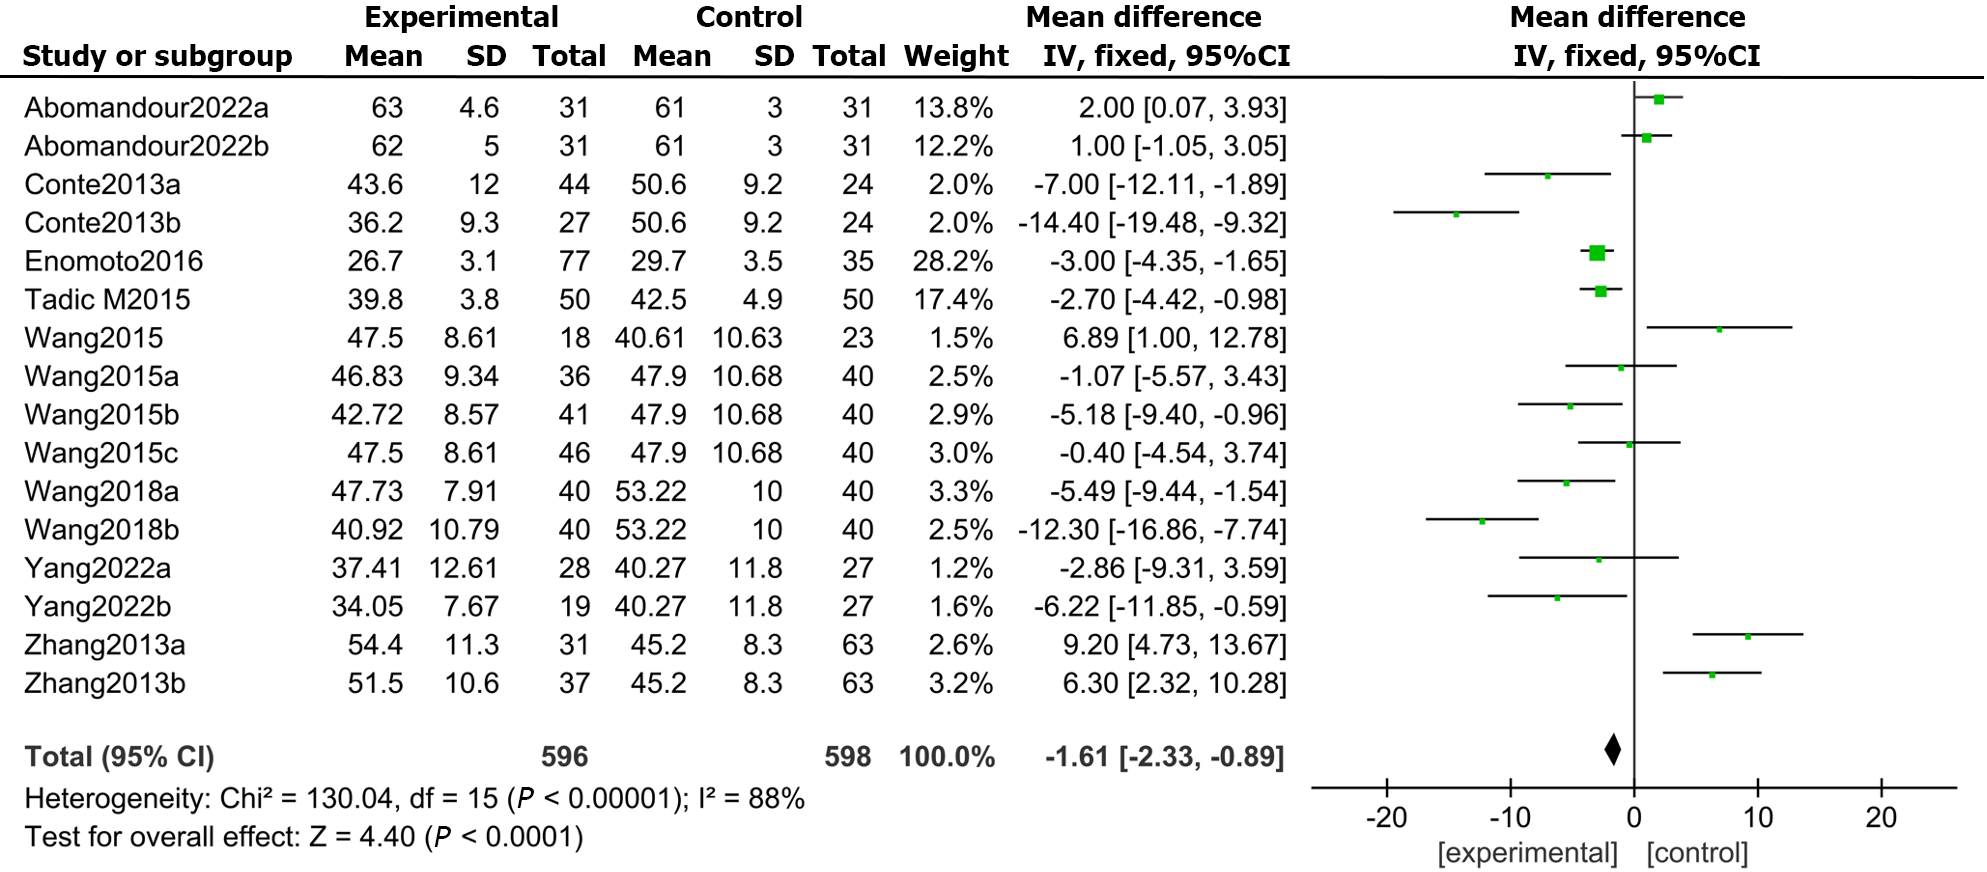
Figure 4 Forest plot comparing the left ventricular myocardial contractile function between diabetes mellitus and controls based on the global circumferential strain score.
95%CI: 95% confidence interval.
Figure 5 Forest plot showing the comparison of left ventricular myocardial contractile function between diabetes mellitus and controls based on global radial strain.
95%CI: 95% confidence interval.
Figure 6 Forest plot showing the comparison of left ventricular myocardial contractile function between diabetes mellitus and controls based on global area strain.
95%CI: 95% confidence interval.
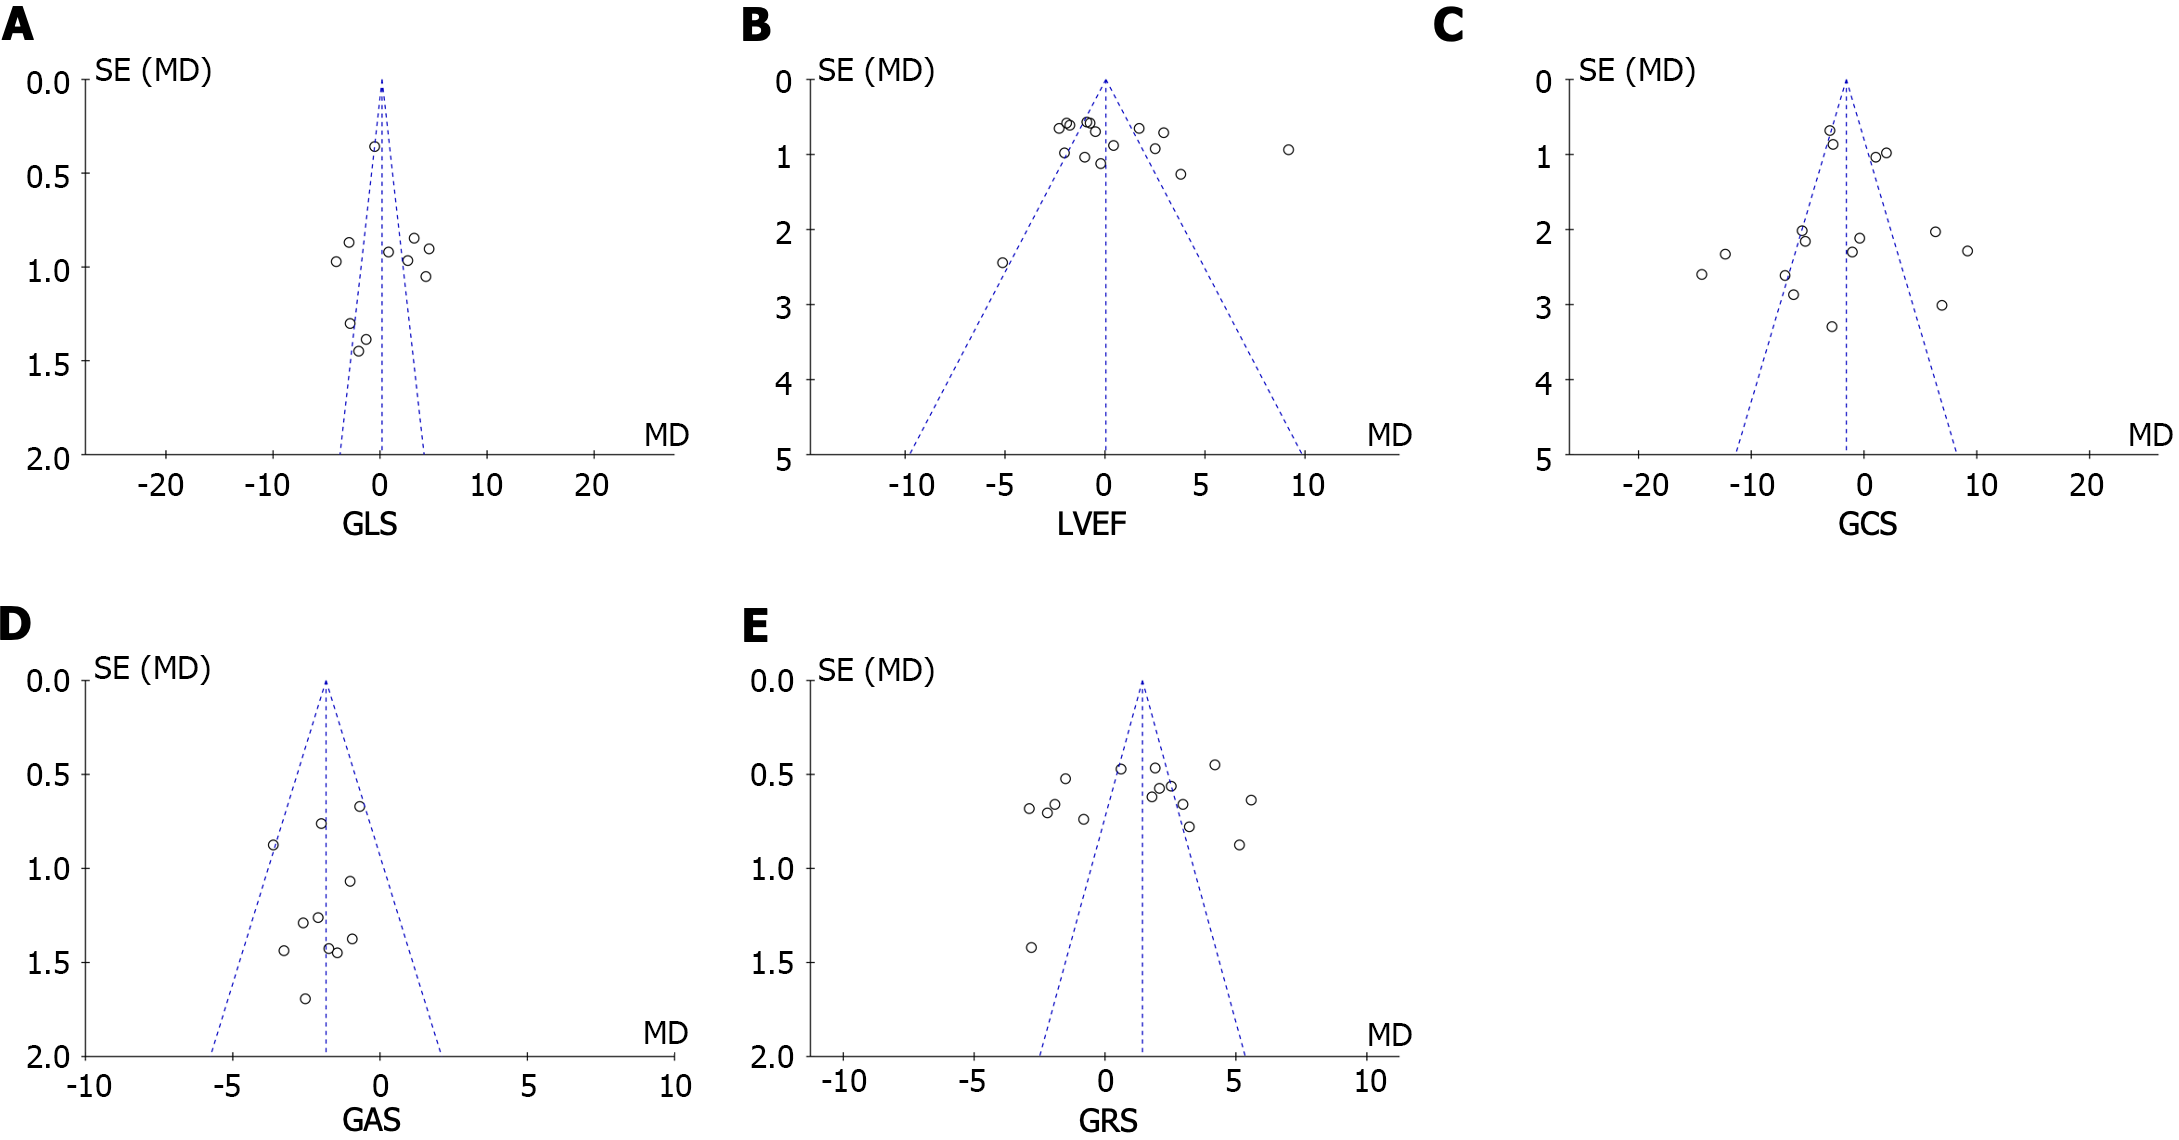
Figure 7 Risk of bias assessment for global longitudinal strain, left ventricular ejection fraction, global circumferential strain, global area strain, and global radial strain.
A: Global longitudinal strain; B: Left ventricular ejection fraction; C: Global circumferential strain; D: Global area strain; E: Global radial strain. GLS: Global longitudinal strain; LEVF: Left ventricular ejection fraction; GCS: Global area strain; GAS: Global area strain; GRS: Global radial strain.
- Citation: Li Z, Qian Y, Fan CY, Huang Y. Application of three-dimensional speckle tracking technique in measuring left ventricular myocardial function in patients with diabetes. World J Diabetes 2024; 15(4): 783-792
- URL: https://www.wjgnet.com/1948-9358/full/v15/i4/783.htm
- DOI: https://dx.doi.org/10.4239/wjd.v15.i4.783


