Copyright
©The Author(s) 2024.
World J Diabetes. Apr 15, 2024; 15(4): 769-782
Published online Apr 15, 2024. doi: 10.4239/wjd.v15.i4.769
Published online Apr 15, 2024. doi: 10.4239/wjd.v15.i4.769
Figure 1 Icariin promoted bone marrow mesenchymal stem cell proliferation and osteogenic differentiation.
A: Bone marrow mesenchymal stem cell (BMSC) surface markers were detected by flow cytometry; B: Icariin (ICA) chemical structure; C: The effect of ICA on BMSC proliferation was measured by the cell counting kit-8 assay; D: Representative images of the colony-forming unit (CFU) assay to determine the effect of ICA on BMSC proliferation; E: Quantification of the CFU assay; F: Representative images of alkaline phosphatase (ALP) staining (scale bar: 250 μm); G: ALP activity detection; H: Representative images of alizarin red S (ARS) staining (scale bar: 250 μm); I: Semi-quantitative result of ARS staining. Data are mean ± SEM (n = 5). aP < 0.05 and bP < 0.01 vs control group; cP < 0.05 and dP < 0.01 vs 1 μM ICA group. ICA: Icariin.
Figure 2 Icariin enhanced the expression of osteogenesis-related markers.
A: Expression levels of osteogenesis-related genes [alkaline phosphatase (ALP), osteocalcin (OCN), runt-related transcription factor 2 (RUNX2), and collagen type I alpha 1 (COL1A1)] in bone marrow mesenchymal stem cells (BMSCs) following treatment with icariin (ICA); B: Protein expression levels of ALP and OCN by Western blot; C: Expression of ALP by immunofluorescence (scale bar: 100 μm); D: Expression of OCN by immunofluorescence (scale bar: 100 μm). Data are mean ± SEM (n = 5). bP < 0.01 vs control group; cP < 0.05 and dP < 0.01 vs 1 μM ICA group. ICA: Icariin; ALP: Alkaline phosphatase; OCN: Osteocalcin; RUNX2: Runt-related transcription factor 2; COL1A1: Collagen type I alpha 1; qRT-PCR: Quantitative real-time polymerase chain reaction.
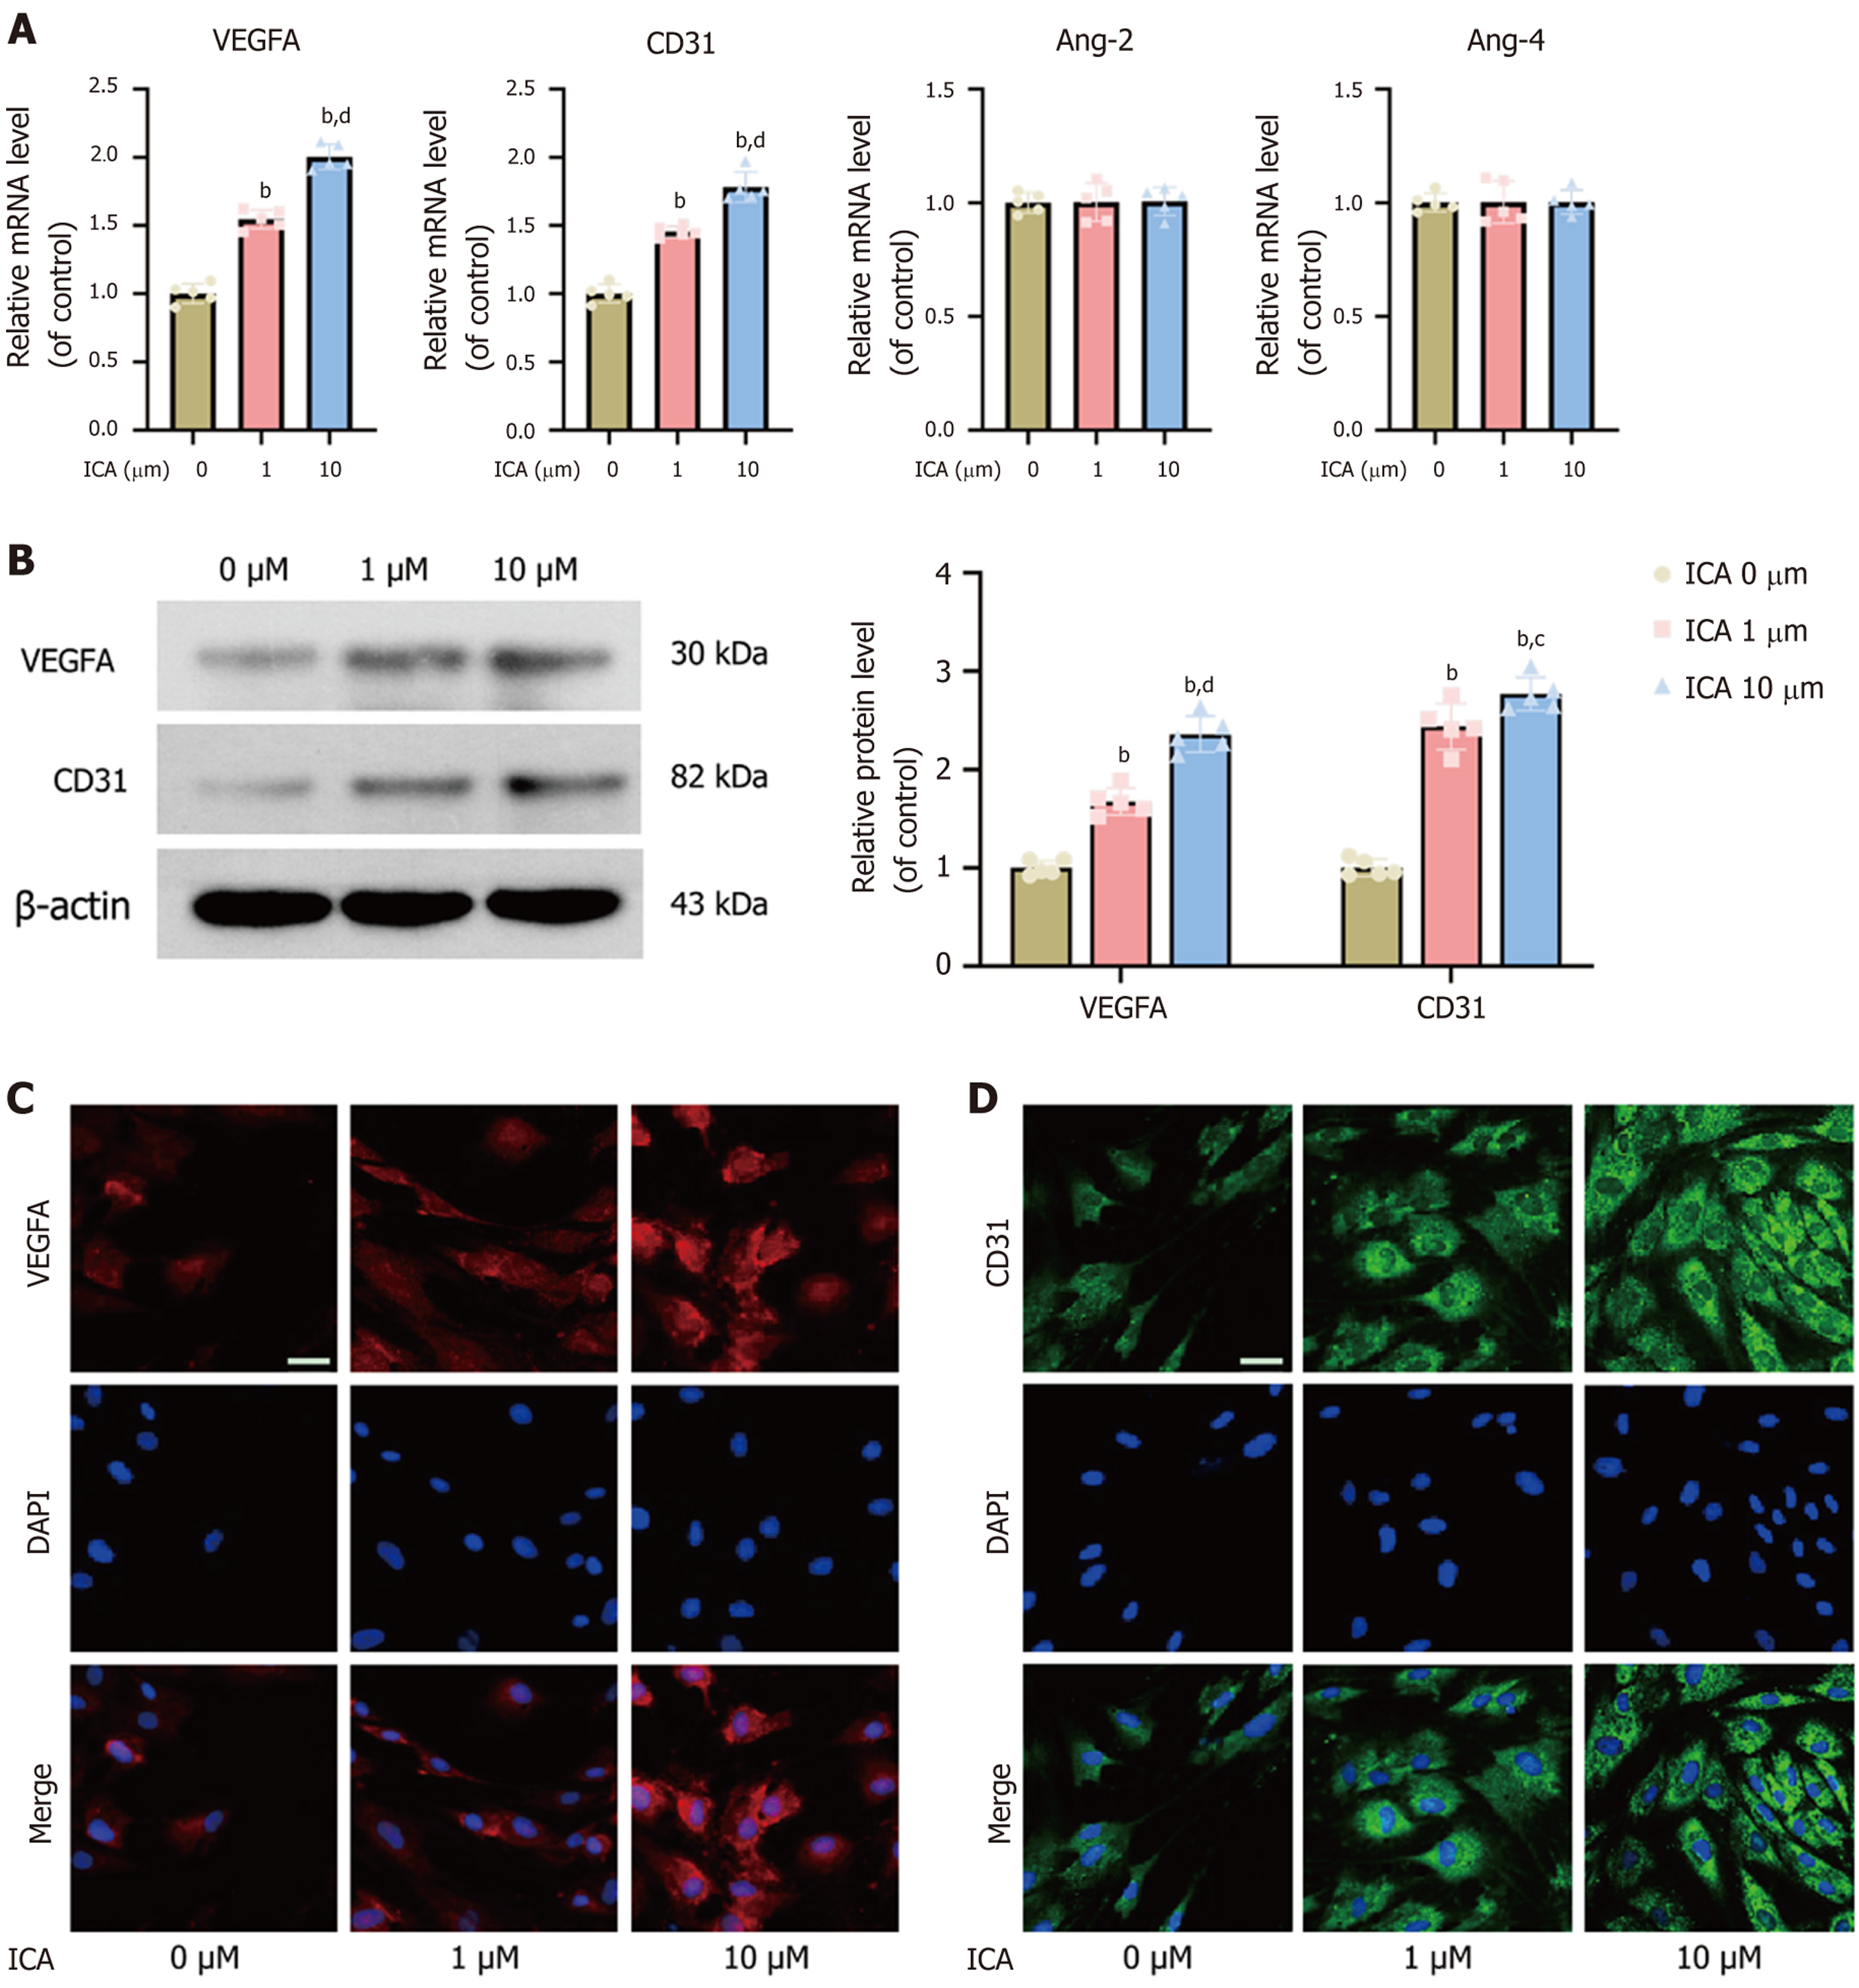
Figure 3 Icariin enhanced the expression of angiogenesis-related markers.
A: Expression levels of angiogenesis-related genes [vascular endothelial growth factor A (VEGFA), platelet endothelial cell adhesion molecule 1 (CD31), angiopoietin-2 (Ang-2), and angiopoietin-4 (Ang-4)] in bone marrow mesenchymal stem cells (BMSCs) following treatment with icariin (ICA); B: Protein expression levels of VEGFA and CD31 by Western blot; C: Expression of VEGFA by immunofluorescence (scale bar: 100 μm); D: Expression of CD31 by immunofluorescence (scale bar: 100 μm). Data are mean ± SEM (n = 5). bP < 0.01 vs control group; cP < 0.05 and dP < 0.01 vs 1 μM ICA group. ICA: Icariin; VEGFA: Vascular endothelial growth factor A; CD31: Platelet endothelial cell adhesion molecule 1; Ang-2: Angiopoietin-2; Ang-4: Angiopoietin-4; qRT-PCR: Quantitative real-time polymerase chain reaction.
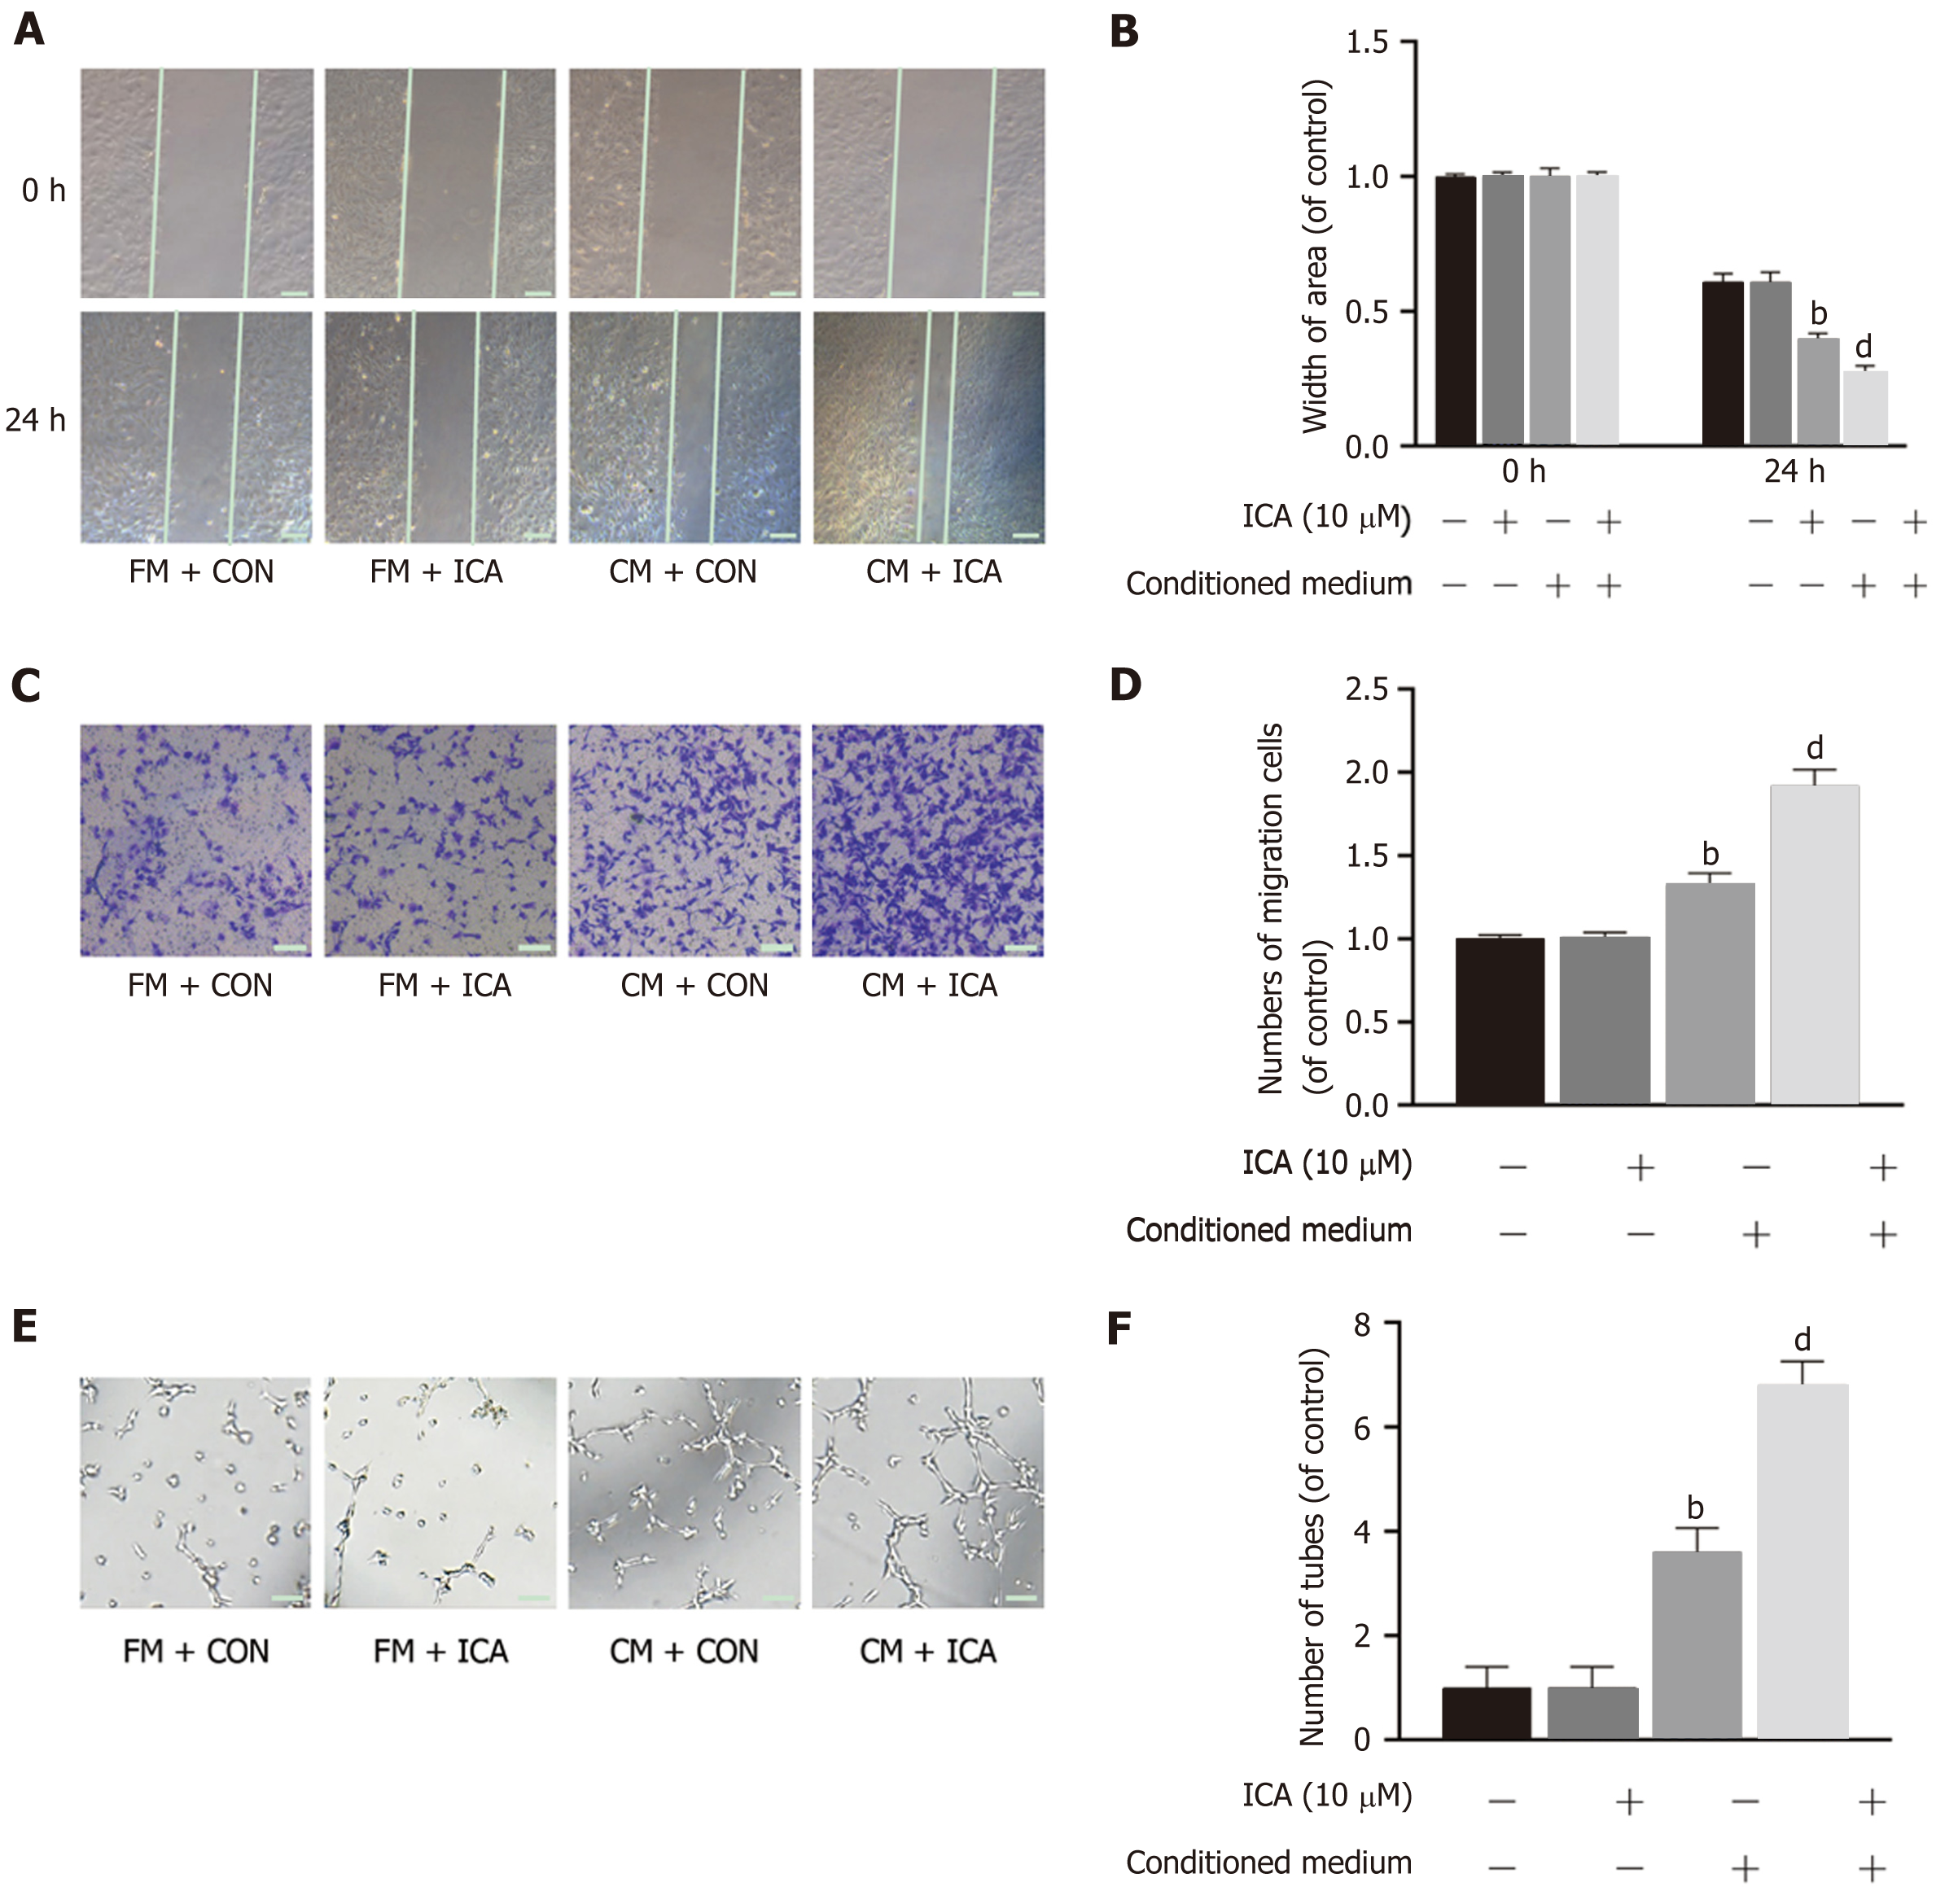
Figure 4 Icariin induced osteogenesis-angiogenesis coupling of bone marrow mesenchymal stem cells.
A: Scratch wound assay to show migration of human umbilical vein endothelial cells (HUVECs) cultured with fresh medium (FM) or conditioned medium (CM) and with or without icariin (ICA) (scale bar: 100 μm); B: Quantification of the scratch wound assays; C: Transwell migration assay of HUVECs cultured with FM or CM and with or without ICA (scale bar: 100 μm); D: Quantification of the transwell migration assays; E: Tube formation assay of HUVECs cultured with FM or CM and with or without ICA (scale bar: 100 μm); F: Quantification of the tube formation assays. Data are mean ± SEM (n = 5). bP < 0.01 vs control group; dP < 0.01 vs CM + control group. ICA: Icariin; FM: Fresh medium; CM: Conditioned medium; Con: Control.
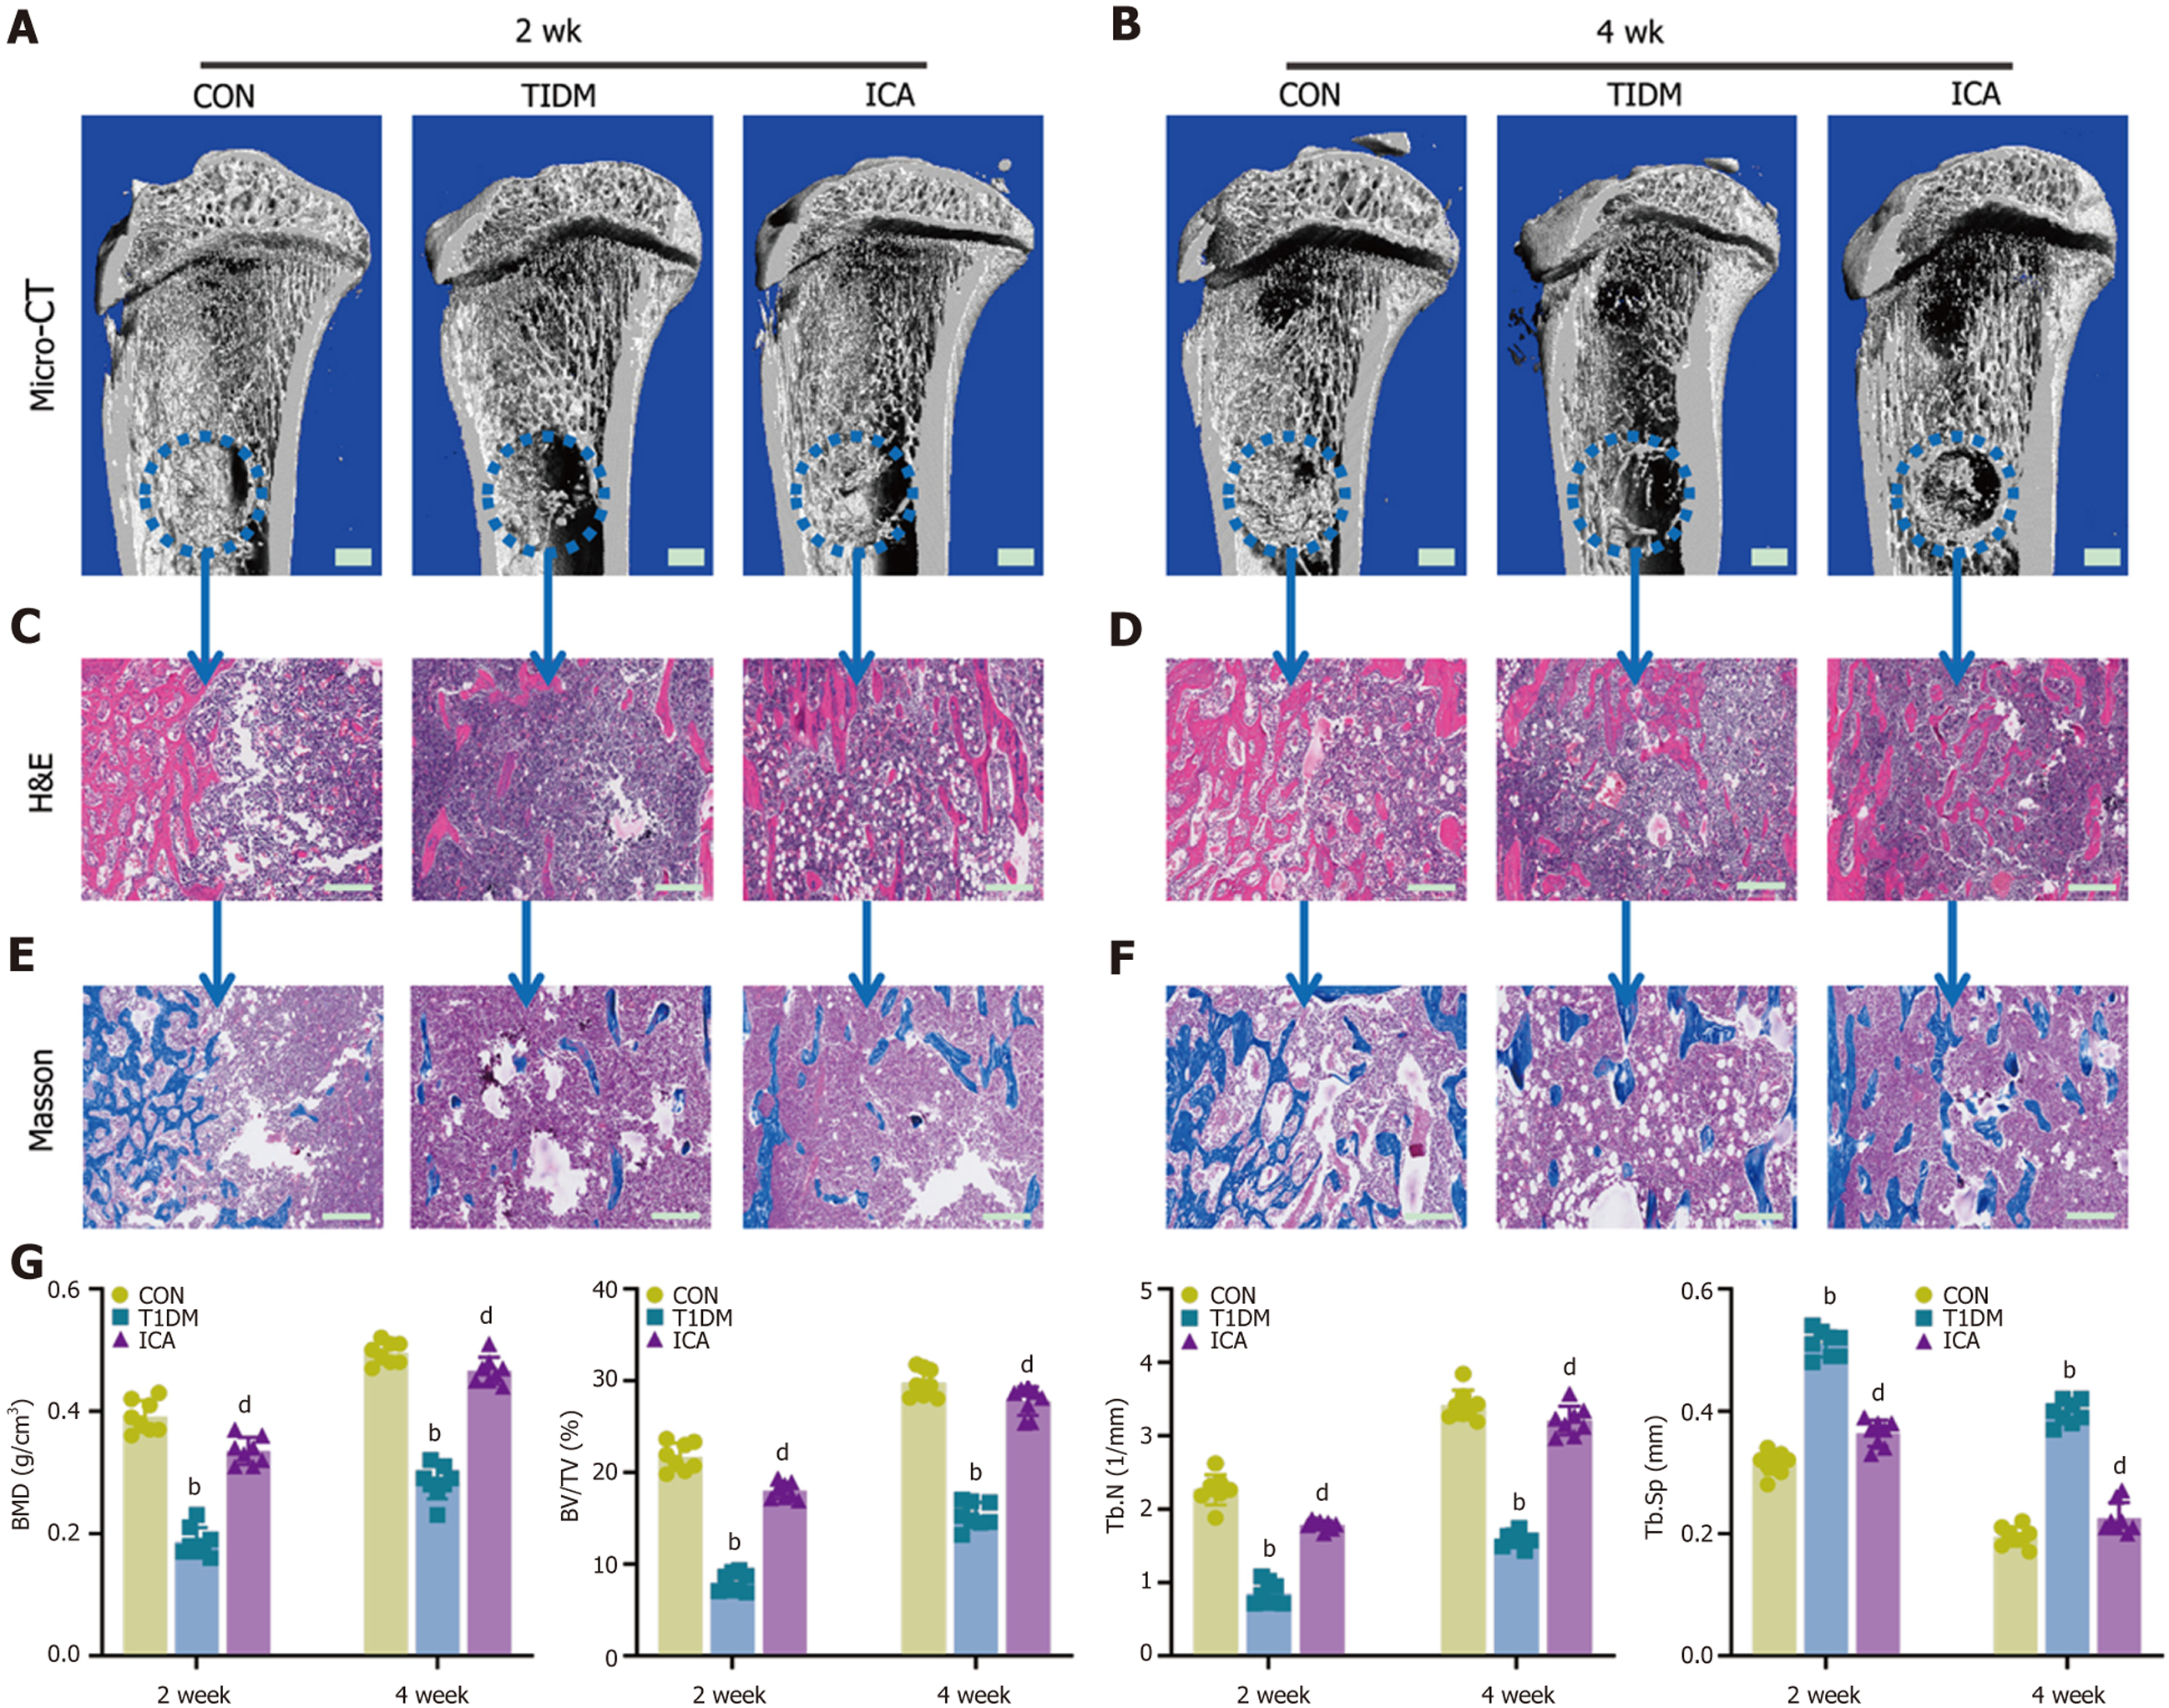
Figure 5 Icariin improved bone repair capacity by promoting osteogenesis in type 1 diabetes mellitus rats.
A and B: Three-dimensional reconstruction images of the defect area at week 2 (A) and week 4 (B) (scale bars: 1 mm); C and D: Hematoxylin and eosin staining of the defect area at week 2 (C) and week 4 (B) (scale bars: 200 μm); E and F: Masson’s trichrome staining of the defect area at week 2 (E) and week 4 (F) (scale bars: 200 μm); G: Micron-scale computed tomography analysis of bone mineral density (BMD), bone volume/tissue volume (BV/TV), trabecular number (Tb.N), and trabecular separation (Tb.Sp) at weeks 2 and 4. Data are mean ± SEM of the mean (n = 8). bP < 0.01 vs the control group; dP < 0.01 vs the type 1 diabetes mellitus group. ICA: Icariin; Con: Control; T1DM: Type 1 diabetes mellitus.
Figure 6 Icariin accelerated bone regeneration by inducing osteogenesis-angiogenesis coupling of bone marrow mesenchymal stem cells in type 1 diabetes mellitus rats.
A-C: Immunohistochemical results of osteocalcin (OCN) (A), vascular endothelial growth factor A (VEGFA) (B), and platelet endothelial cell adhesion molecule 1 (CD31) (C) in the defect area at week 2 (scale bars: 100 μm); D-F: Immunohistochemical results of OCN (D), VEGFA (E), and CD31 (F) in the defect area at week 4 (scale bars: 100 μm); G: CD31 and endomucin (EMCN) double immunofluorescence staining in the defect area at week 2 (scale bar: 100 μm); H: CD31 and EMCN double immunofluorescence staining in the defect area at week 4 (scale bar: 100 μm); I: Sequential fluorescent labeling (scale bar: 10 μm); J: Quantitative analysis of mineral apposition rate. Data are mean ± SEM (n = 8). bP < 0.01 vs the control group; dP < 0.01 vs the type 1 diabetes mellitus group. ICA: Icariin; Con: Control; T1DM: Type 1 diabetes mellitus; OCN: Osteocalcin; VEGFA: Vascular endothelial growth factor A; CD31: Platelet endothelial cell adhesion molecule 1.
- Citation: Zheng S, Hu GY, Li JH, Zheng J, Li YK. Icariin accelerates bone regeneration by inducing osteogenesis-angiogenesis coupling in rats with type 1 diabetes mellitus. World J Diabetes 2024; 15(4): 769-782
- URL: https://www.wjgnet.com/1948-9358/full/v15/i4/769.htm
- DOI: https://dx.doi.org/10.4239/wjd.v15.i4.769


