Copyright
©The Author(s) 2024.
World J Diabetes. Apr 15, 2024; 15(4): 697-711
Published online Apr 15, 2024. doi: 10.4239/wjd.v15.i4.697
Published online Apr 15, 2024. doi: 10.4239/wjd.v15.i4.697
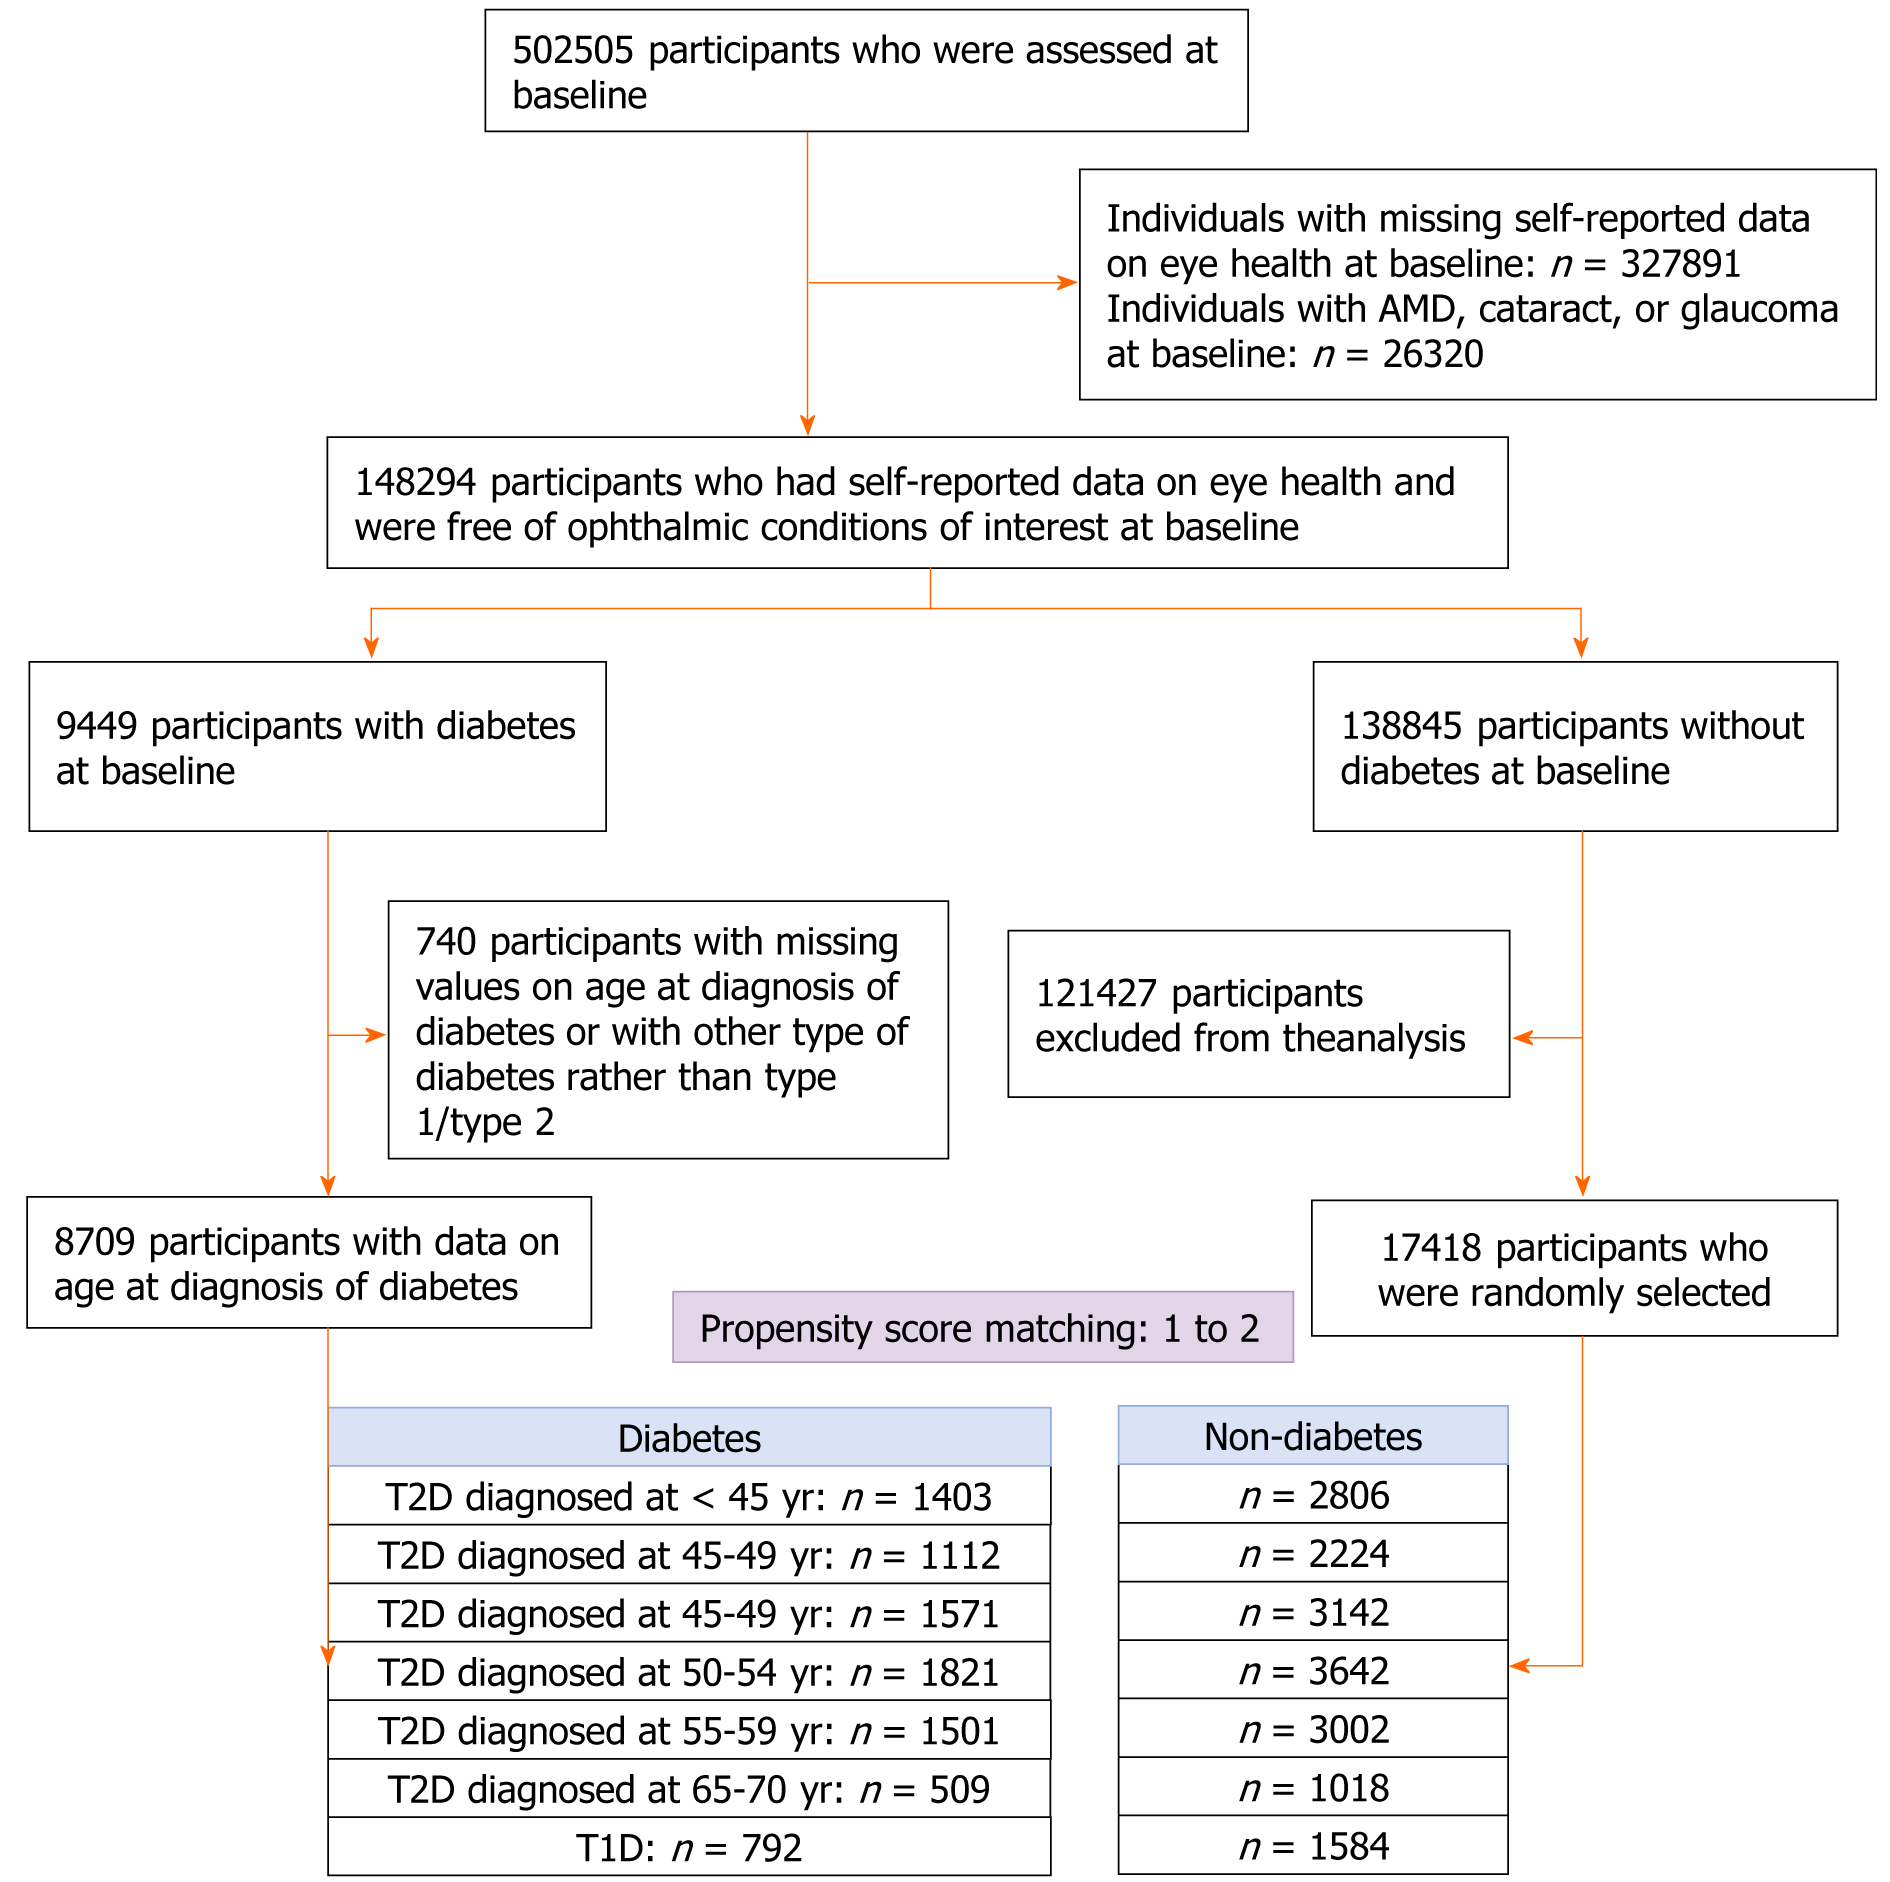
Figure 1 Flowchart for population selection for analysis of ocular conditions from the UK Biobank.
Propensity score matching was to select two controls for each diabetic participant. The analysis was conducted for age groups of diabetes diagnosis separately. The median age at diagnosis type 1 was 17 years. Propensity score accounted for age, gender, ethnicity, education, household income, physical activity, smoking, alcohol consumption, sleep duration, depression, hypertension, heart disease, stroke, body mass index, high-density lipoprotein cholesterol, low-density lipoprotein cholesterol, and triglyceride. AMD: Age-related macular degeneration; T1D: Type 1 diabetes; T2D: Type 2 diabetes.
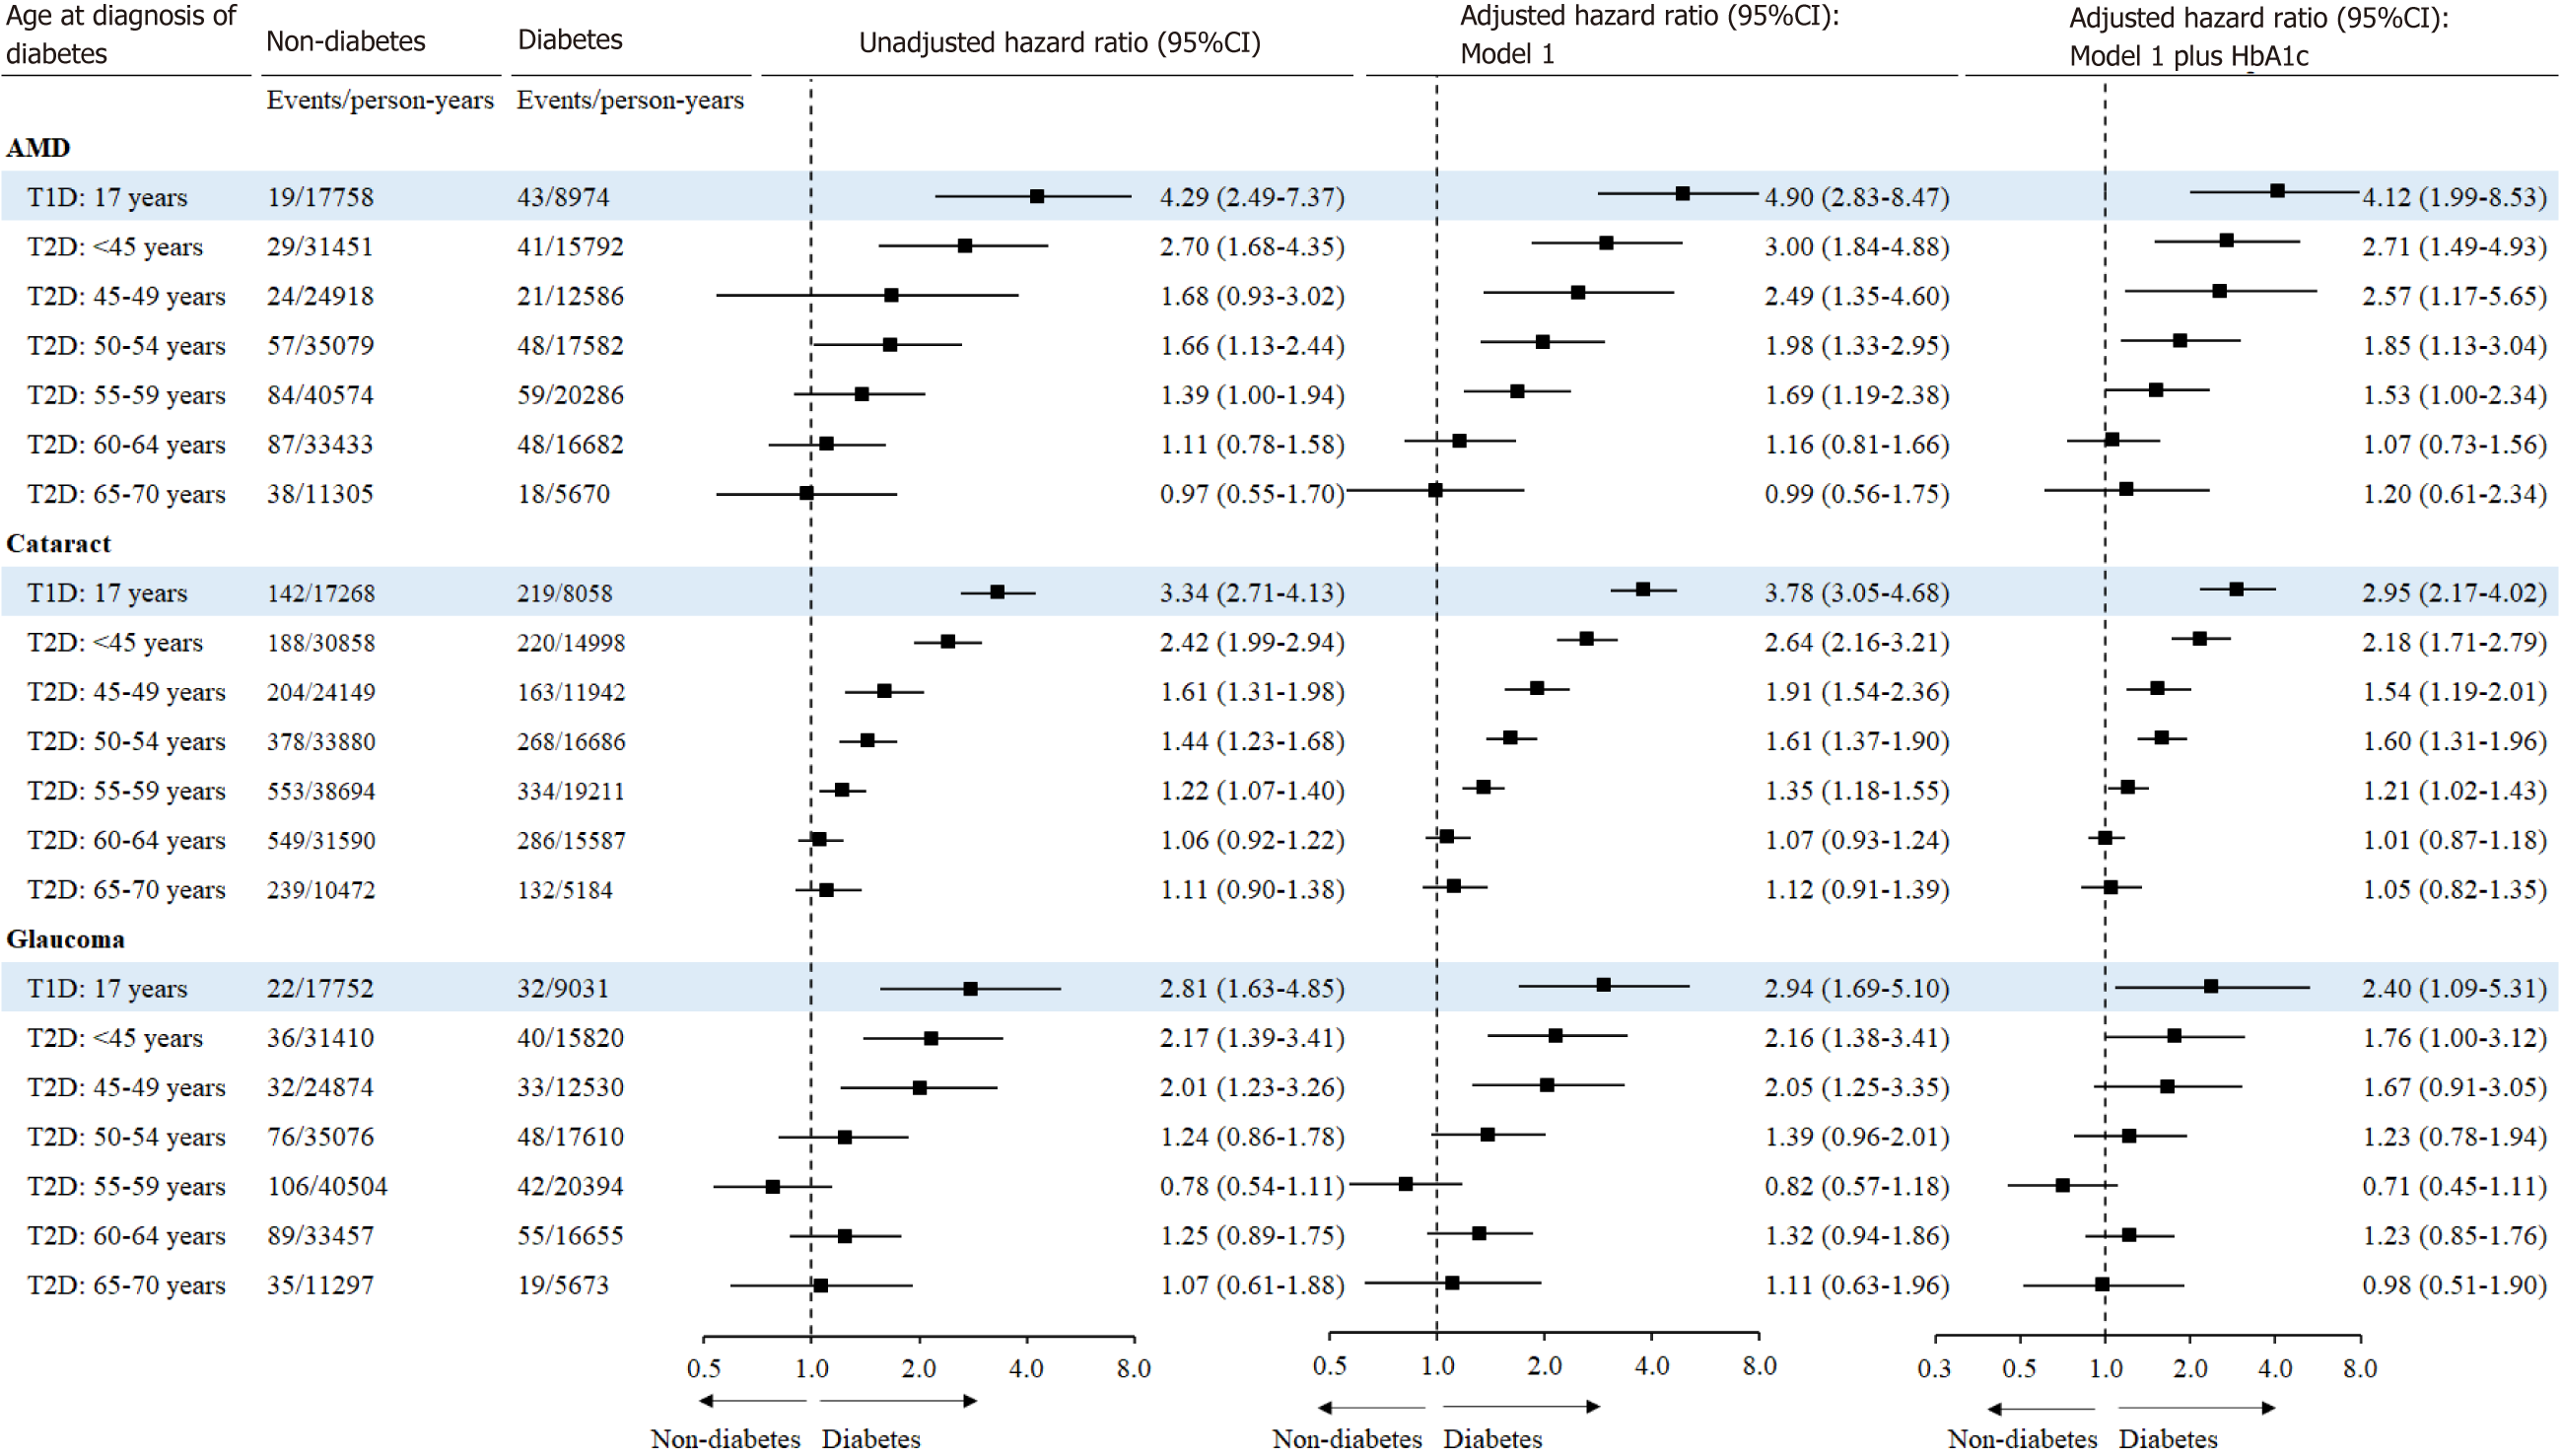
Figure 2 Risk for ocular conditions associated with age at diagnosis of diabetes.
Cox proportional hazard regression models were used to examine the association between diabetes and incident ocular condition for each group of diabetes diagnosis age. Model 1 was adjusted for age, gender, ethnicity, income, education, alcohol consumption, physical activity, sleep duration, smoking, body mass index, depression, hypertension, heart disease, stroke, high-density lipoprotein cholesterol, low-density lipoprotein cholesterol, and triglyceride. Central squares of each horizontal line represent the hazard ratio for each subgroup. Horizontal lines indicate the range of the 95%CI. The vertical dash lines indicate the hazard ratio of 1.0. AMD: Age-related macular degeneration; T1D: Type 1 diabetes; T2D: Type 2 diabetes; HbA1C: Glycated haemoglobin.
Figure 3 Vision acuity associated with age at diagnosis of diabetes.
General linear regression models were used to test the difference in LogMAR between diabetic participants and controls for each group of diabetes diagnosis age. Model 1 was adjusted for age, gender, ethnicity, income, education, alcohol consumption, physical activity, sleep duration, smoking, BMI, depression, hypertension, heart disease, stroke, high-density lipoprotein cholesterol, low-density lipoprotein cholesterol, and triglyceride. Central squares of each horizontal line represent the β for each subgroup. Horizontal lines indicate the range of the 95%CI. The vertical dash lines represent the β of 0. T1D: Type 1 diabetes; T2D: Type 2 diabetes; HbA1C: Glycated haemoglobin.
Figure 4 Intraocular pressure associated with age at diagnosis of diabetes.
General linear regression models were used to test the difference in intraocular pressure between diabetic participants and controls for each group of diabetes diagnosis age. Model 1 was adjusted for age, gender, ethnicity, income, education, alcohol consumption, physical activity, sleep duration, smoking, body mass index, depression, hypertension, heart disease, stroke, high-density lipoprotein cholesterol, low-density lipoprotein cholesterol, and triglyceride. T2D: Type 2 diabetes; IOP: Intraocular pressure.
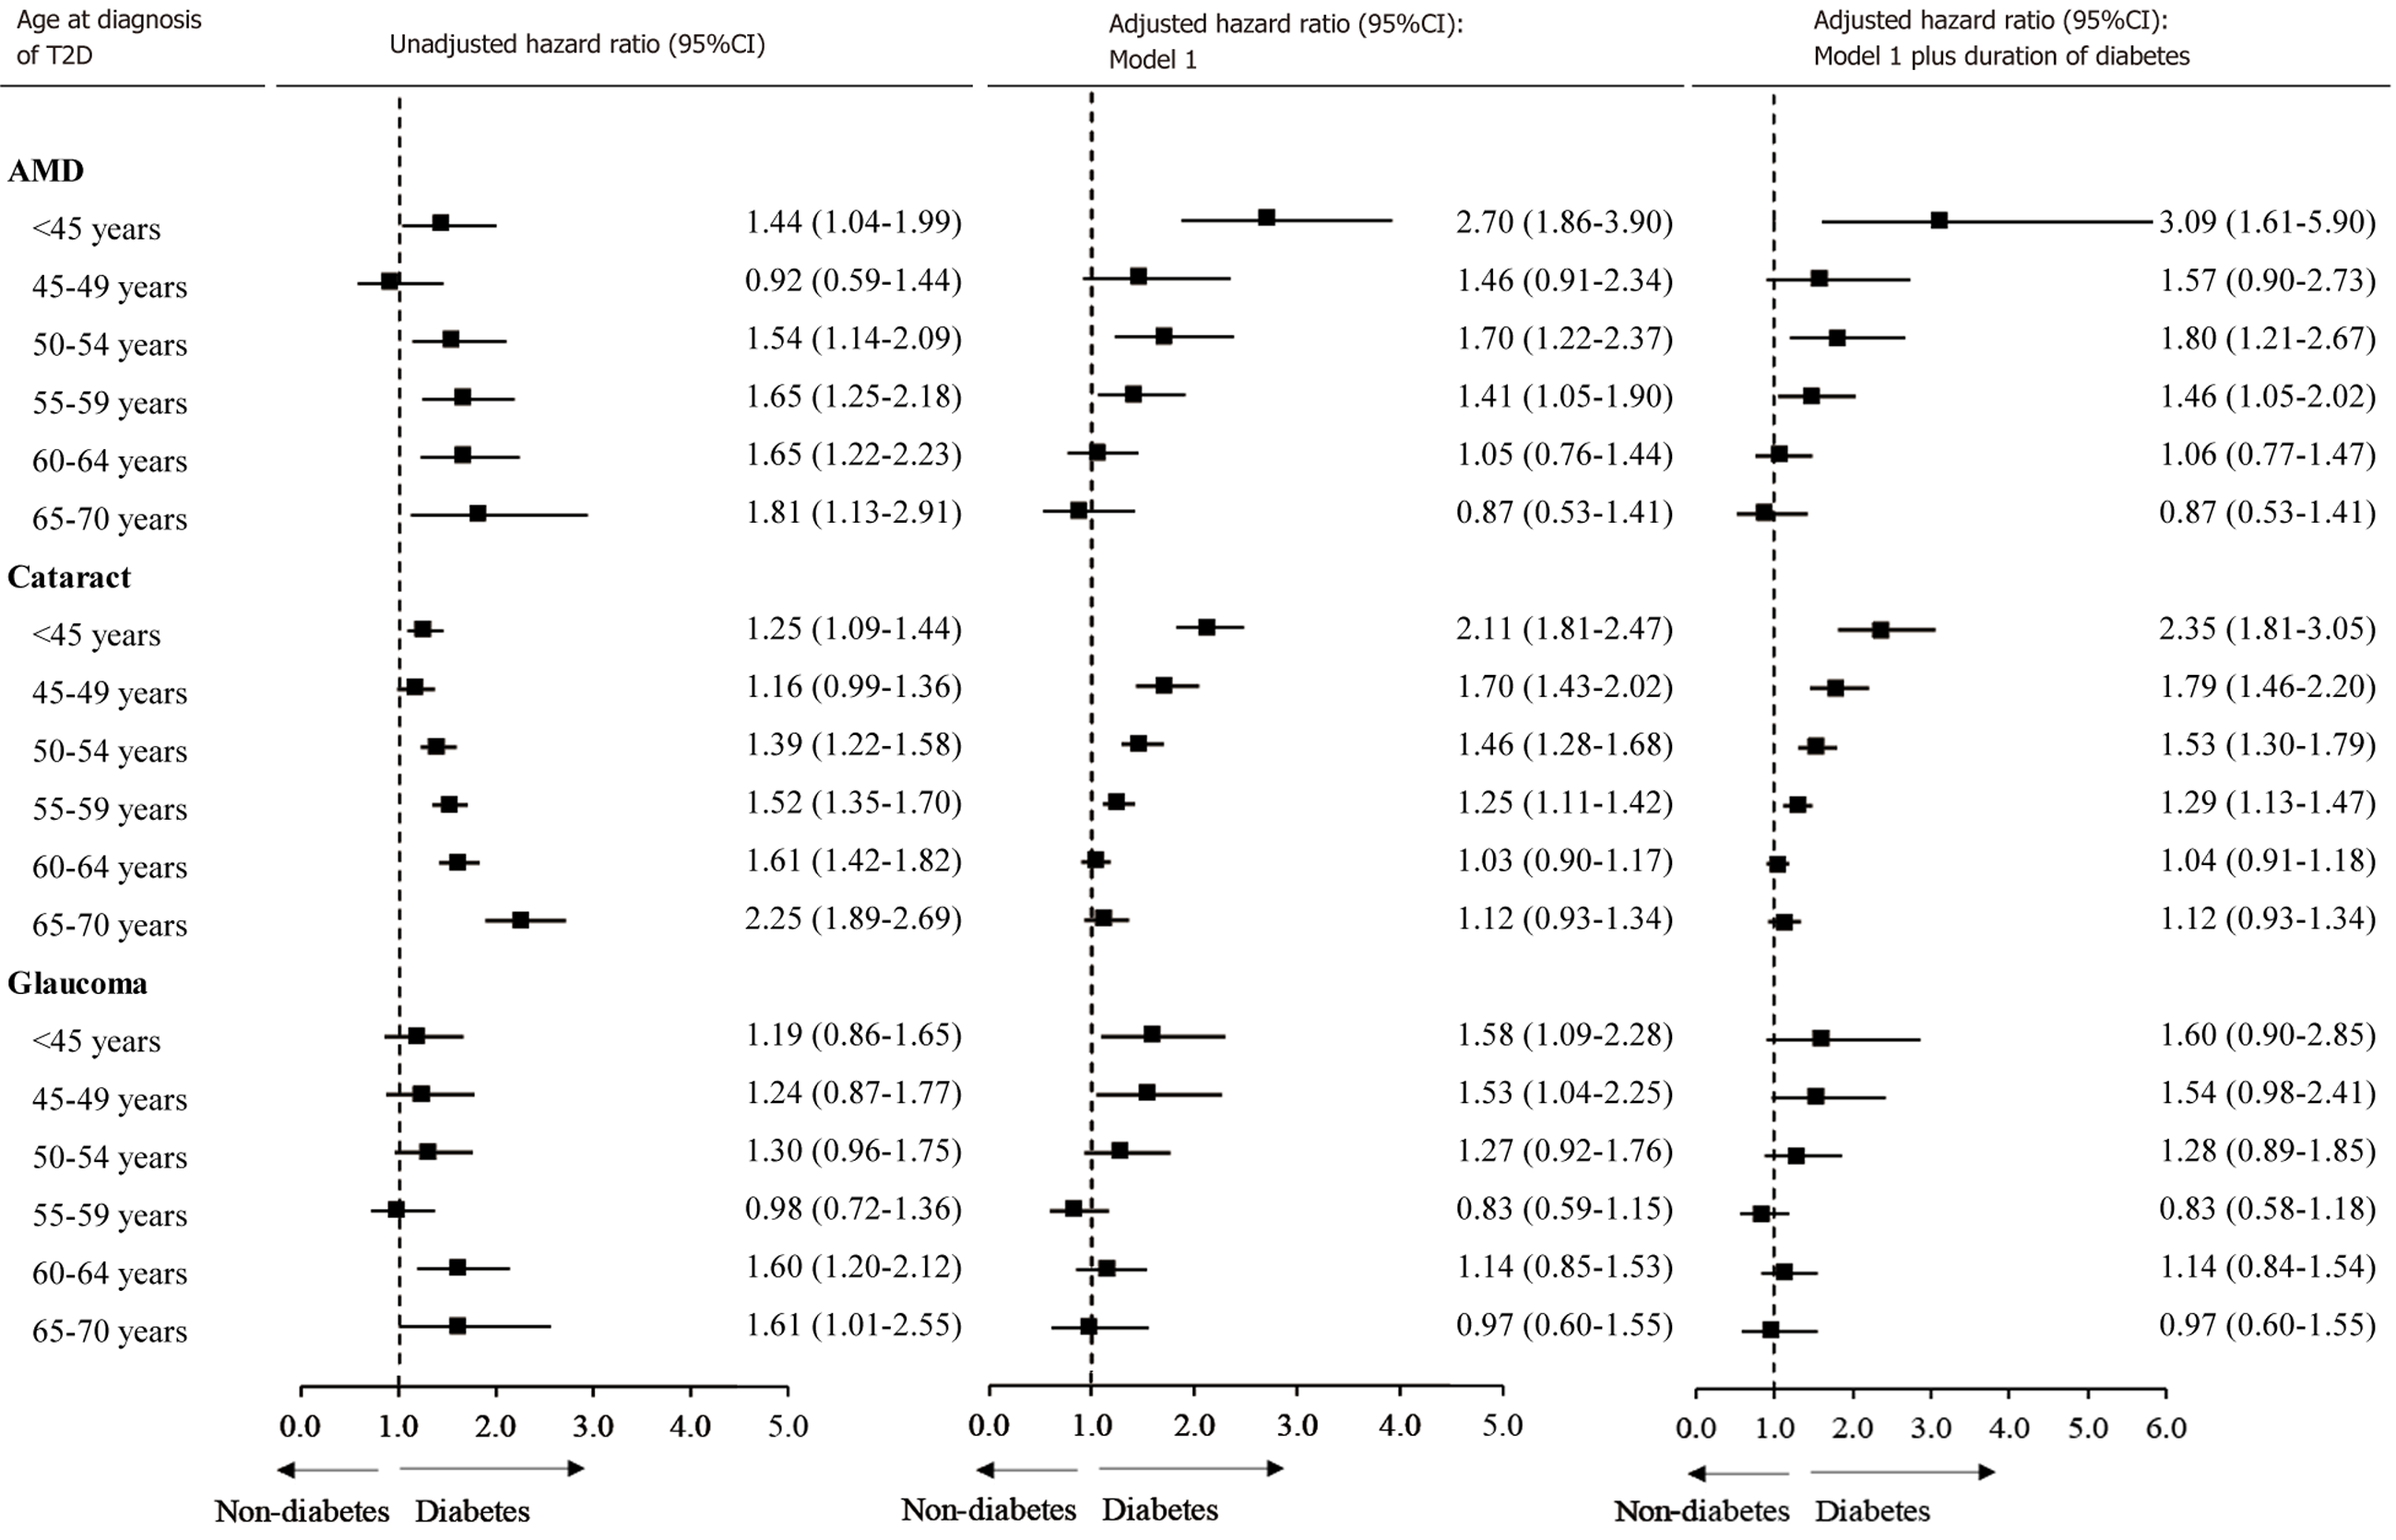
Figure 5 Risk for ocular conditions associated with age at diagnosis of diabetes with the same reference.
Sensitivity analysis was conducted to randomly select controls for each individual with type 2 diabetes with all diabetic patients as a whole. Cox proportional hazard regression models were used to estimate hazard ratios for ocular conditions associated with age at diagnosis of diabetes with controls as the reference for each group of diabetes diagnosed age. The multivariable model was adjusted for age, gender, ethnicity, income, education, alcohol consumption, physical activity, sleep duration, smoking, body mass index, depression, hypertension, heart disease, high-density lipoprotein cholesterol, low-density lipoprotein cholesterol, triglyceride, and glycated haemoglobin. Central squares of each horizontal line represent the hazard ratio for each subgroup. Horizontal lines indicate the range of the 95%CI. The vertical dash lines indicate the hazard ratio of 1.0. T2D: Type 2 diabetes; AMD: Age-related macular degeneration.
- Citation: Ye ST, Shang XW, Huang Y, Zhu S, Zhu ZT, Zhang XL, Wang W, Tang SL, Ge ZY, Yang XH, He MG. Association of age at diagnosis of diabetes with subsequent risk of age-related ocular diseases and vision acuity. World J Diabetes 2024; 15(4): 697-711
- URL: https://www.wjgnet.com/1948-9358/full/v15/i4/697.htm
- DOI: https://dx.doi.org/10.4239/wjd.v15.i4.697


