Copyright
©The Author(s) 2024.
World J Diabetes. Dec 15, 2024; 15(12): 2338-2352
Published online Dec 15, 2024. doi: 10.4239/wjd.v15.i12.2338
Published online Dec 15, 2024. doi: 10.4239/wjd.v15.i12.2338
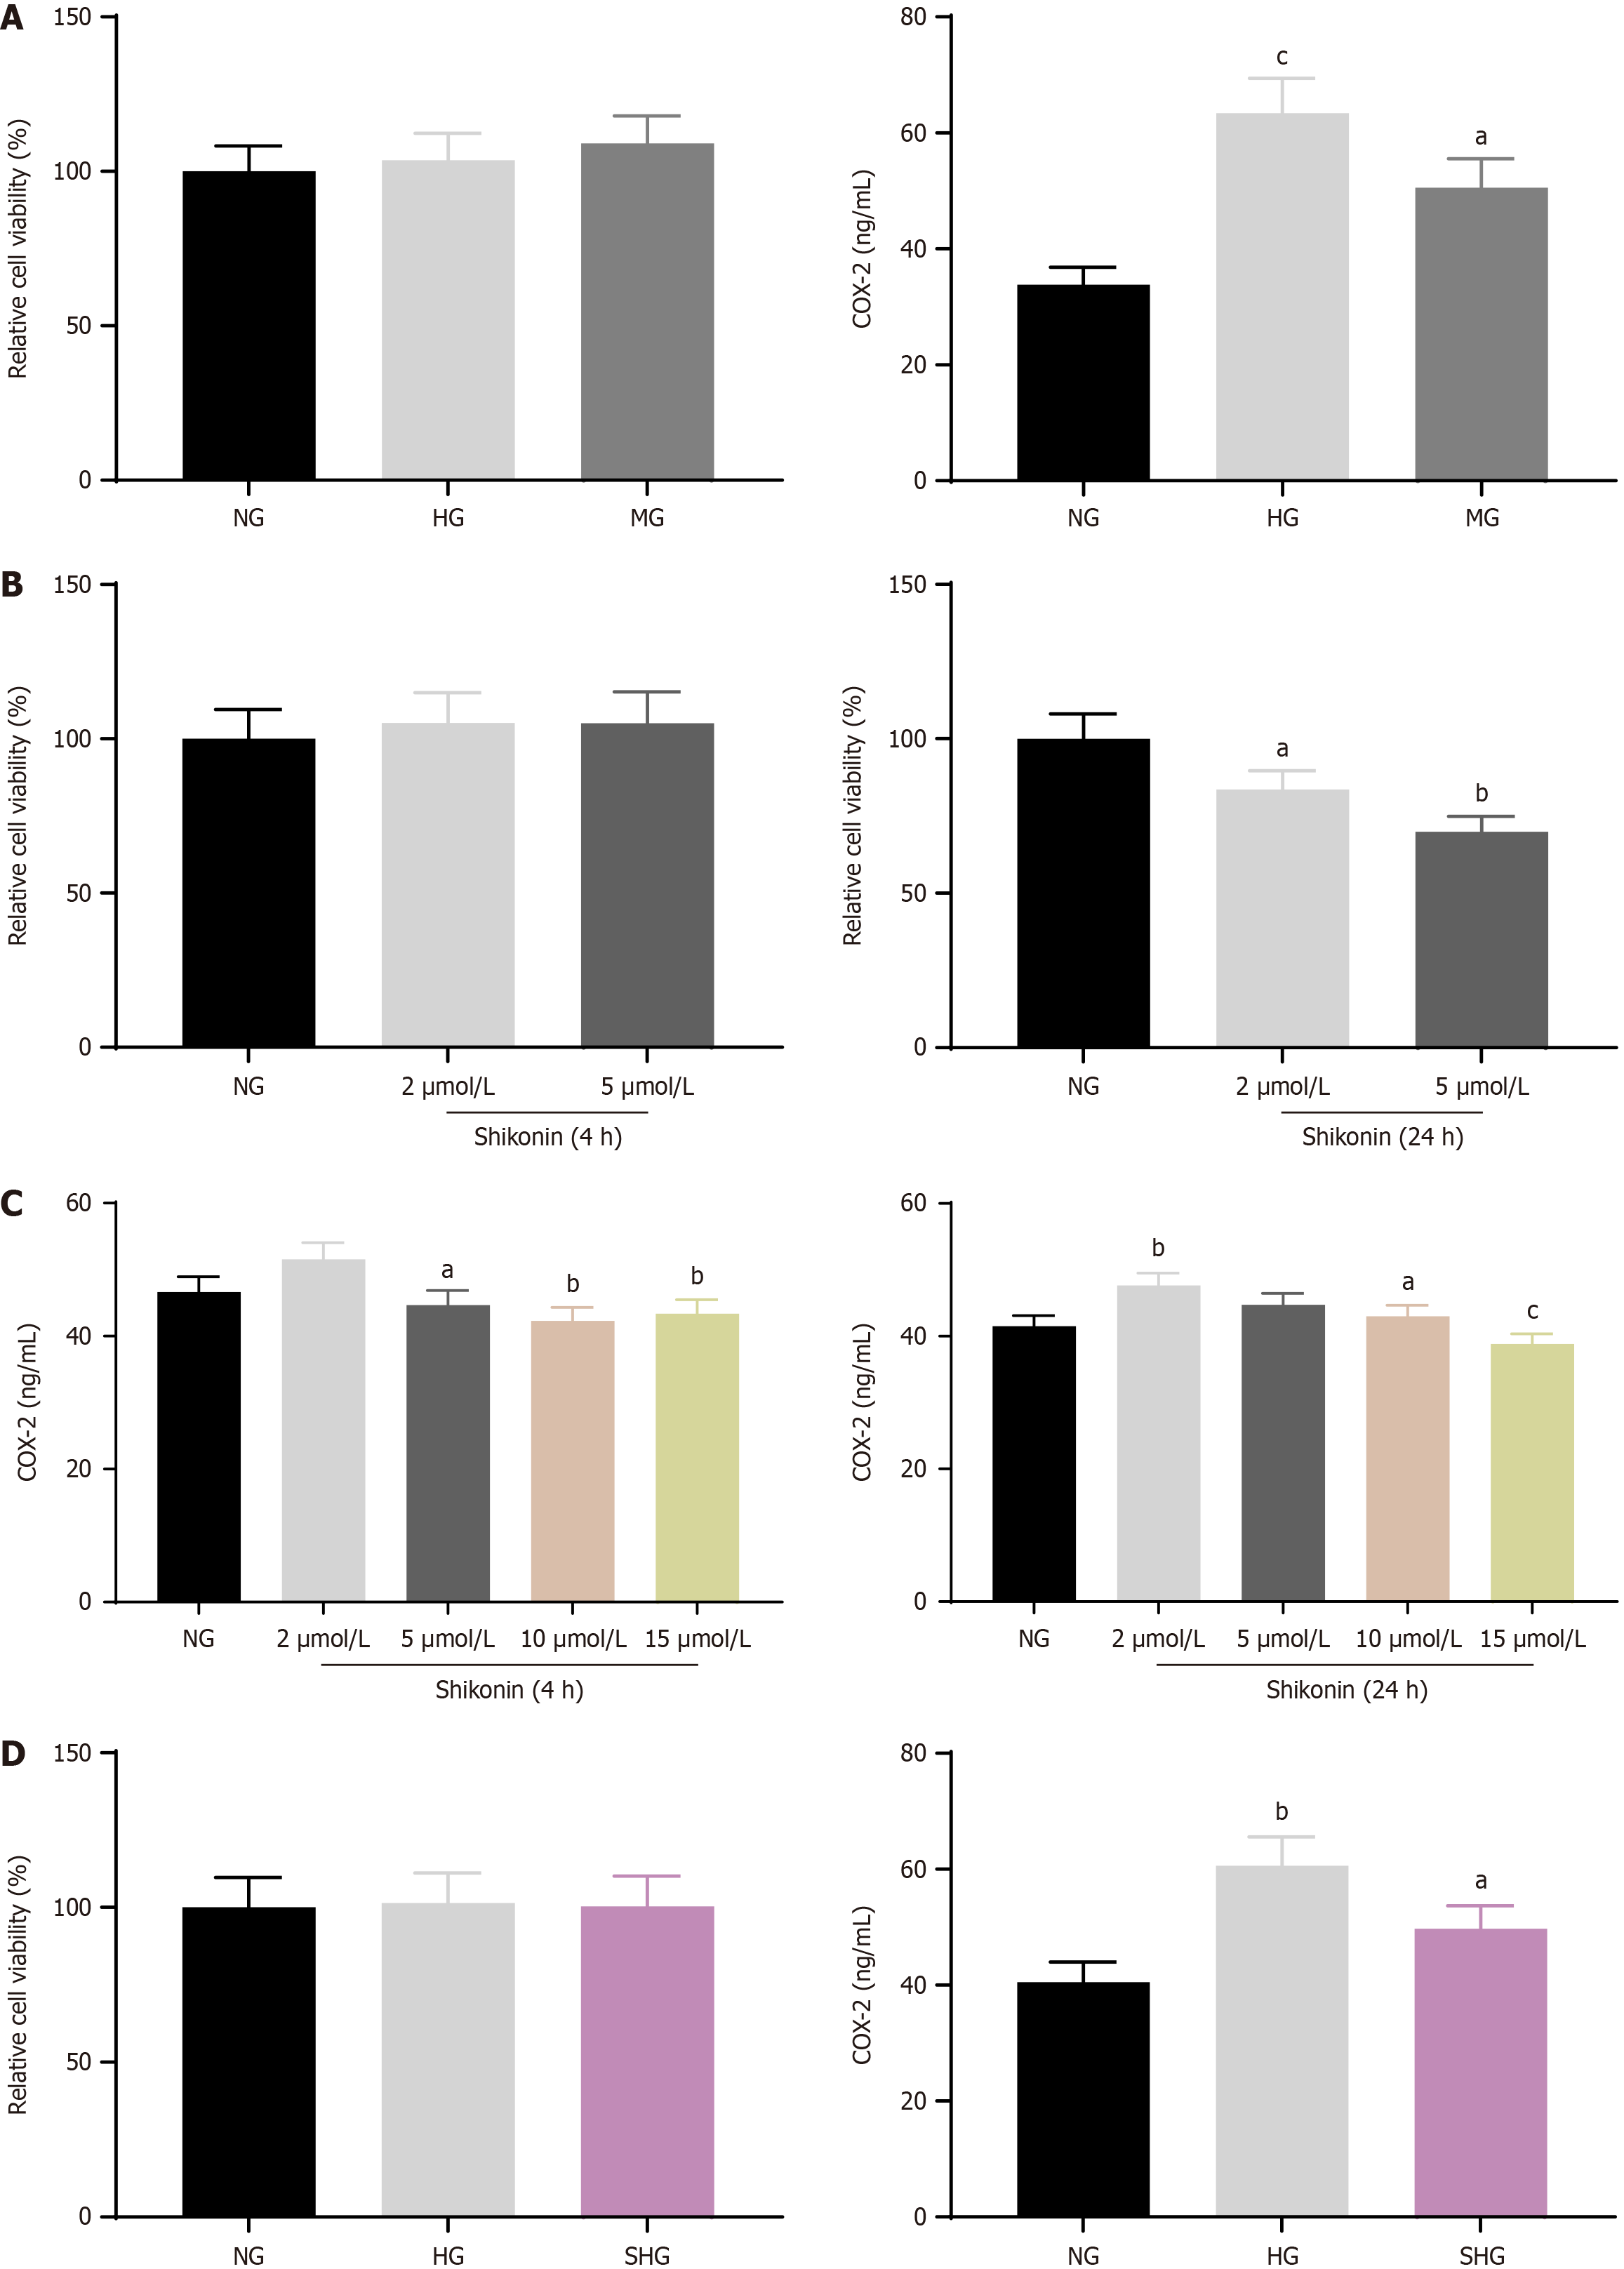
Figure 1 Effects of shikonin on cell viability and COX-2 expression in hypertonic cell models.
A: Cell viability of hypertonic cell model and COX-2 expression; B: Cell viability of shikonin treated cell; C: COX-2 expression of shikonin treated cell; D: Cell viability of shikonin treated hypertonic cell models and COX-2 expression. aP < 0.05, bP < 0.01, cP < 0.001.
Figure 2 Assessment of mitochondrial ultrastructure, reactive oxygen species, and membrane potential in NG, MG, HG, and SHG groups.
A: Changes of mitochondria under transmission electron microscope. Mitochondrial ultrastructure was identified in NG MG, HG, SHG group. Mitochondria marked with red arrows; B: The fluorescence expression of reactive oxygen species: NG, MG, HG, SHG group; C: The fluorescence expression of mitochondrial membrane potential tested by JC-1: NG, MG, HG, SHG group; D: The fluorescence expression of mitochondrial membrane potential tested by calcein AM: NG, MG, HG, SHG group.
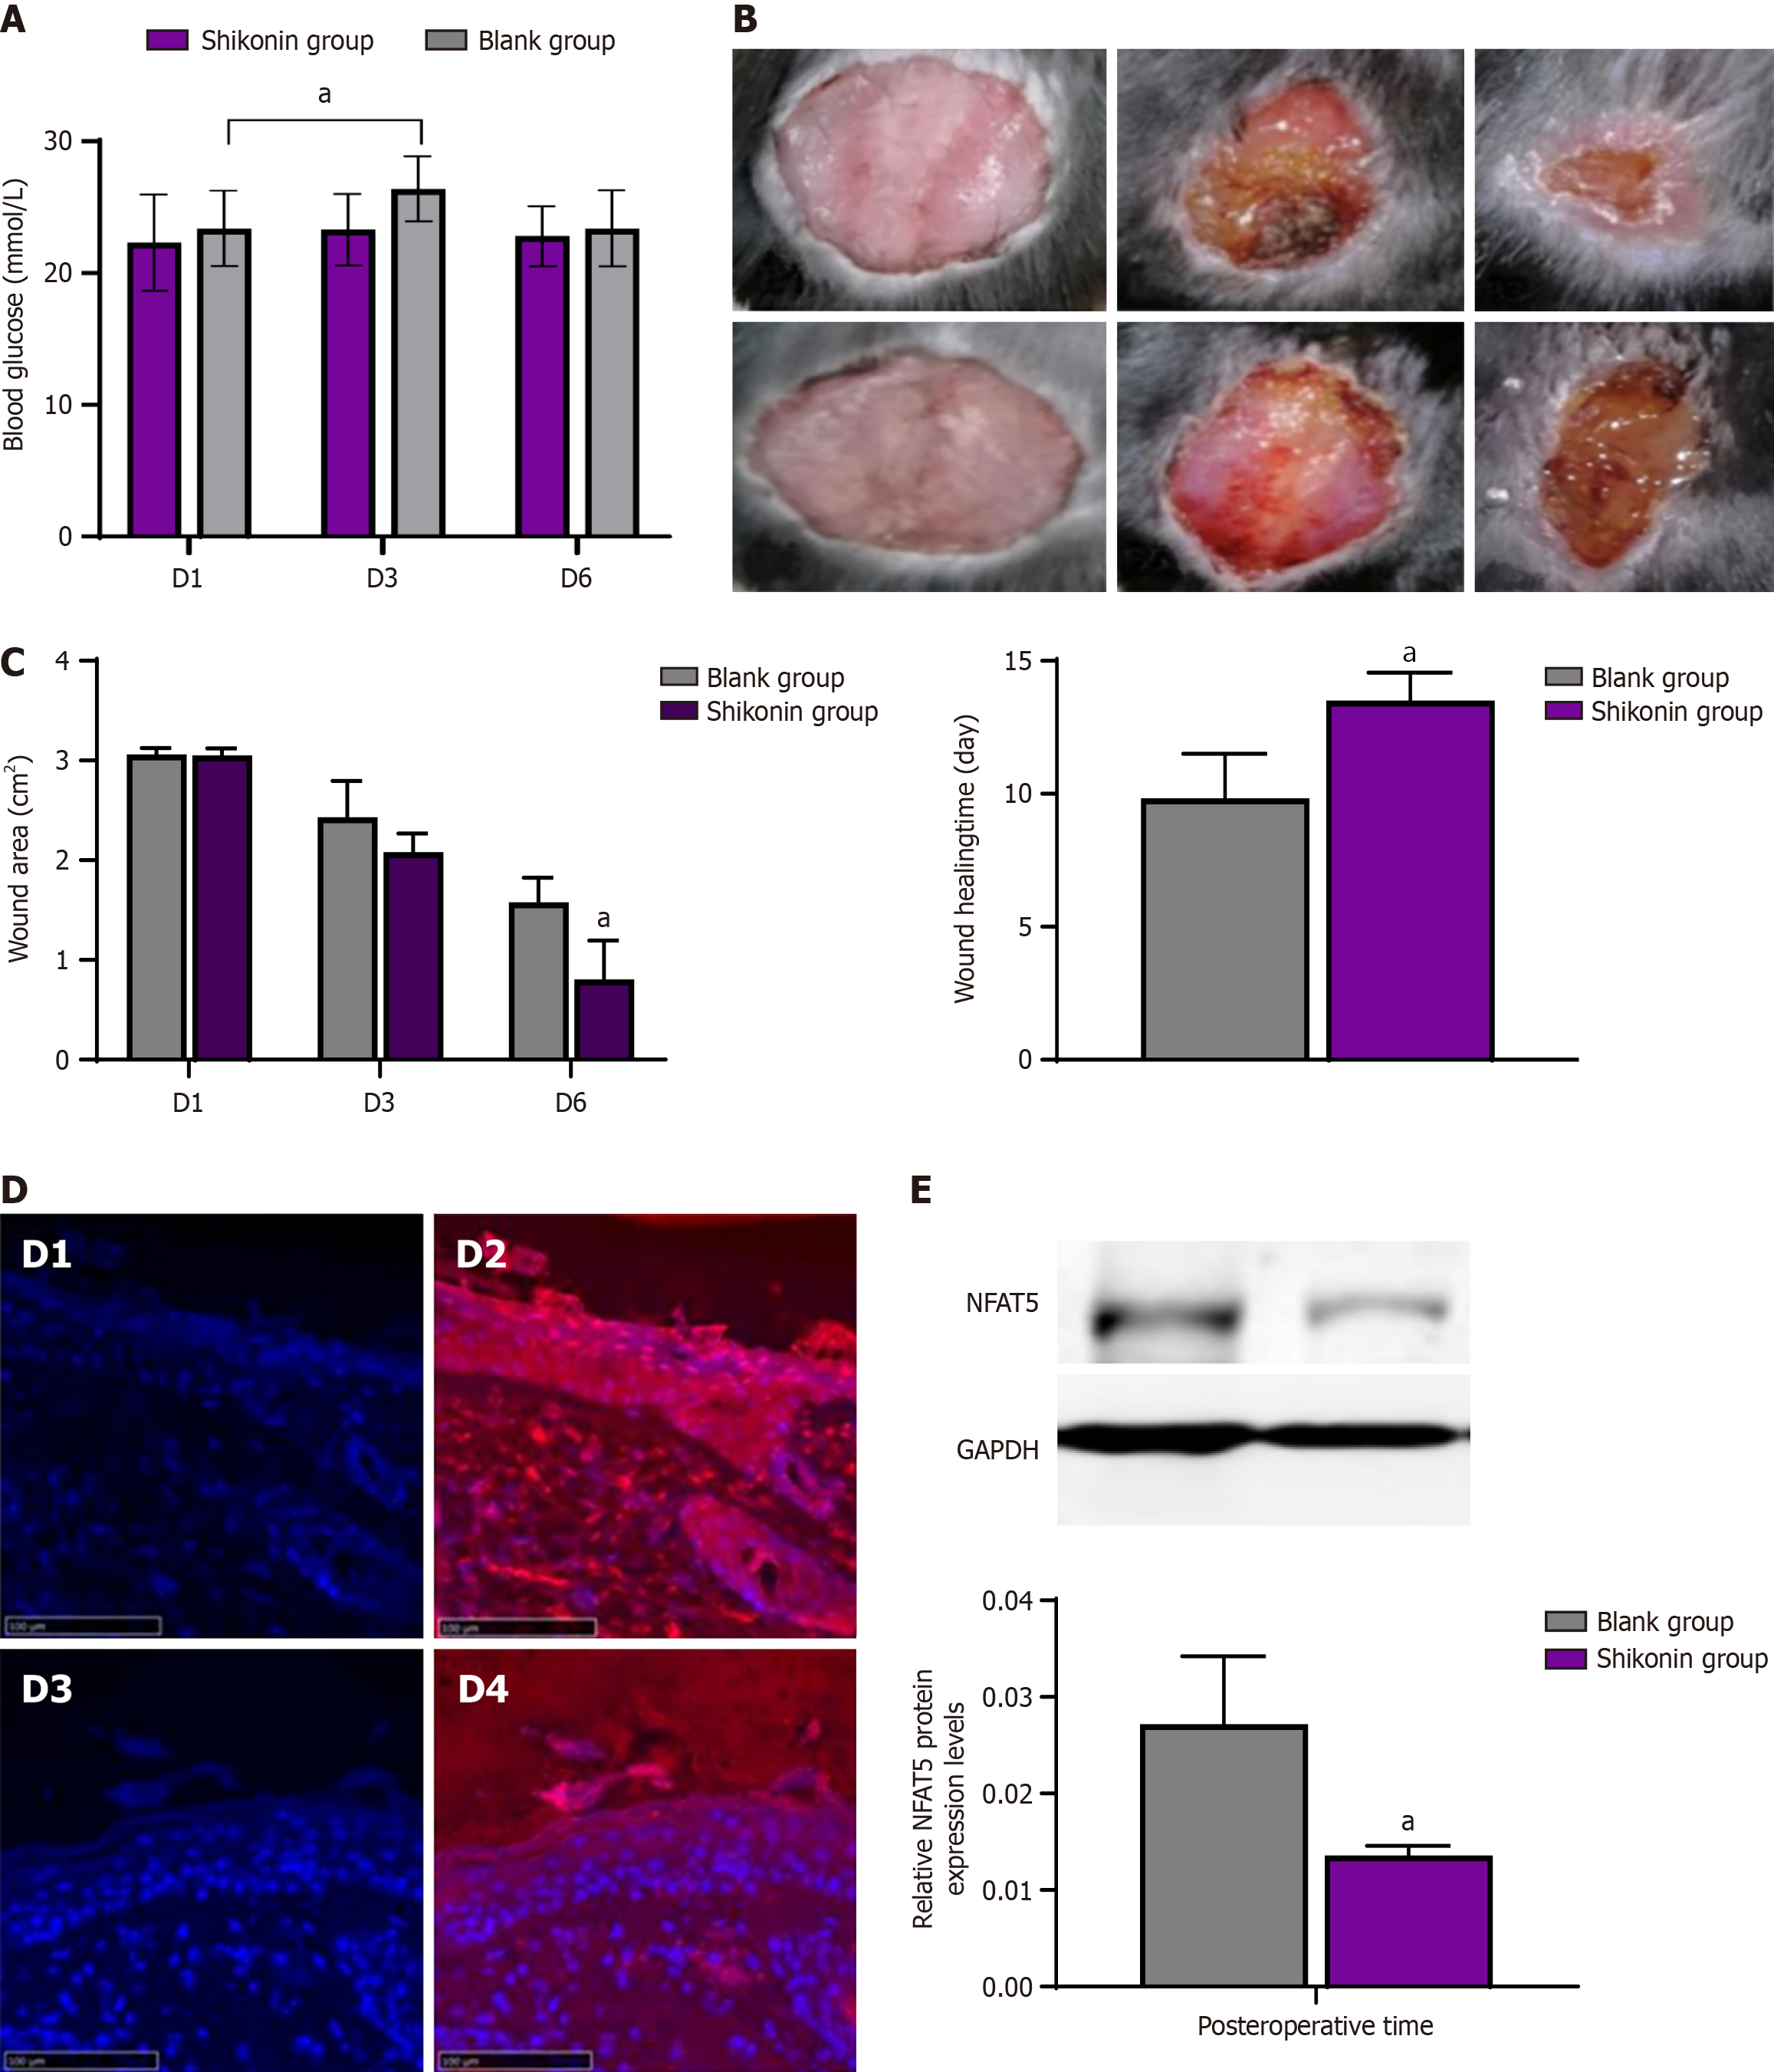
Figure 3 Effects of shikonin on blood glucose, wound healing, and NFAT5 expression in diabetic mice.
A: Changes of blood glucose in mice (D3 vs D1, P < 0.05); B: Wound changes in shikonin group and blank group. Shikonin group after modeling: Day 1, day 3, day 6. Blank group after modeling: day 1, day 3, day 6; C: Wound area changing and wound healing time; D: The immunofluorescence expressions of NFAT5 protein of diabetic mice from wound margin. NFAT5 antibody: red, cell nucleus: Blue; E: The expressions of NFAT5 protein of mice from wound margin. aP < 0.05 Shikonin group vs blank group.
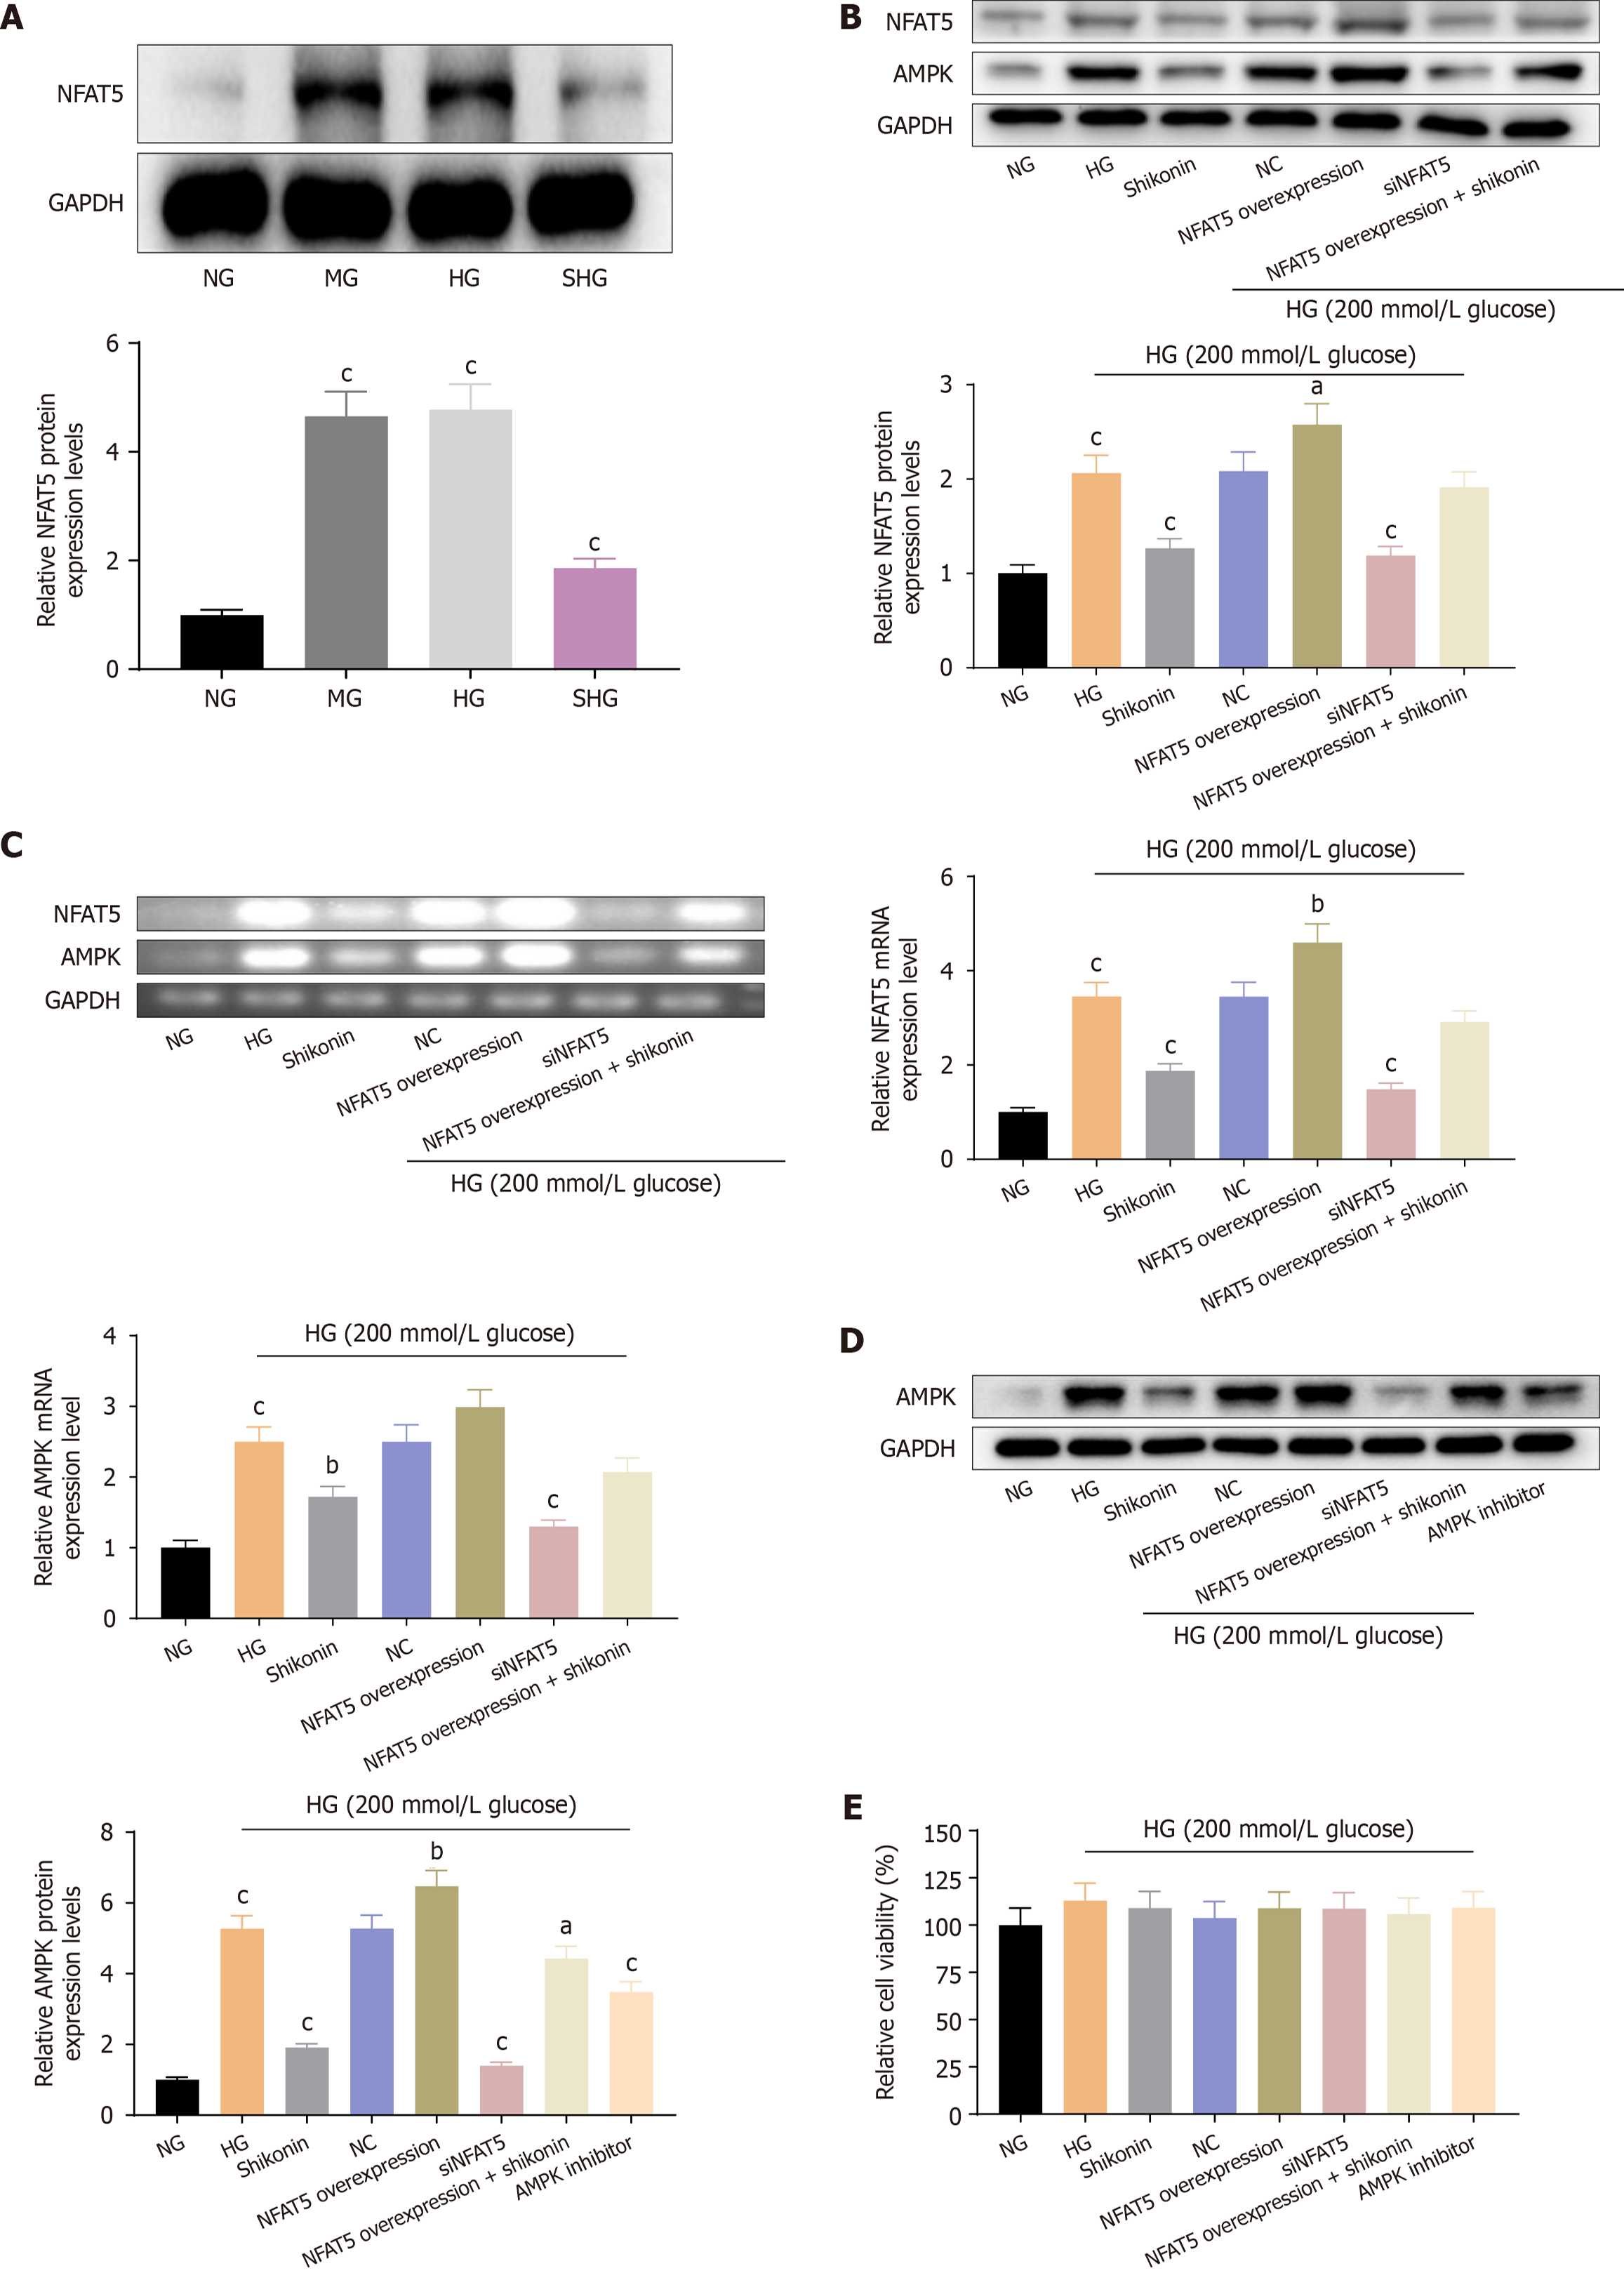
Figure 4 Regulation of NFAT5 and AMPK pathways in hypertonic cells: Protein and mRNA expression, and effects on cell viability.
A: The expressions of NFAT5 protein in hypertonic cells; B: The expressions of protein (NFAT5, AMPK) with NFAT5 overexpression vector and siNFAT5 transfection into hypertonic cells were detected; C: The expressions of mRNA (NFAT5, AMPK) with NFAT5 overexpression vector and siNFAT5 transfection into hypertonic cells were detected; D: The expression of AMPK in hypertonic cells was detected; E: The effects of NFAT5 and AMPK inhibitors on cell viability were detected. aP < 0.05, bP < 0.01, cP < 0.001.
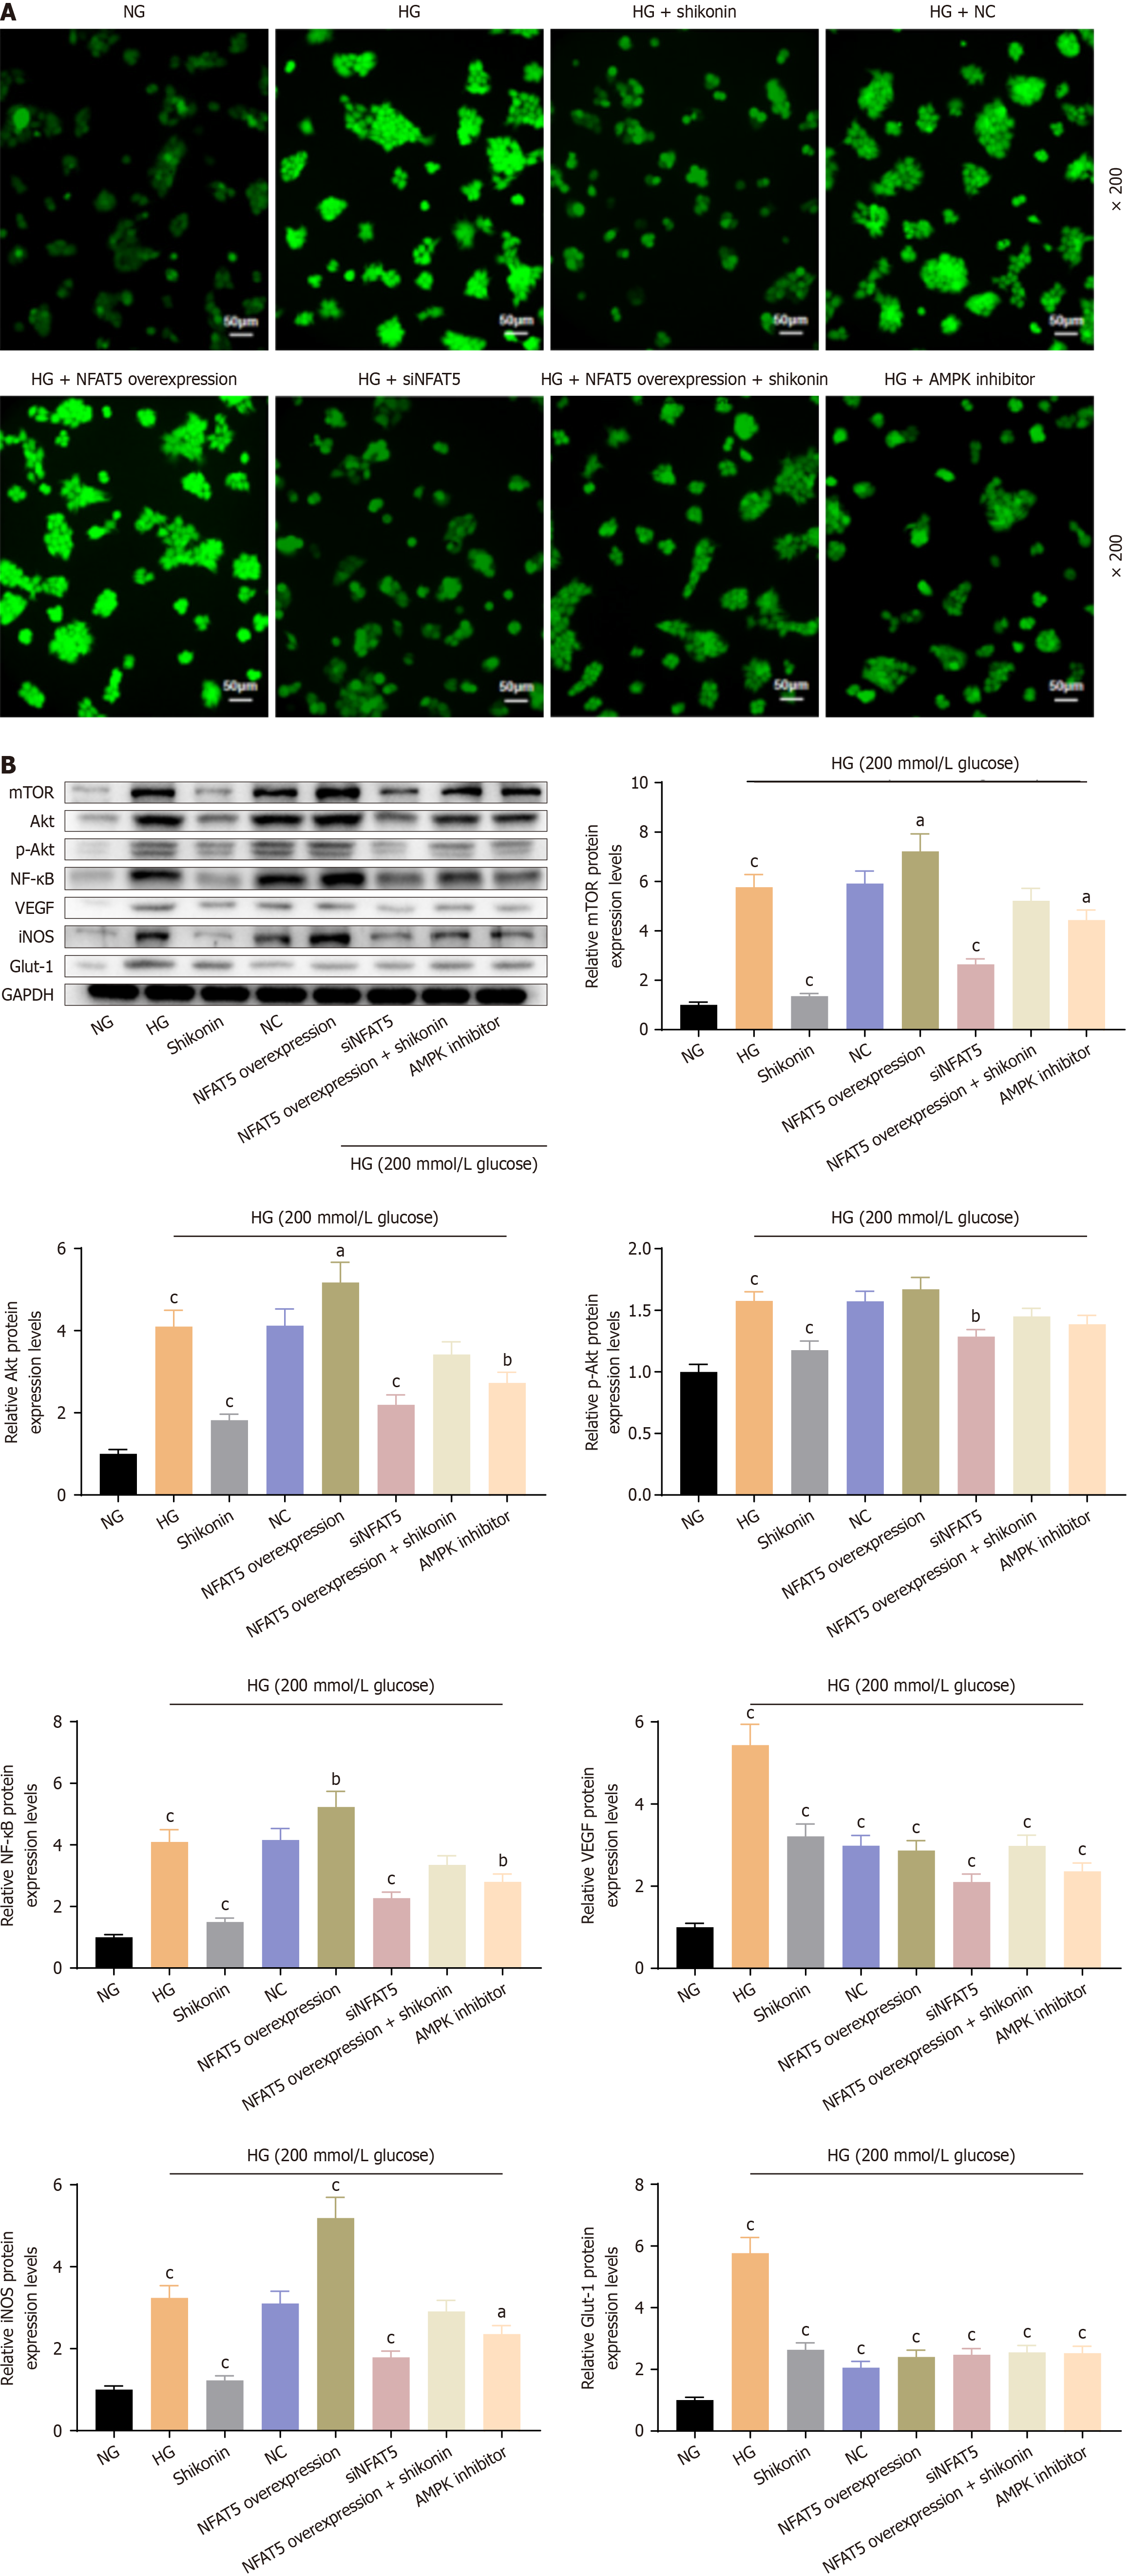
Figure 5 Impact of NFAT5 and AMPK inhibitors on reactive oxygen species and protein expression in the NFAT5/AMPK pathway.
A: Effect of NFAT5 and AMPK inhibitors on the fluorescence expression of reactive oxygen species; B: The expressions of protein (mTOR, Akt, p-Akt, NF-KB, VEGF, iNOS, Glut-1) via NFAT5/AMPK pathway. aP < 0.05, bP < 0.01, cP < 0.001.
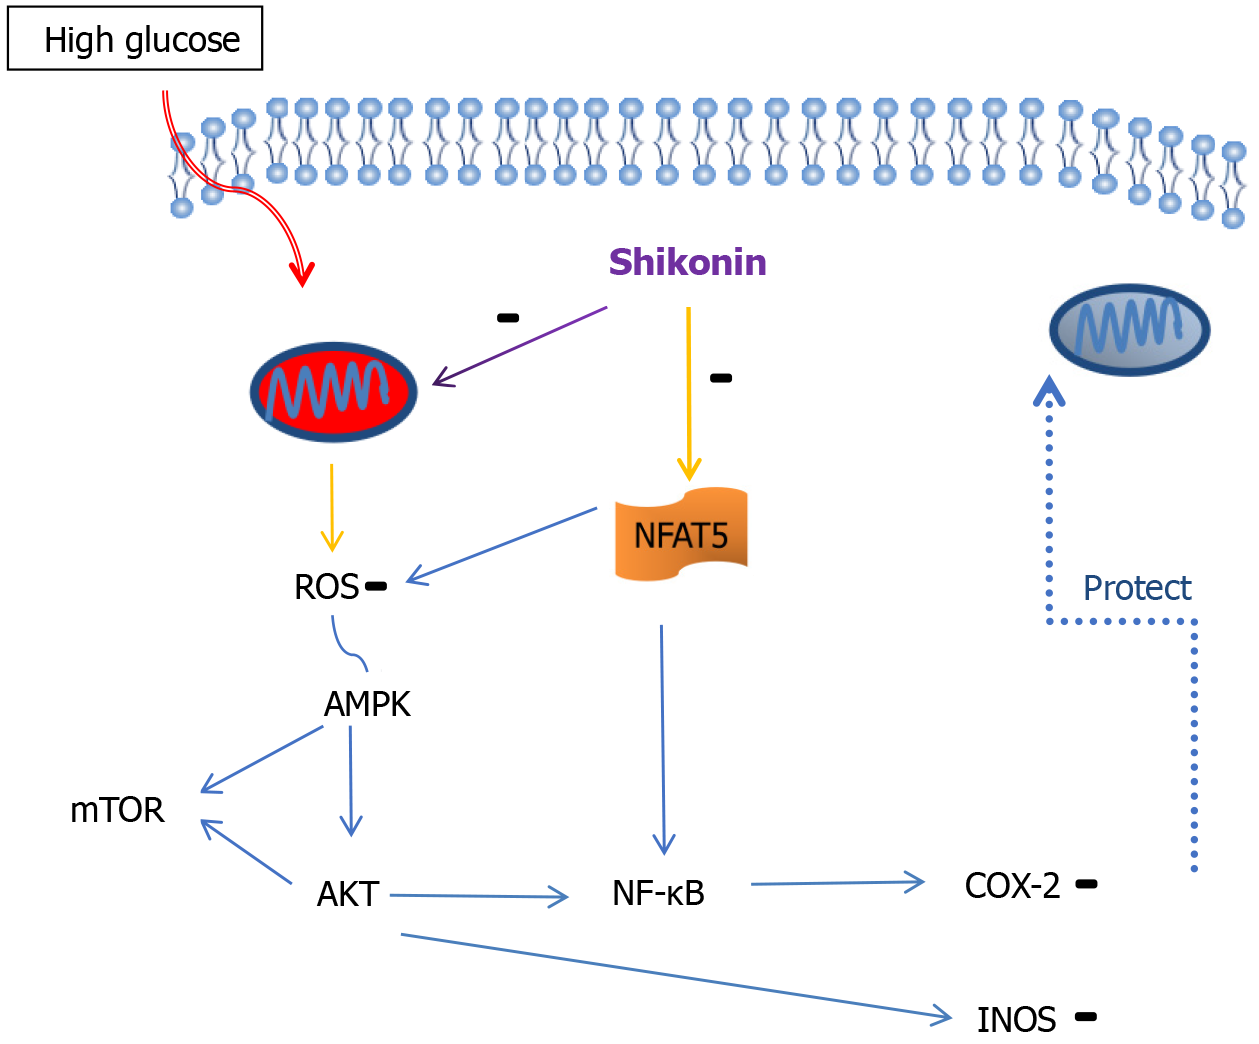
Figure 6 Shikonin protects mitochondria through NFAT5/AMPK pathway.
- Citation: Cen LS, Cao Y, Zhou YM, Guo J, Xue JW. Shikonin protects mitochondria through the NFAT5/AMPK pathway for the treatment of diabetic wounds. World J Diabetes 2024; 15(12): 2338-2352
- URL: https://www.wjgnet.com/1948-9358/full/v15/i12/2338.htm
- DOI: https://dx.doi.org/10.4239/wjd.v15.i12.2338


