Copyright
©The Author(s) 2024.
World J Diabetes. Dec 15, 2024; 15(12): 2322-2337
Published online Dec 15, 2024. doi: 10.4239/wjd.v15.i12.2322
Published online Dec 15, 2024. doi: 10.4239/wjd.v15.i12.2322
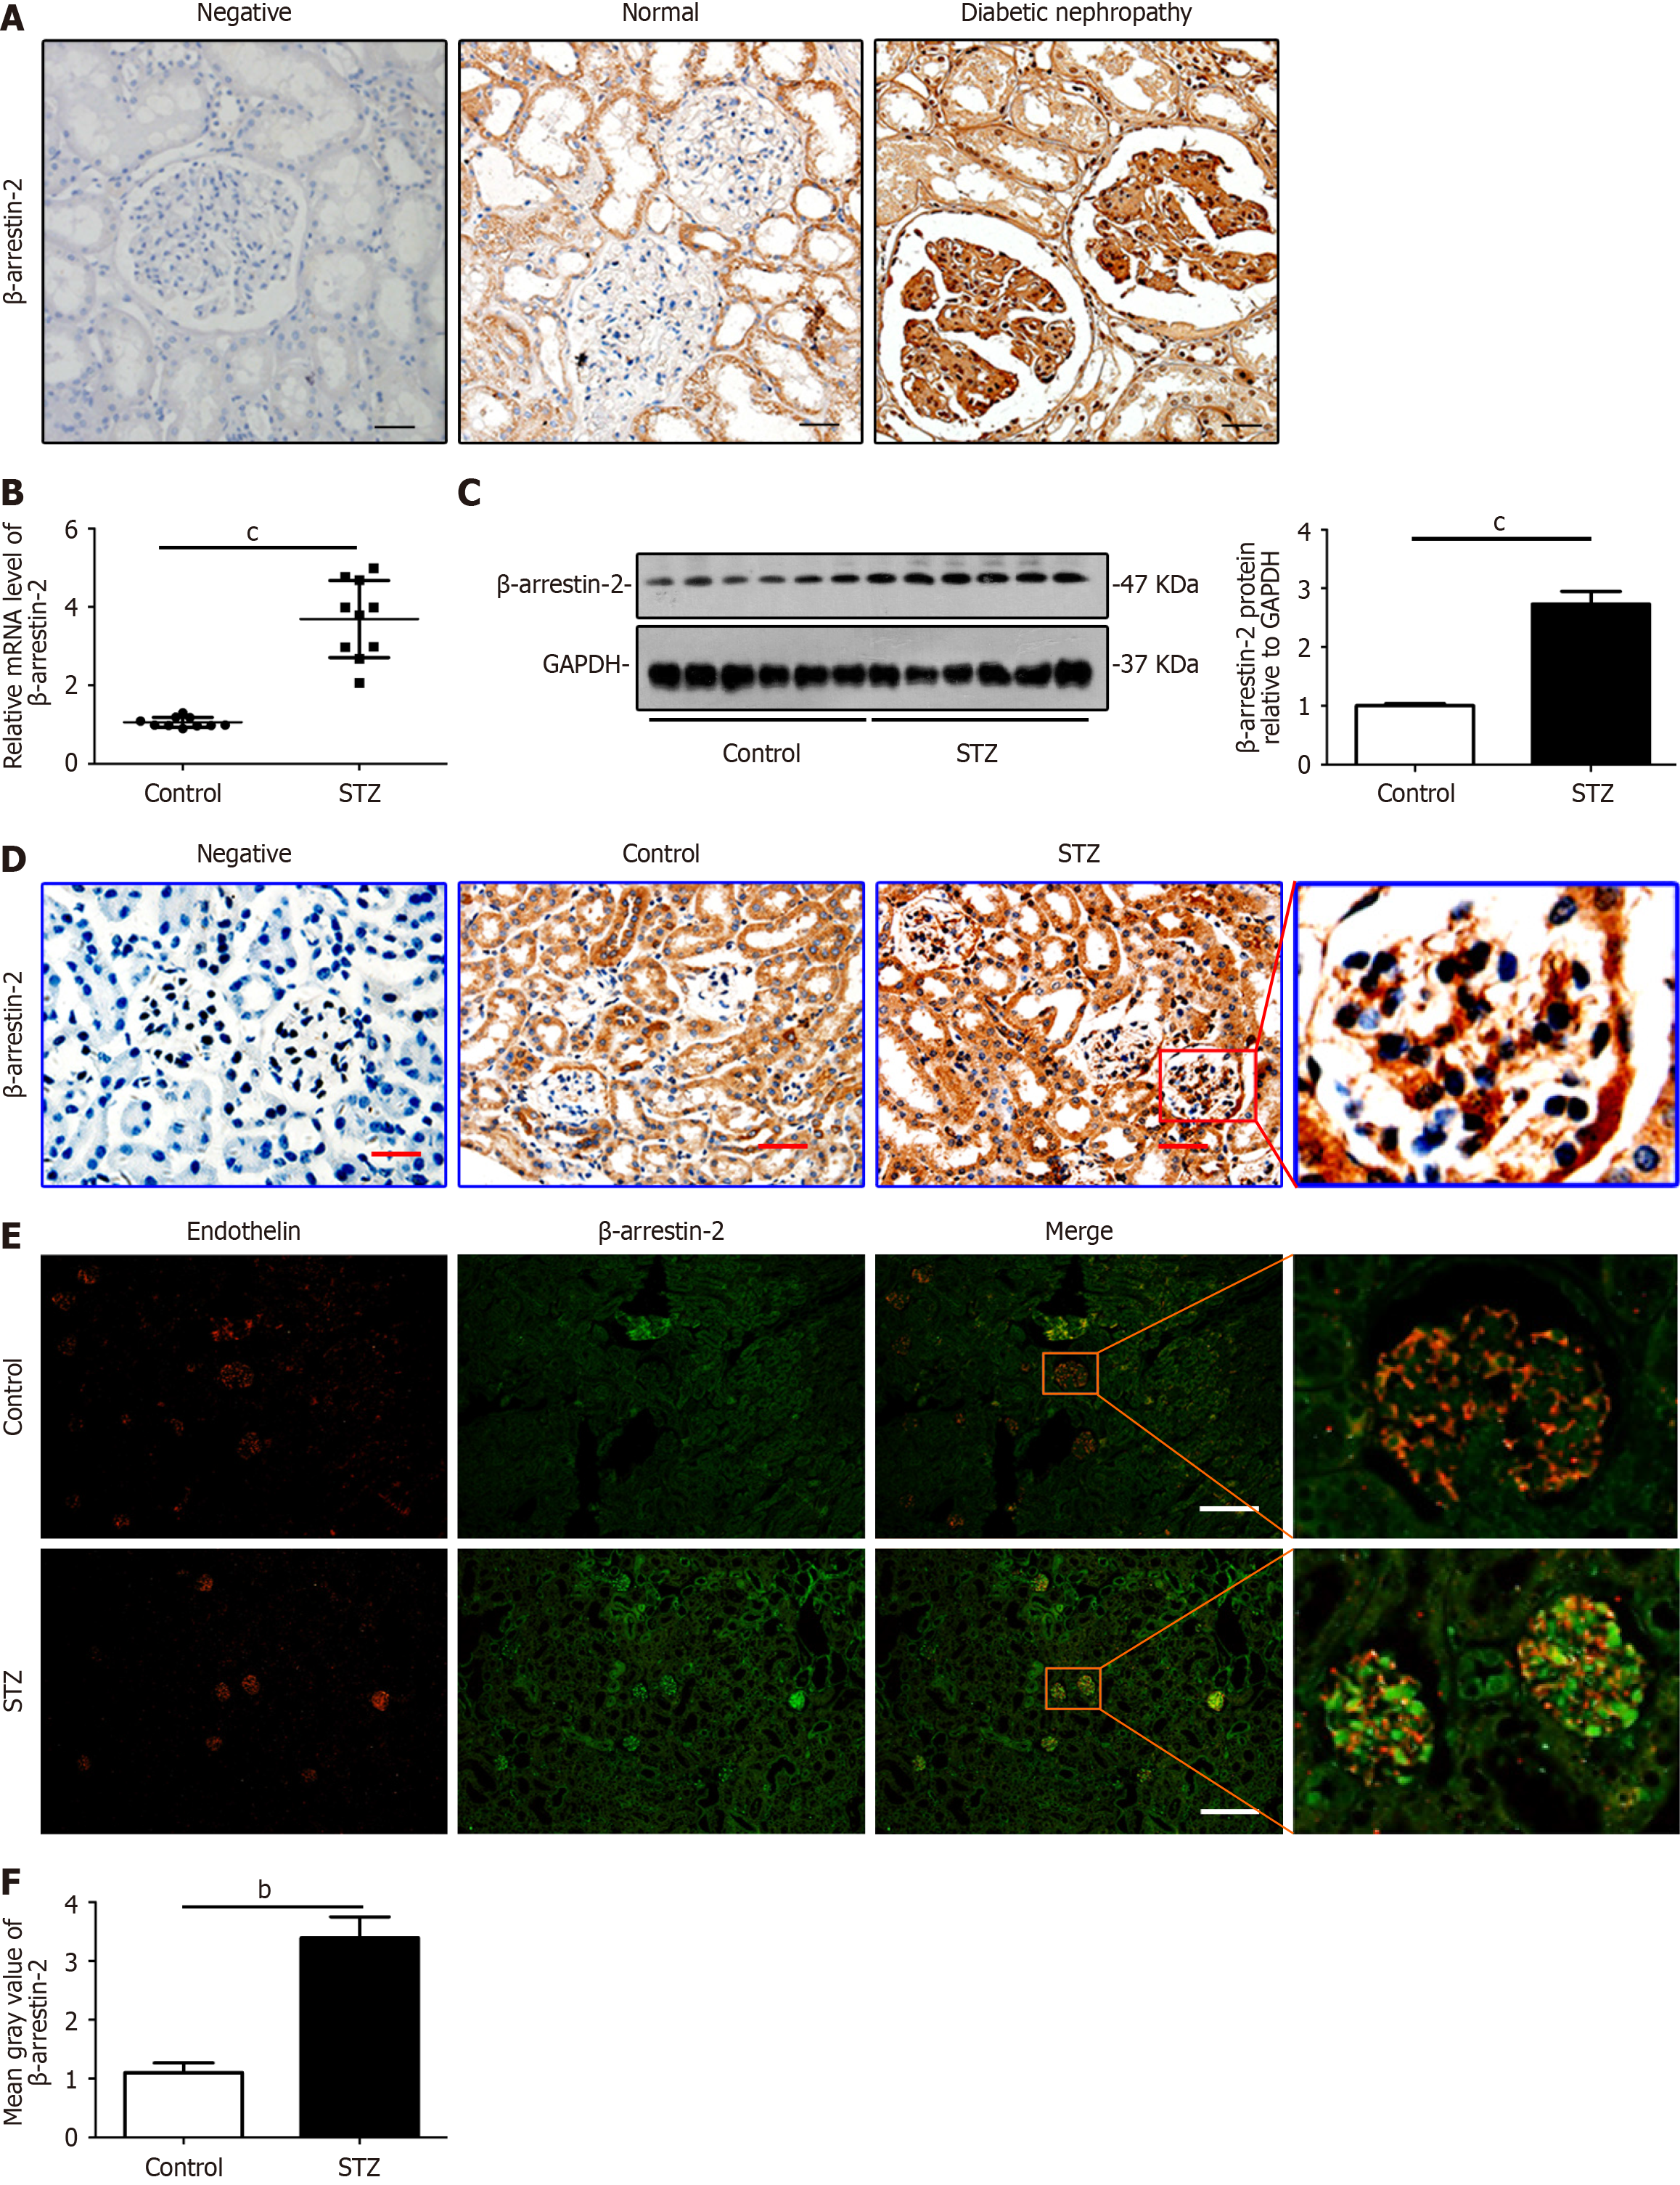
Figure 1 β-Arrestin-2 is increased significantly in renal biopsies from patients with diabetic nephropathy and glomerular endothelial cells from mice with diabetic nephropathy.
A: Images of immunohistochemical (IHC) staining to detect the expression of β-arrestin-2 in paraffin sections of human renal tissue from normal controls and patients with diabetic nephropathy (DN) (black bars = 10 μm, n = 5); B: Relative mRNA levels of β-arrestin-2 in the renal cortex of DN mice (mean ± SD, cP < 0.001 vs control, n = 8); C: The expression of β-arrestin-2 in the renal cortex of DN mice was analyzed by immunoblotting (cP < 0.001 vs control, n = 8); D: Representative images of IHC staining to detect the expression of β-arrestin-2 in paraffin sections of the kidneys from control and DN mice (red bars = 20 μm, n = 8); E: Detection of β-arrestin-2 expression in glomerular endothelial cells (GENCs) in streptozotocin (STZ)-induced DN mouse model by immunofluorescence double labeling: Endothelin (red, mark protein in GENCs) and β-arrestin-2 (green) (white bars = 50 μm, n = 8); F: Quantifications showing expression of β-arrestin-2 in the kidneys from different groups of mice (bP < 0.01 vs control, n = 8).
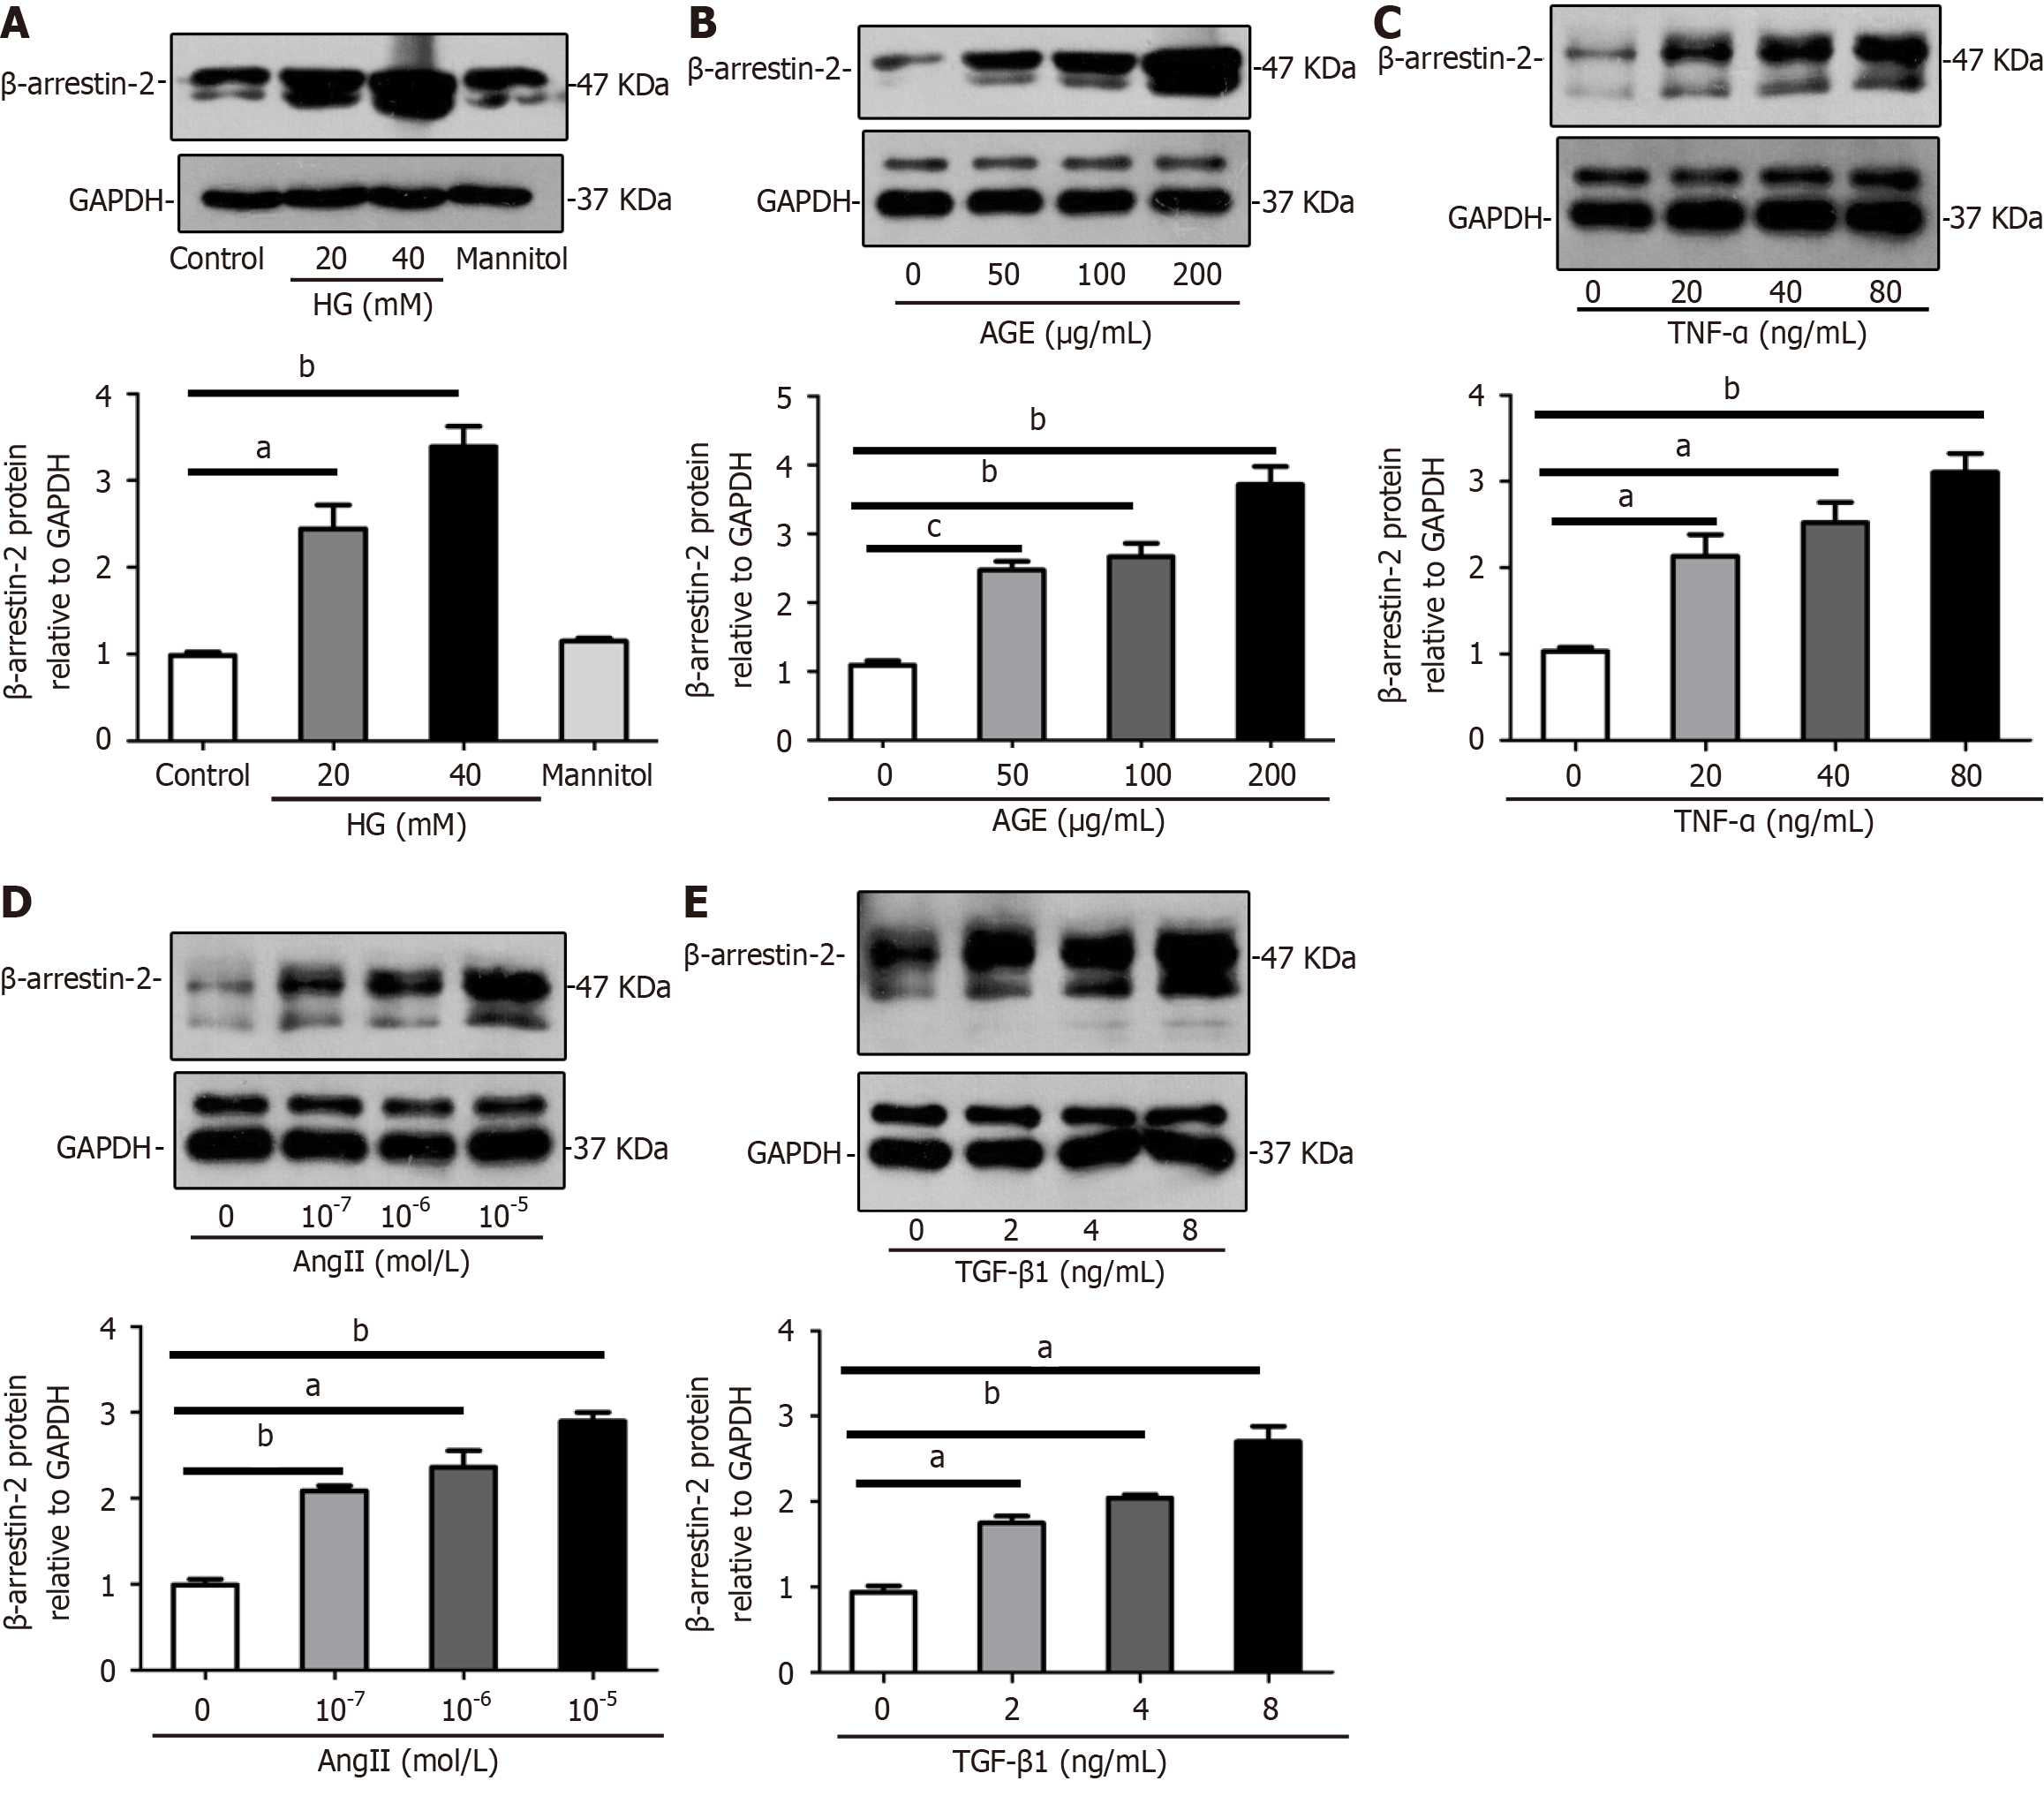
Figure 2 β-Arrestin-2 is upregulated in glomerular endothelial cells under high glucose levels and other stimuli in vitro.
A: Representative images and summarized data showing increased expression of β-arrestin-2 in glomerular endothelial cells (GENCs) with high glucose (HG) (concentrations of 20 and 40 mmol/L; 40 mmol/L mannitol was used as osmolarity control) stimulation for 24 h by Western blotting (aP < 0.05 vs control, bP < 0.01 vs control, n = 6); B: Representative images and summarized data showing upregulation of β-arrestin-2 in GENCs treated with advanced glycation end products (0, 50, 100, and 200 μg/mL) for 24 h by immunoblotting (bP < 0.01 vs control, cP < 0.001 vs control, n = 6); C: Representative images and summarized data showing increased expression of β-arrestin-2 in GENCs treated with tumor necrosis factor-α (0, 20, 40, and 80 ng/mL) for 24 h by Western blotting (aP < 0.05 vs control, bP < 0.01 vs control, n = 6); D: Representative images and summarized data showing increased β-arrestin-2 expression in angiotensin II (Ang II: 0, 10-7, 10-6, and 10-5 mol/L) treated GENCs for 24 h by immunoblotting (aP < 0.05 vs control, bP < 0.01 vs control, n = 6); E: Images and summarized data reflecting upregulation of β-arrestin-2 in GENCs treated with transforming growth factor-β1 (0, 2, 4, and 8 ng/mL) for 24 h by Western blotting (aP < 0.05 vs control, bP < 0.01 vs control, n = 6). TGF-β1: Transforming growth factor-β1; HG: High glucose; AGE: Advanced glycation end product; TNF-α: Tumor necrosis factor-α.
Figure 3 Knockdown of β-arrestin-2 by siRNA ameliorates high glucose induced glomerular endothelial cell injury and apoptosis.
A: Images showing efficiency of silencing β-arrestin-2 with small interfering RNA (siRNA) by Western blotting (aP < 0.05 vs control, n = 6); B: Representative images showing effect of β-arrestin-2 knockdown on expression of occludin, ZO-1, and eNOS in high glucose (HG)-treated glomerular endothelial cell (GENCs) by Western blotting (bP < 0.01 vs scramble/control, dP < 0.05 vs scramble/HG treatment, n = 6); C: Immunoblotting images showing effect of β-arrestin-2 knockdown on expression of apoptosis related proteins Bcl-2 and Bax in HG-treated GENCs (aP < 0.05 vs scramble/control, cP < 0.001 vs scramble/control, dP < 0.05 vs scramble/HG treatment, n = 6); D: Immunoblotting images showing effect of β-arrestin-2 knockdown on expression of cleaved caspase 3 and caspase 3 in GENCs with HG treatment (cP < 0.001 vs scramble/control, eP < 0.01 vs scramble/HG treatment, n = 6); E: Flow cytometric images showing decreased apoptosis of GENCs with HG treatment by knockdown of β-arrestin-2; F: Summarized flow cytometric data showing reduced apoptosis of GENCs with HG treatment by silencing β-arrestin-2 (bP < 0.01 vs scramble/control, dP < 0.05 vs scramble/HG treatment, n = 6). HG: High glucose; siRNA: Small interfering RNA.
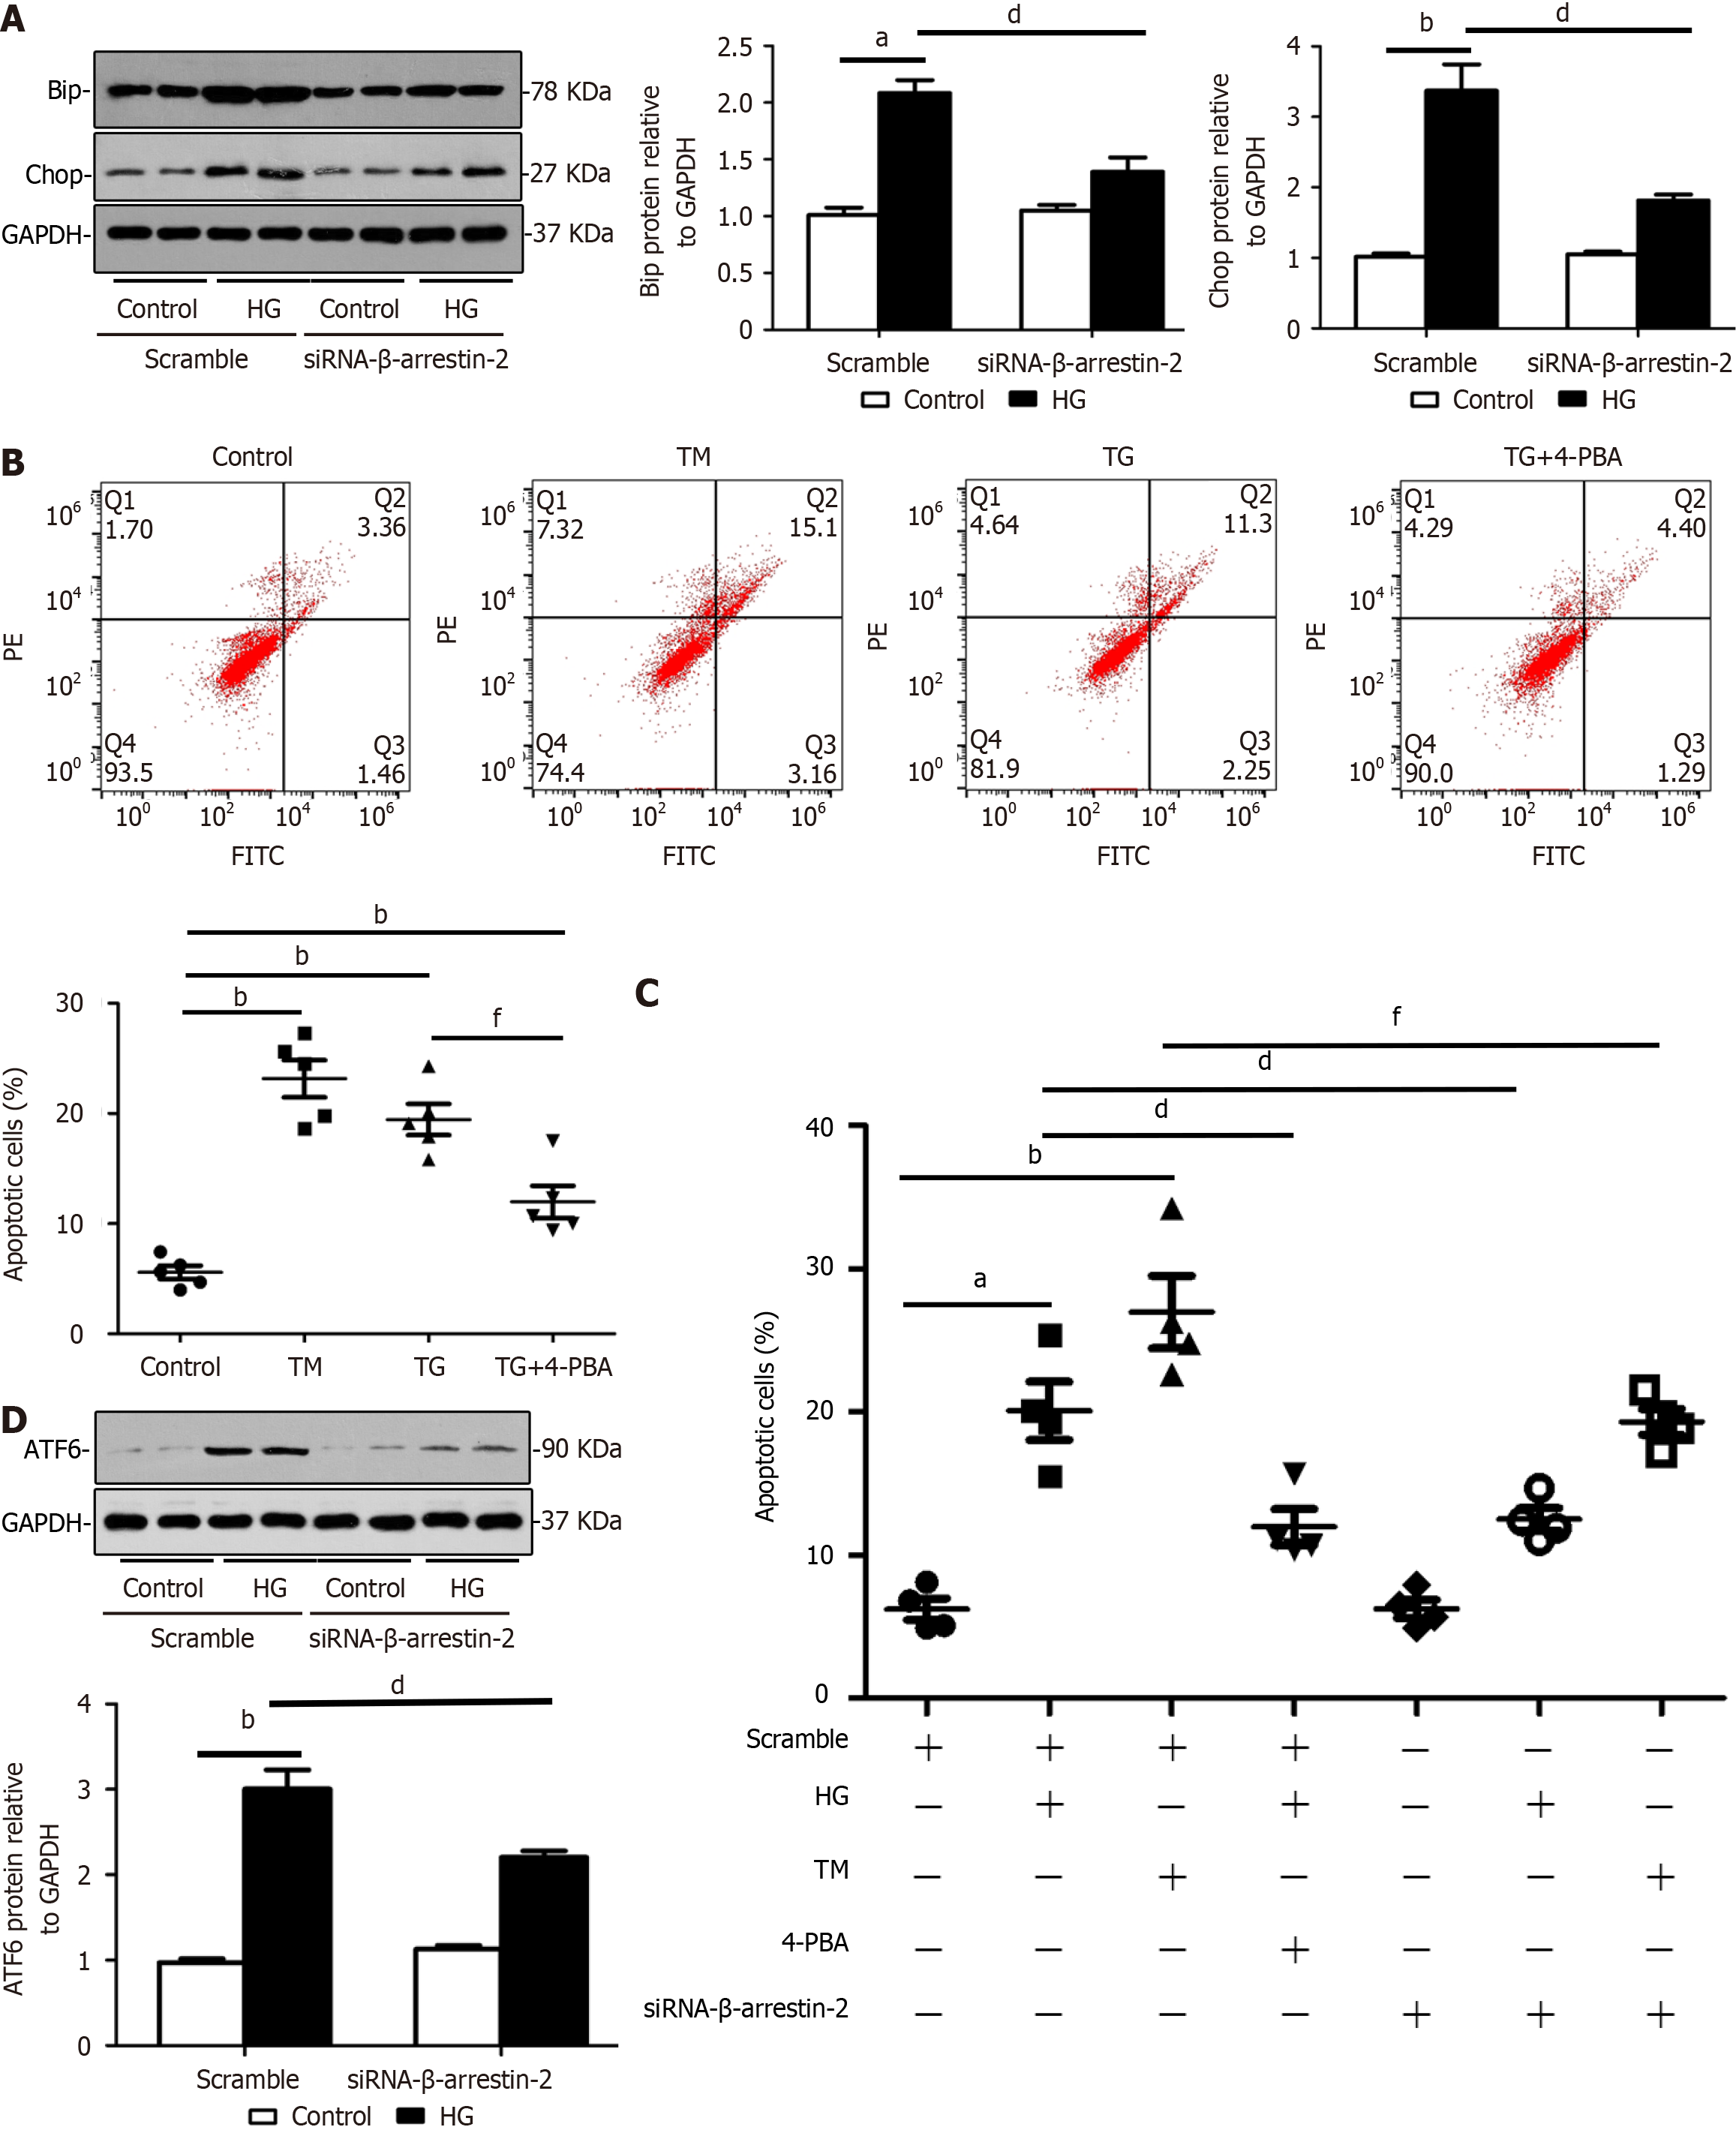
Figure 4 Knockdown of β-arrestin-2 reduces endoplasmic reticulum stress and apoptosis of glomerular endothelial cells in high glucose treatments by decreasing expression of activating transcription factor 6.
A: Representative images and summarized data showing that knockdown of β-arrestin-2 inactivated endoplasmic reticulum (ER) stress by downregulating expression of BiP and CHOP in HG-treated glomerular endothelial cells (GENCs) by Western blotting (aP < 0.05 vs scramble/control, bP < 0.01 vs scramble/control, dP < 0.05 vs scramble/HG treatment, n = 6); B: Flow cytometric analysis showing that the ER stress activators tunicamycin (TM) and thapsigargin (TG) induced GENC apoptosis and the inhibitor 4-phenyl butyric acid (4-PBA) reduced GENC apoptosis (bP < 0.01 vs scramble/control, fP < 0.05 vs TM/TG treatment, n = 5); C: Summarized flow cytometric data showing apoptosis of GENCs under different stimuli (aP < 0.05 vs scramble/control, bP < 0.01 vs scramble/control, dP < 0.05 vs scramble/HG treatment, fP < 0.05 vs TM/TG treatment, n = 4); D: Western blotting images showing effects of β-arrestin-2 knockdown on expression of ATF6 in GENCs under HG treatment (bP < 0.01 vs scramble/control, dP < 0.05 vs scramble/HG treatment, n = 6). HG: High glucose; siRNA: Small interfering RNA; TM: Tunicamycin; TG: Thapsigargin; 4-PBA: 4-Phenyl butyric acid.
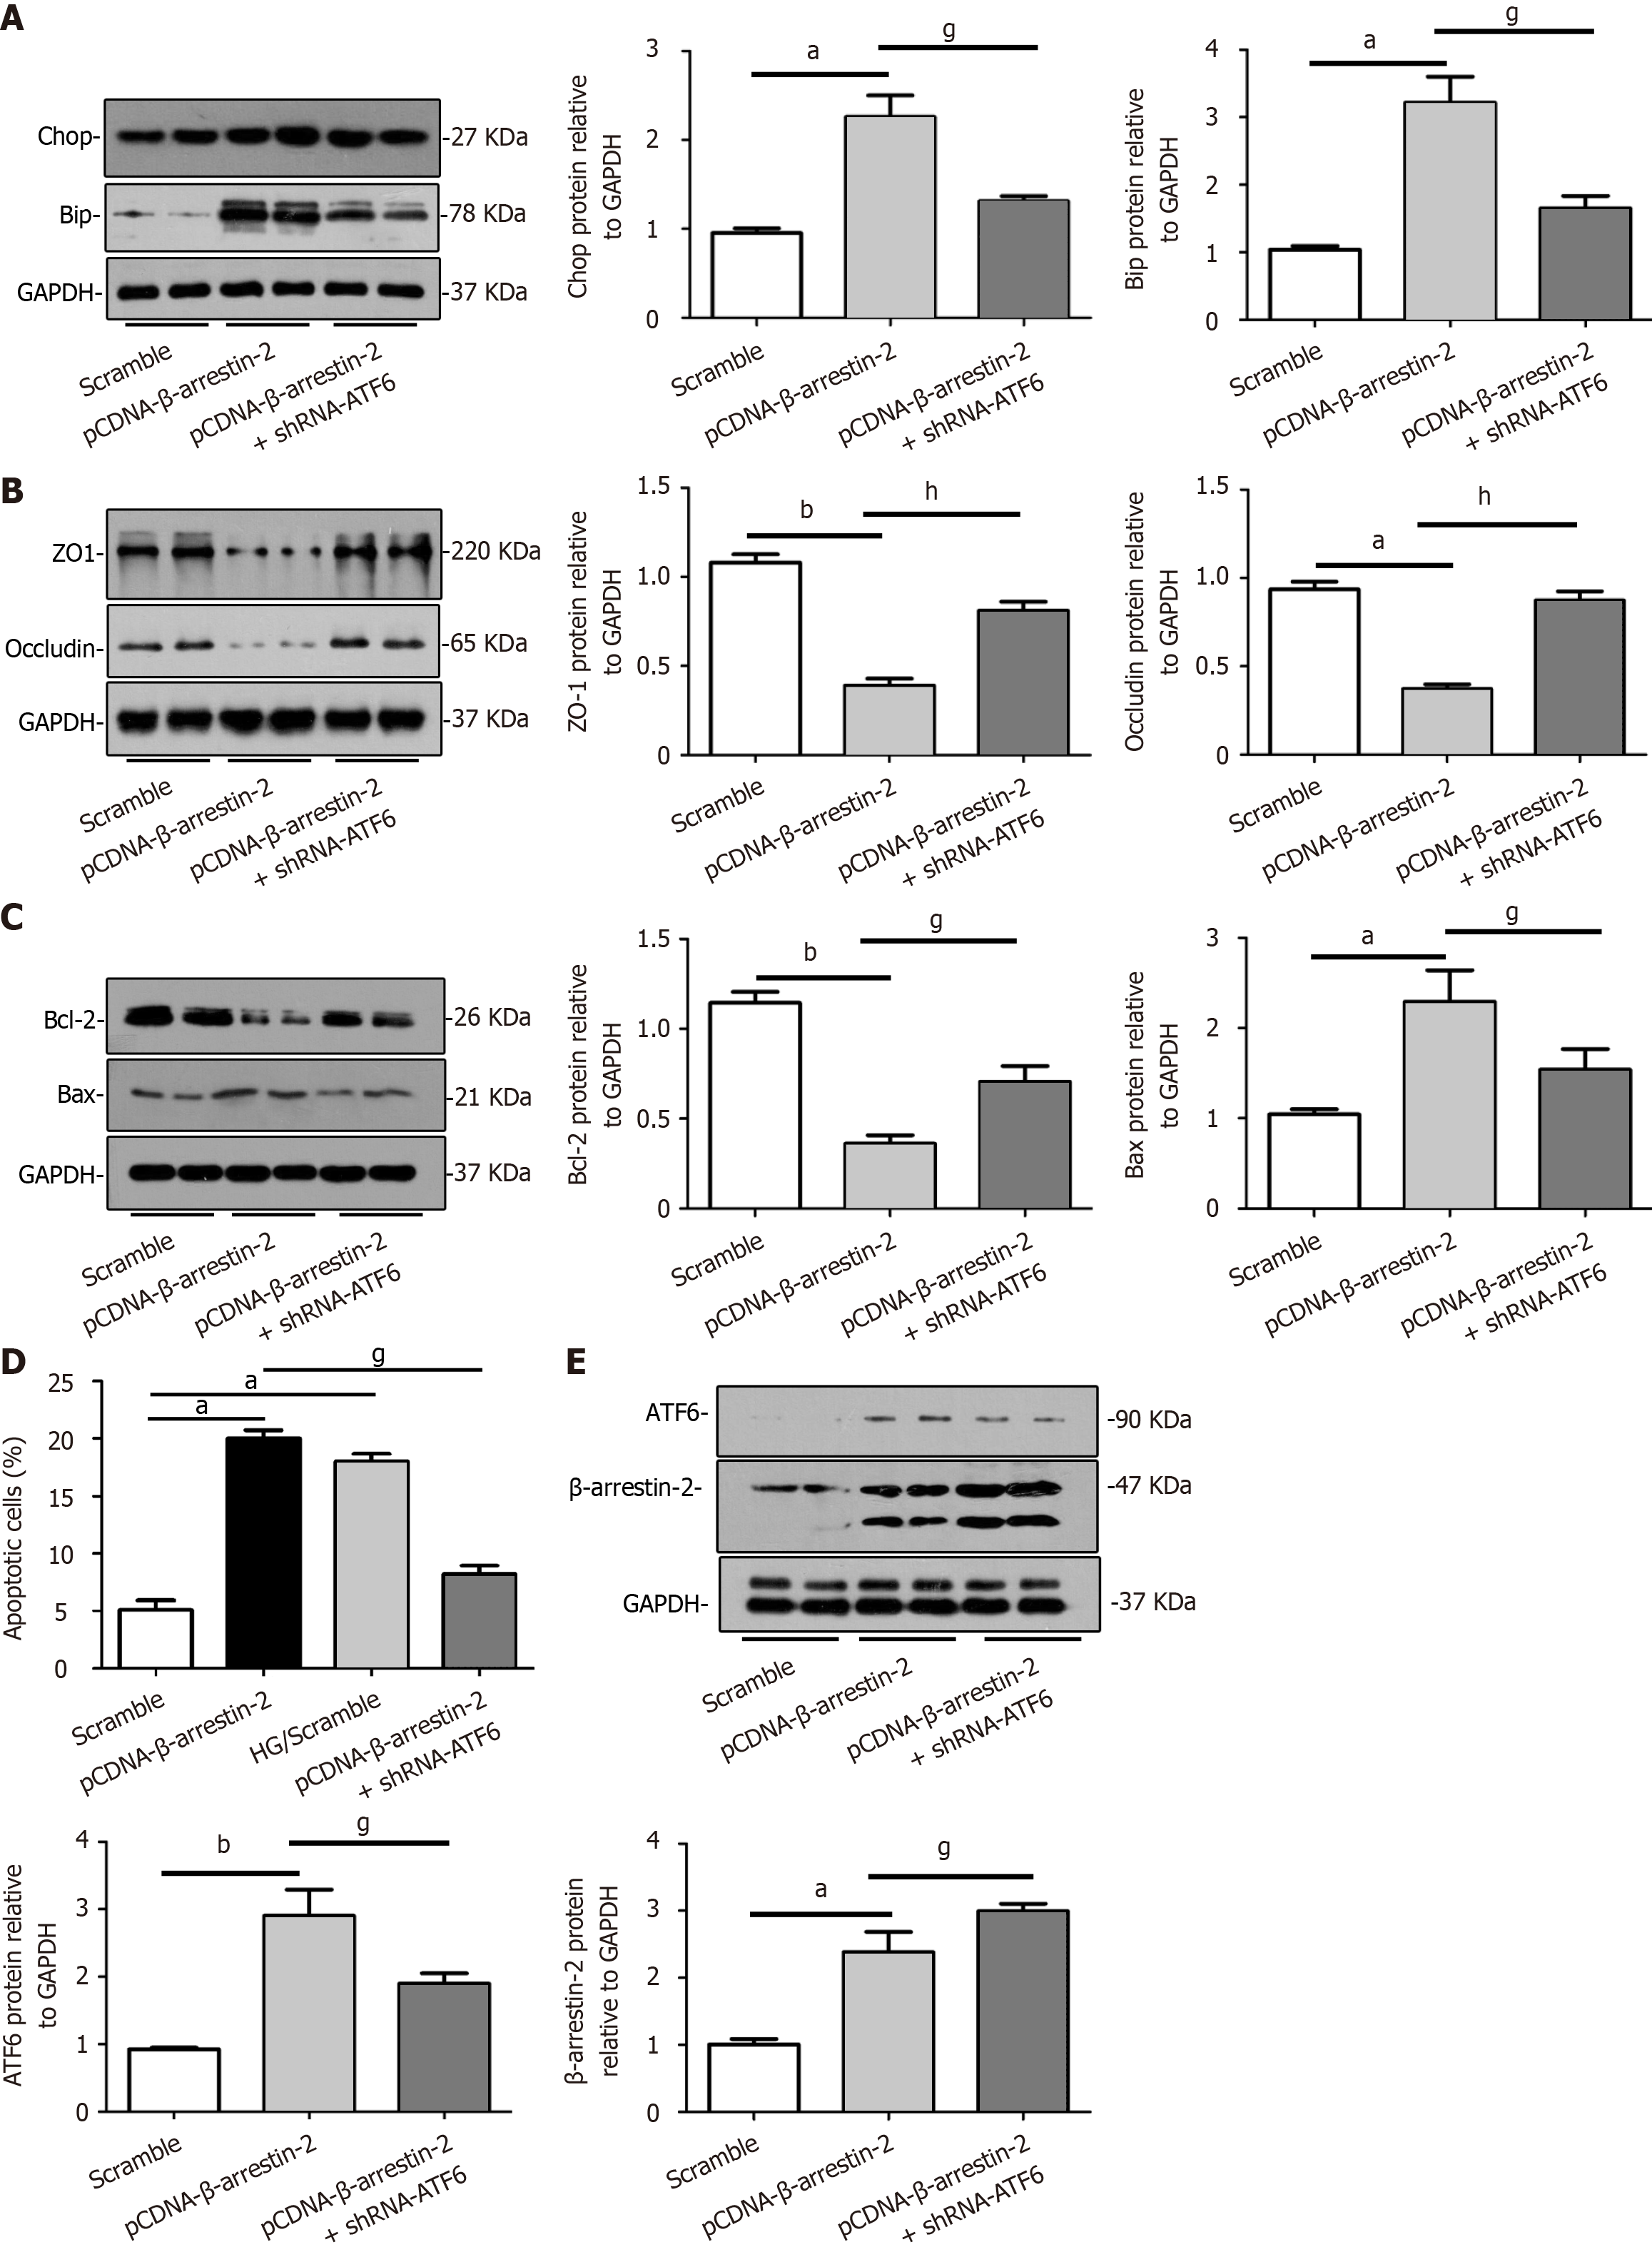
Figure 5 Overexpression of β-Arrestin-2 aggravates glomerular endothelial cell injury and apoptosis by activating endoplasmic reticulum stress through upregulation of activating transcription factor 6.
A: Representative images showing that overexpression of β-arrestin-2 enhanced expression of BiP and CHOP in glomerular endothelial cells (GENCs), which could be blocked by knockdown of activating transcription factor 6 (ATF6) (aP < 0.05 vs scramble/control, gP < 0.05 vs pCDNA-β-arrestin-2 treatment, n = 6); B: Representative images showing that overexpression of β-arrestin-2 reduced expression of ZO-1 and Occludin in GENCs, which could be recovered by knockdown of ATF6 in GENCs (aP < 0.05 vs scramble/control, bP < 0.01 vs scramble/control, hP < 0.01 vs pCDNA-β-arrestin-2 treatment, n = 6); C: Representative images showing that overexpression of β-arrestin-2 promoted apoptosis related protein expression in GENCs, which was blocked by knockdown of ATF6 (aP < 0.05 vs scramble/control, bP < 0.01 vs scramble/control, gP < 0.05 vs pCDNA-β-arrestin-2 treatment, n = 6); D: Summarized flow cytometric data showing that overexpression of β-arrestin-2 aggravated apoptosis of GENCs, which was inhibited by knockdown of ATF6 (aP < 0.05 vs scramble/control, gP < 0.05 vs pCDNA-β-arrestin-2 treatment, n = 6); E: Representative Western blot images showing that overexpression of β-arrestin-2 upregulated expression of ATF6, but knockdown of ATF6 did not affect expression of β-arrestin-2 (aP < 0.05 vs scramble/control, bP < 0.01 vs scramble/control, gP < 0.05 vs pCDNA-β-arrestin-2 treatment, n = 6). ATF6: Activating transcription factor 6.
Figure 6 β-Arrestin-2 enhances expression of activating transcription factor 6 and promotes activating transcription factor 6 translocation into the nucleus of glomerular endothelial cells treated with high glucose.
A: Representative images and summarized data showing that knockdown of β-arrestin-2 reduced protein levels of BiP and CHOP, which was reversed by overexpression of activating transcription factor 6 (ATF6) [aP < 0.05 vs scramble/control, bP < 0.01 vs scramble/control, dP < 0.05 vs scramble/high glucose (HG) treatment, iP < 0.05 vs Si-β-arrestin-2/HG treatment]; B: Representative images and summarized data showing that knockdown of β-arrestin-2 recovered protein levels of ZO-1 and Occludin, which was reversed by overexpression of ATF6 (aP < 0.05 vs scramble/control, dP < 0.05 vs scramble/HG treatment, iP < 0.05 vs Si-β-arrestin-2/HG treatment); C: Flow cytometric analysis showing that knockdown of β-arrestin-2 reduced apoptosis of glomerular endothelial cells treated with HG was reversed by overexpression of ATF6; D: Representative images and summarized data showing that knockdown of β-arrestin-2 reduced apoptosis related protein expression, which was reversed by overexpression of ATF6. Silencing of β-arrestin-2 decreased expression of ATF6, but overexpression of ATF6 did not change expression of β-arrestin-2 (aP < 0.05 vs scramble/control, dP < 0.05 vs scramble/HG treatment, iP < 0.05 vs Si-β-arrestin-2/HG treatment); E: Representative Western blot images and summarized data showing expression of cleaved ATF6 in the nucleus of cells under different stimuli (bP < 0.01 vs scramble/control, cP < 0.001 vs scramble/control, dP < 0.05 vs scramble/HG treatment, gP < 0.05 vs pCDNA-β-arrestin-2 treatment, iP < 0.05 vs Si-β-arrestin-2/HG treatment); F: Relative mRNA levels of GRP78 (aP < 0.05 vs scramble/control, bP < 0.01 vs scramble/control, dP < 0.05 vs scramble/HG treatment, fP < 0.05 vs TM/TG treatment, gP < 0.05 vs pCDNA-β-arrestin-2 treatment, iP < 0.05 vs Si-β-arrestin-2/HG treatment). ATF6: Activating transcription factor 6; HG: High glucose; TM: Tunicamycin; 4-PBA: 4-Phenyl butyric acid.
Figure 7 Adeno-associated virus injection induced gene silencing of β-arrestin-2 ameliorates renal injury in streptozotocin-induced diabetic nephropathy mice.
A: Relative mRNA levels of β-arrestin-2 in the renal cortex of mice after adeno-associated virus (AAV)-null (scramble) and AAV-shRNA-β-arrestin-2 (shRNA-β-arrestin-2) tail injection (mean ± SD, aP < 0.05 vs scramble/control, bP < 0.01 vs scramble/control, dP < 0.05 vs scramble/streptozotocin (STZ) treatment, n = 8); B: Western blot images showing protein level of β-arrestin-2 in the renal cortex of mice after AAV-null (scramble) and AAV-shRNA-β-arrestin-2 (shRNA-β-arrestin-2) tail injection (mean ± SD, aP < 0.05 vs scramble/control, bP < 0.01 vs scramble/control, dP < 0.05 vs scramble/STZ treatment, n = 8); C: Urinary albumin-to-creatinine ratio (UACR) in different groups of mice (mean ± SD, aP < 0.05 vs scramble/control, bP < 0.01 vs scramble/control, dP < 0.05 vs scramble/STZ treatment, n = 8); D: Periodic-acid Schiff staining showing changes of glomerular structure in different groups of mice (black bars = 20 μm, n = 8); E: TUNEL staining showing apoptosis of cells in the kidneys in different groups of mice (white bars = 50 μm, n = 8); F: Representative images showing protein levels of eNOS, ZO-1, and Occludin in the renal cortex of different groups of mice (mean ± SD, aP < 0.05 vs scramble/control, dP < 0.05 vs scramble/STZ treatment, n = 8); G: Western blot analysis showing expression of endoplasmic reticulum stress related proteins BiP, CHOP, and activating transcription factor 6 in the renal cortex of different groups of mice (mean ± SD, aP < 0.05 vs scramble/control, dP < 0.05 vs scramble/STZ treatment, n = 8). ATF6: Activating transcription factor 6; STZ: Streptozotocin.
- Citation: Liu J, Song XY, Li XT, Yang M, Wang F, Han Y, Jiang Y, Lei YX, Jiang M, Zhang W, Tang DQ. β-Arrestin-2 enhances endoplasmic reticulum stress-induced glomerular endothelial cell injury by activating transcription factor 6 in diabetic nephropathy. World J Diabetes 2024; 15(12): 2322-2337
- URL: https://www.wjgnet.com/1948-9358/full/v15/i12/2322.htm
- DOI: https://dx.doi.org/10.4239/wjd.v15.i12.2322


