©The Author(s) 2024.
World J Diabetes. Nov 15, 2024; 15(11): 2220-2236
Published online Nov 15, 2024. doi: 10.4239/wjd.v15.i11.2220
Published online Nov 15, 2024. doi: 10.4239/wjd.v15.i11.2220
Figure 1 Effect of Tiliroside on fasting blood glucose level in experimental rats.
A-C: Fasting blood glucose (FBG) at day 7 (A), day 30 (B), and day 60 (C). Data are given as the mean ± SD of three individual values. All results were statistically assessed by one-way ANOVA and Tukey’s post hoc test. aP < 0.05 vs Control; bP < 0.01 vs STZ. FBG: Fasting blood glucose; GB: Glibenclamide; TIL: Tiliroside; STZ: Streptozotocin.
Figure 2 Effect of Tiliroside on initial and final body weight of experimental rats.
A: Initial body weight; B: Final body weight. Data are given as the mean ± SD of three individual values. All results were statistically assessed by one-way ANOVA and Tukey’s post hoc test. aP < 0.05 vs Control; bP < 0.01 vs STZ. GB: Glibenclamide; TIL: Tiliroside; STZ: Streptozotocin.
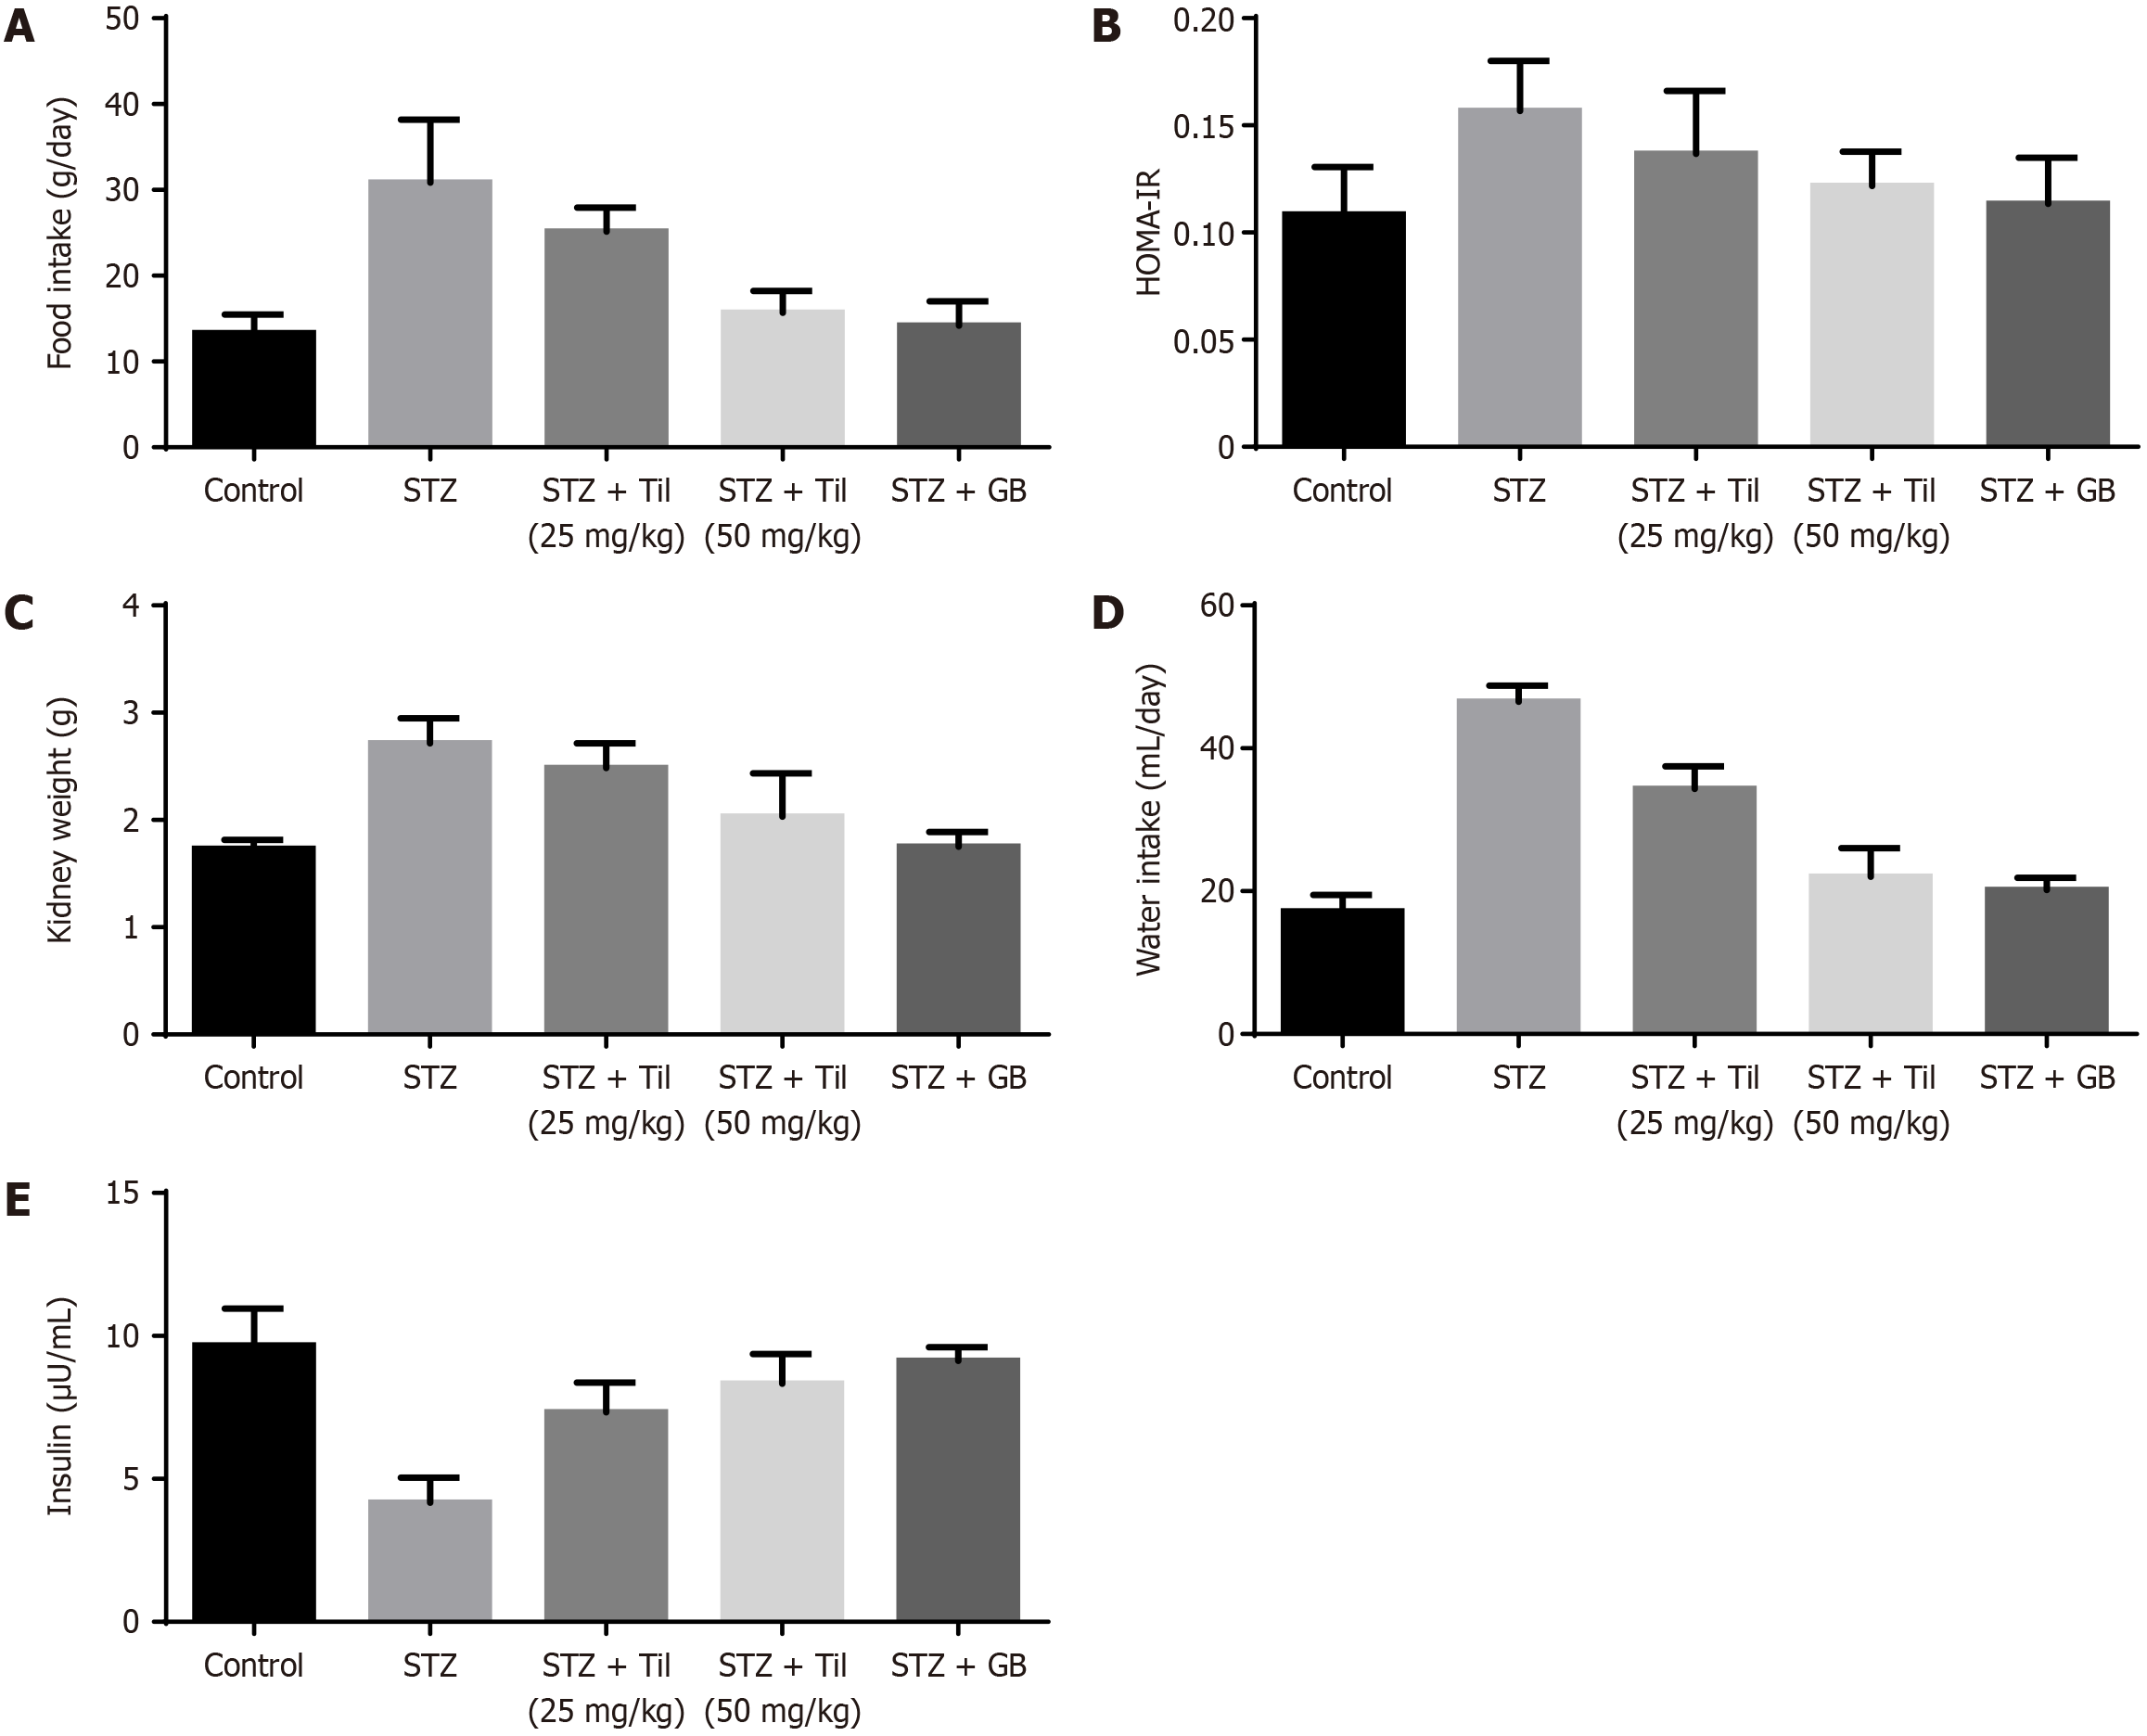
Figure 3 Tiliroside ameliorates hyperglycemia in diabetic rats.
A: Food intake; B: Homeostasis model assessment of insulin resistance; C: Kidney weight; D: Water intake; E: Insulin. All results were statistically assessed by one-way ANOVA and Tukey’s post hoc test. aP < 0.05 vs Control; bP < 0.01 vs STZ. GB: Glibenclamide; TIL: Tiliroside; STZ: Streptozotocin.
Figure 4 Effect of Tiliroside on renal biochemical markers in experimental rats.
A: Blood urea nitrogen (mmoL/L); B: Serum creatinine (µmoL/L); C: Uric acid (µmoL/L); D: N-acetyl glucosamine; E: U-mAlb (urinary microalbumin). All results were statistically assessed by one-way ANOVA and Tukey’s post hoc test. aP < 0.05 vs Control; bP < 0.01 vs STZ. GB: Glibenclamide; TIL: Tiliroside; STZ: Streptozotocin; BUN: Blood urea nitrogen; SCr: Serum creatinine; NAG: N-acetyl glucosamine.
Figure 5 Effect of Tiliroside on oxidative stress and antioxidant biomarkers in experimental rats.
A: Superoxide dismutase; B: Glutathione; C: Glutathione peroxidase; D: Reactive oxygen species; E: Advanced glycation end products. All results were statistically assessed by one-way ANOVA and Tukey’s post hoc test. aP < 0.05 vs Control; bP < 0.01 vs STZ. GPx: Glutathione peroxidase; SOD: Superoxide dismutase; GSH: Glutathione; GB: Glibenclamide; TIL: Tiliroside; STZ: Streptozotocin; ROS: Reactive oxygen species; AGEs: Advanced glycation end products.
Figure 6 Effect of Tiliroside on inflammatory markers in experimental rats.
A: Tumor necrosis factor-α; B: Interleukin-6; C: Interleukin-1β. All results were statistically assessed by one-way ANOVA and Tukey’s post hoc test. aP < 0.05 vs Control; bP < 0.01 vs STZ. GB: Glibenclamide; TIL: Tiliroside; STZ: Streptozotocin; TNF-α: Tumor necrosis factor-α; IL-6: Interleukin-6; IL-1β: Interleukin-1β.
Figure 7 Representation of 3D modeled structure and its validation using Ramachandran Plot.
A: The 3D modeled structure of transforming growth factor-beta 1 (UniProt ID: Q3UNK5); B: Ramachandran Plot.
Figure 8 Docking poses and interaction pattern of selected targets.
A: Fibronectin; B: Interaction with fibronectin; C: Interleukin-6 (IL-6); D: Interaction with IL-6; E: Tumor necrosis factor-α (TNF-α); F: Interaction with TNF-α; G: Interleukin-1β (IL-1β); H: Interaction with IL-1β; I: Transforming growth factor-beta 1 (TGF-β1); J: Interaction with TGF-β1. The docking pose of targets selected based on the binding affinity and RMSD ≤ 3.0 Å interacted with Tiliroside. TGF-β1: Transforming growth factor-beta 1; TNF-α: Tumor necrosis factor-α; IL-6: Interleukin-6; IL-1β: Interleukin-1β.
Figure 9 Effect of Tiliroside on renal fibrotic markers in experimental rats.
A: Fibronectin; B: Transforming growth factor-beta 1. All results were statistically assessed by one-way ANOVA and Tukey’s post hoc test. aP < 0.05 vs Control; bP < 0.01 vs STZ. GB: Glibenclamide; TIL: Tiliroside; STZ: Streptozotocin; FN: Fibronectin; TGF-β1: Transforming growth factor-beta 1.
Figure 10 LigPlot interactions of selected targets with Tiliroside in 2D visualization.
A: Fibronectin; B: Interleukin-6; C: Tumor necrosis factor-α; D: Interleukin-1β; E: Transforming growth factor-beta 1. TGF-β1: Transforming growth factor-beta 1; TNF-α: Tumor necrosis factor-α; IL-6: Interleukin-6; IL-1β: Interleukin-1β.
Figure 11 Effect of Tiliroside on renal histopathology of experimental rats.
Control rats exhibited a healthy tissue appearance with normal histoarchitectures (Group I). The streptozotocin (STZ)-provoked diabetic nephropathy (DN) animals showed shrinkage and necrosis of glomeruli (black arrows), renal tubular epithelial cell damage (blue arrows), edema (green arrows), and neutrophil infiltration (yellow arrows) (Group II). Tiliroside (Til) at three different doses i.e., 25, 50 mg/kg, and positive control Glibenclamide (GB) 600 μg/kg treated Diabetic nephropathy (DN) animals treated with Tiliroside (Til) at different doses, i.e., 25 and 50 mg/kg, and the positive control Glibenclamide (GB) 600 μg/kg demonstrated reduced histological changes such as reduced edema, glomerular and tubular damage, and neutrophil infiltration in renal tissues (Groups III and V, respectively). GB: Glibenclamide; TIL: Tiliroside; STZ: Streptozotocin.
- Citation: Shang Y, Yan CY, Li H, Liu N, Zhang HF. Tiliroside protects against diabetic nephropathy in streptozotocin-induced diabetes rats by attenuating oxidative stress and inflammation. World J Diabetes 2024; 15(11): 2220-2236
- URL: https://www.wjgnet.com/1948-9358/full/v15/i11/2220.htm
- DOI: https://dx.doi.org/10.4239/wjd.v15.i11.2220


