Copyright
©The Author(s) 2023.
World J Diabetes. Jun 15, 2023; 14(6): 846-861
Published online Jun 15, 2023. doi: 10.4239/wjd.v14.i6.846
Published online Jun 15, 2023. doi: 10.4239/wjd.v14.i6.846
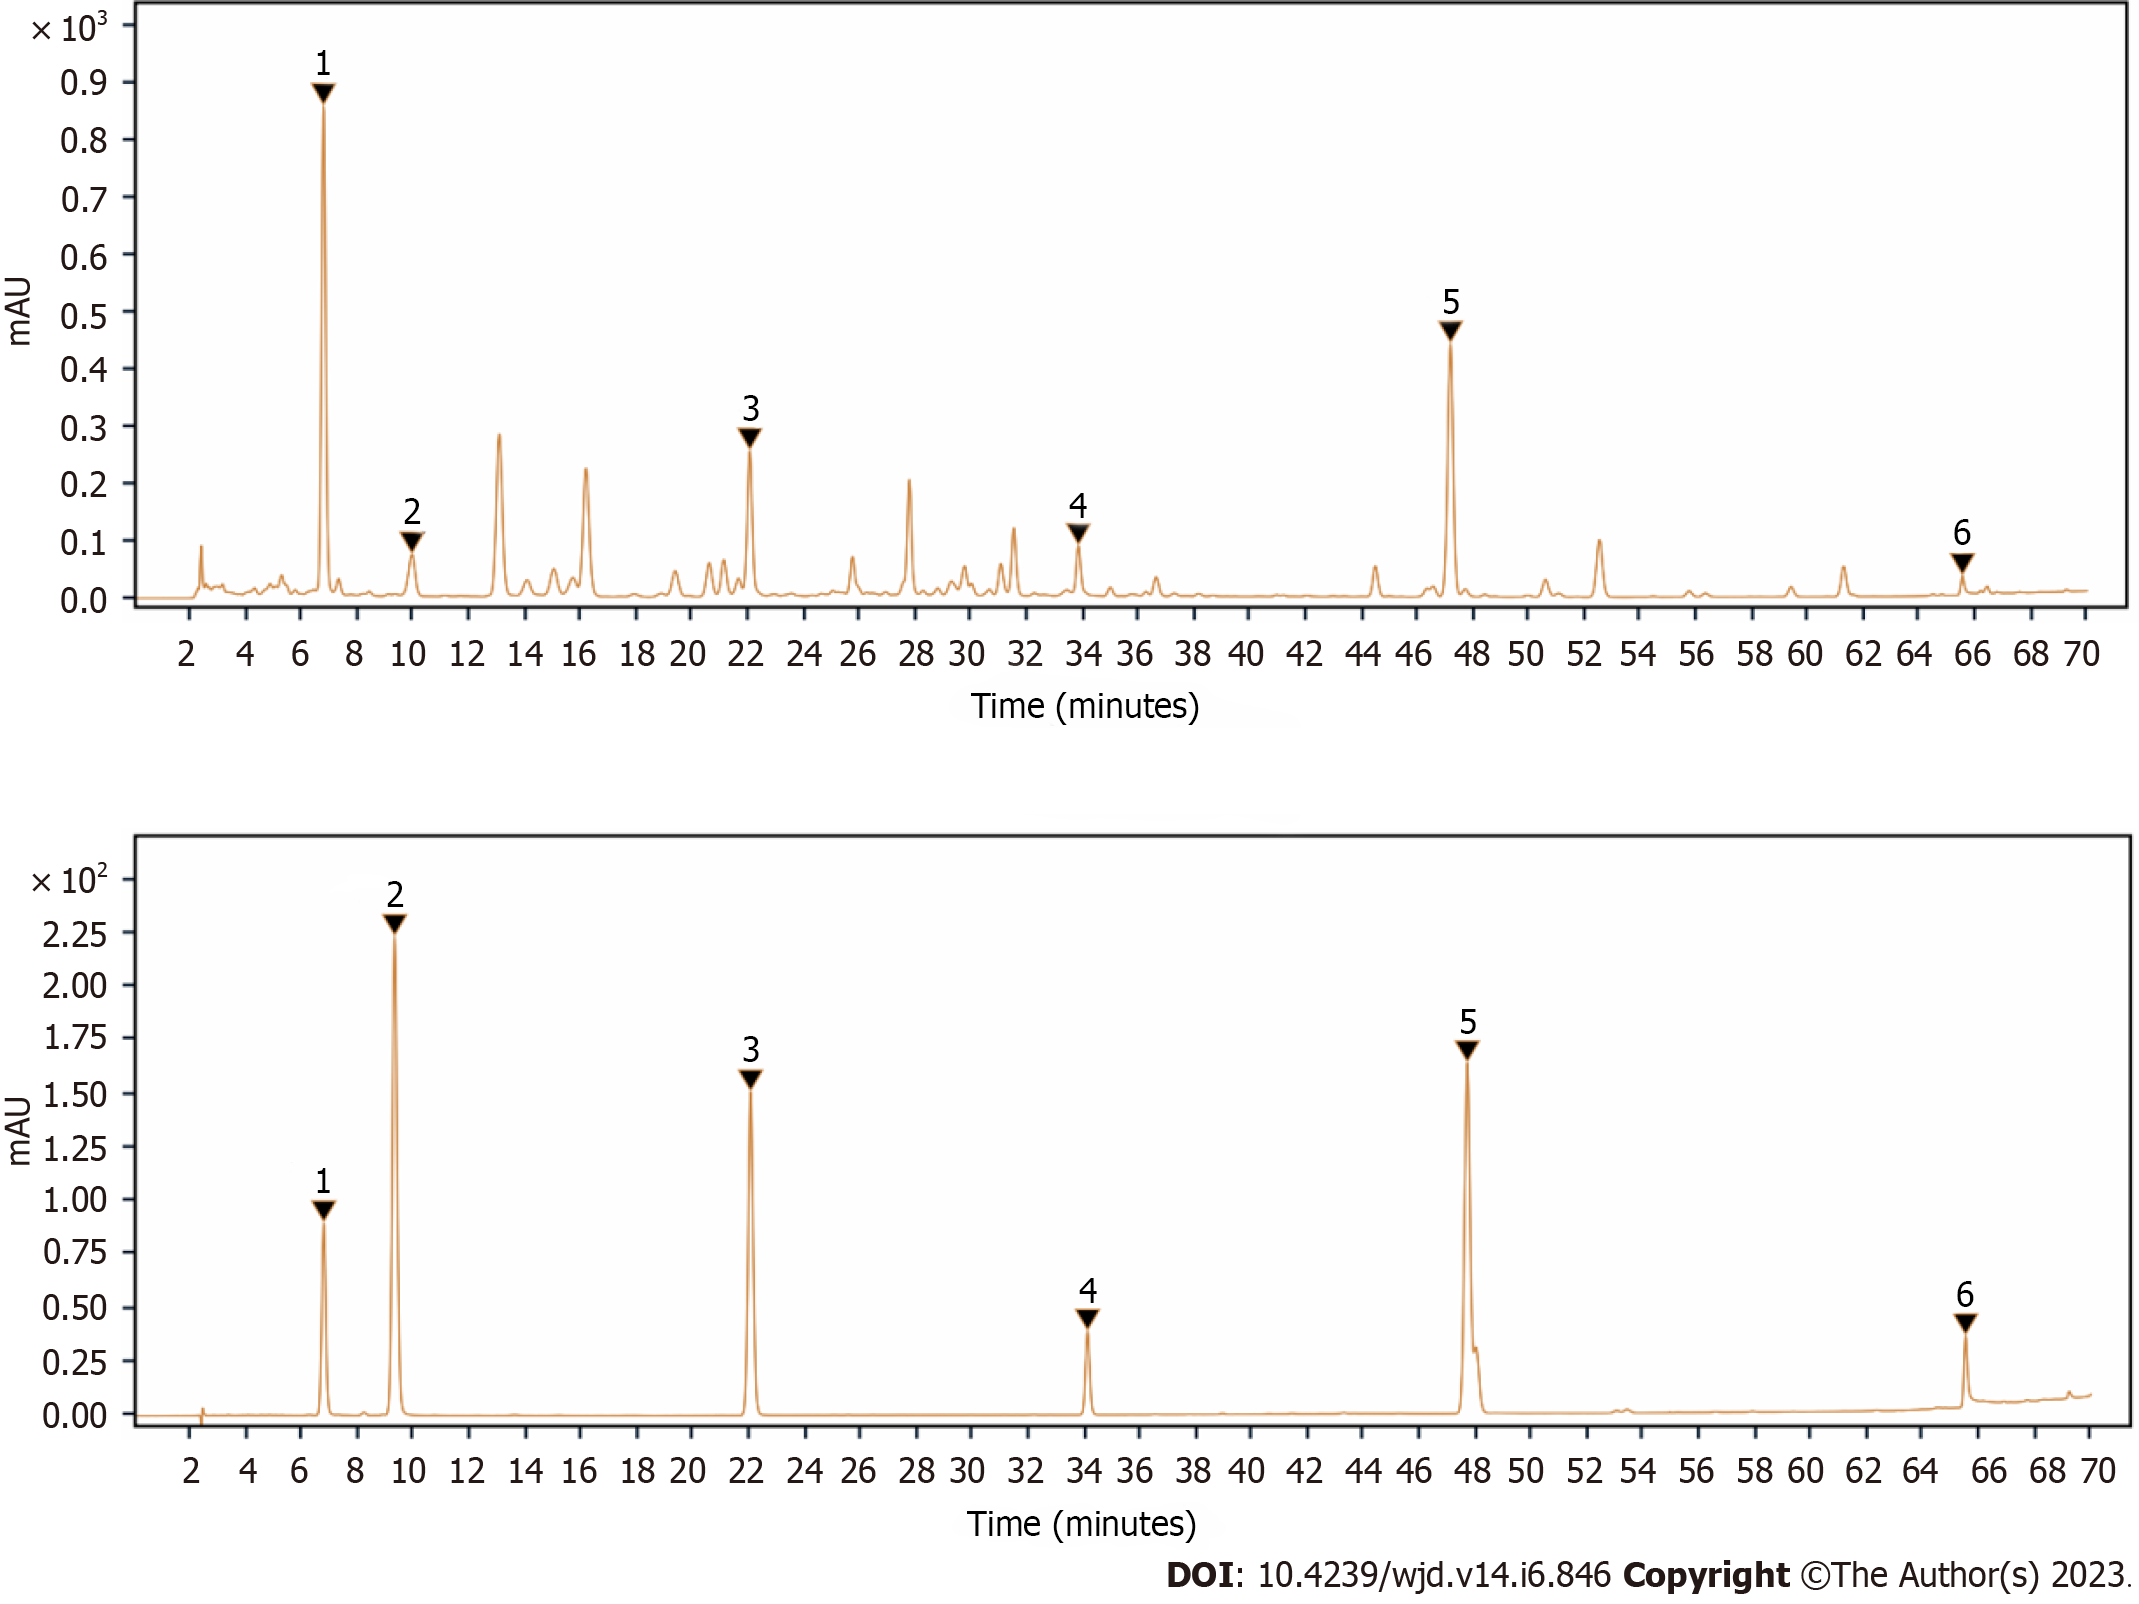
Figure 1 High performance liquid chromatography determination of the main compounds of Lomatogonium rotatum.
A: Chromatogram of Lomatogonium rotatum samples; B: Chromatogram of the mixture of reference chemicals. 1: Swertiamarin; 2: Sweroside; 3: Hesperetin; 4: Coumarin; 5: 1.7-dihydroxy-3, 8-dimethoxyl xanthone; 6: 1-hydroxy-2,3,5 trimethoxanthone.
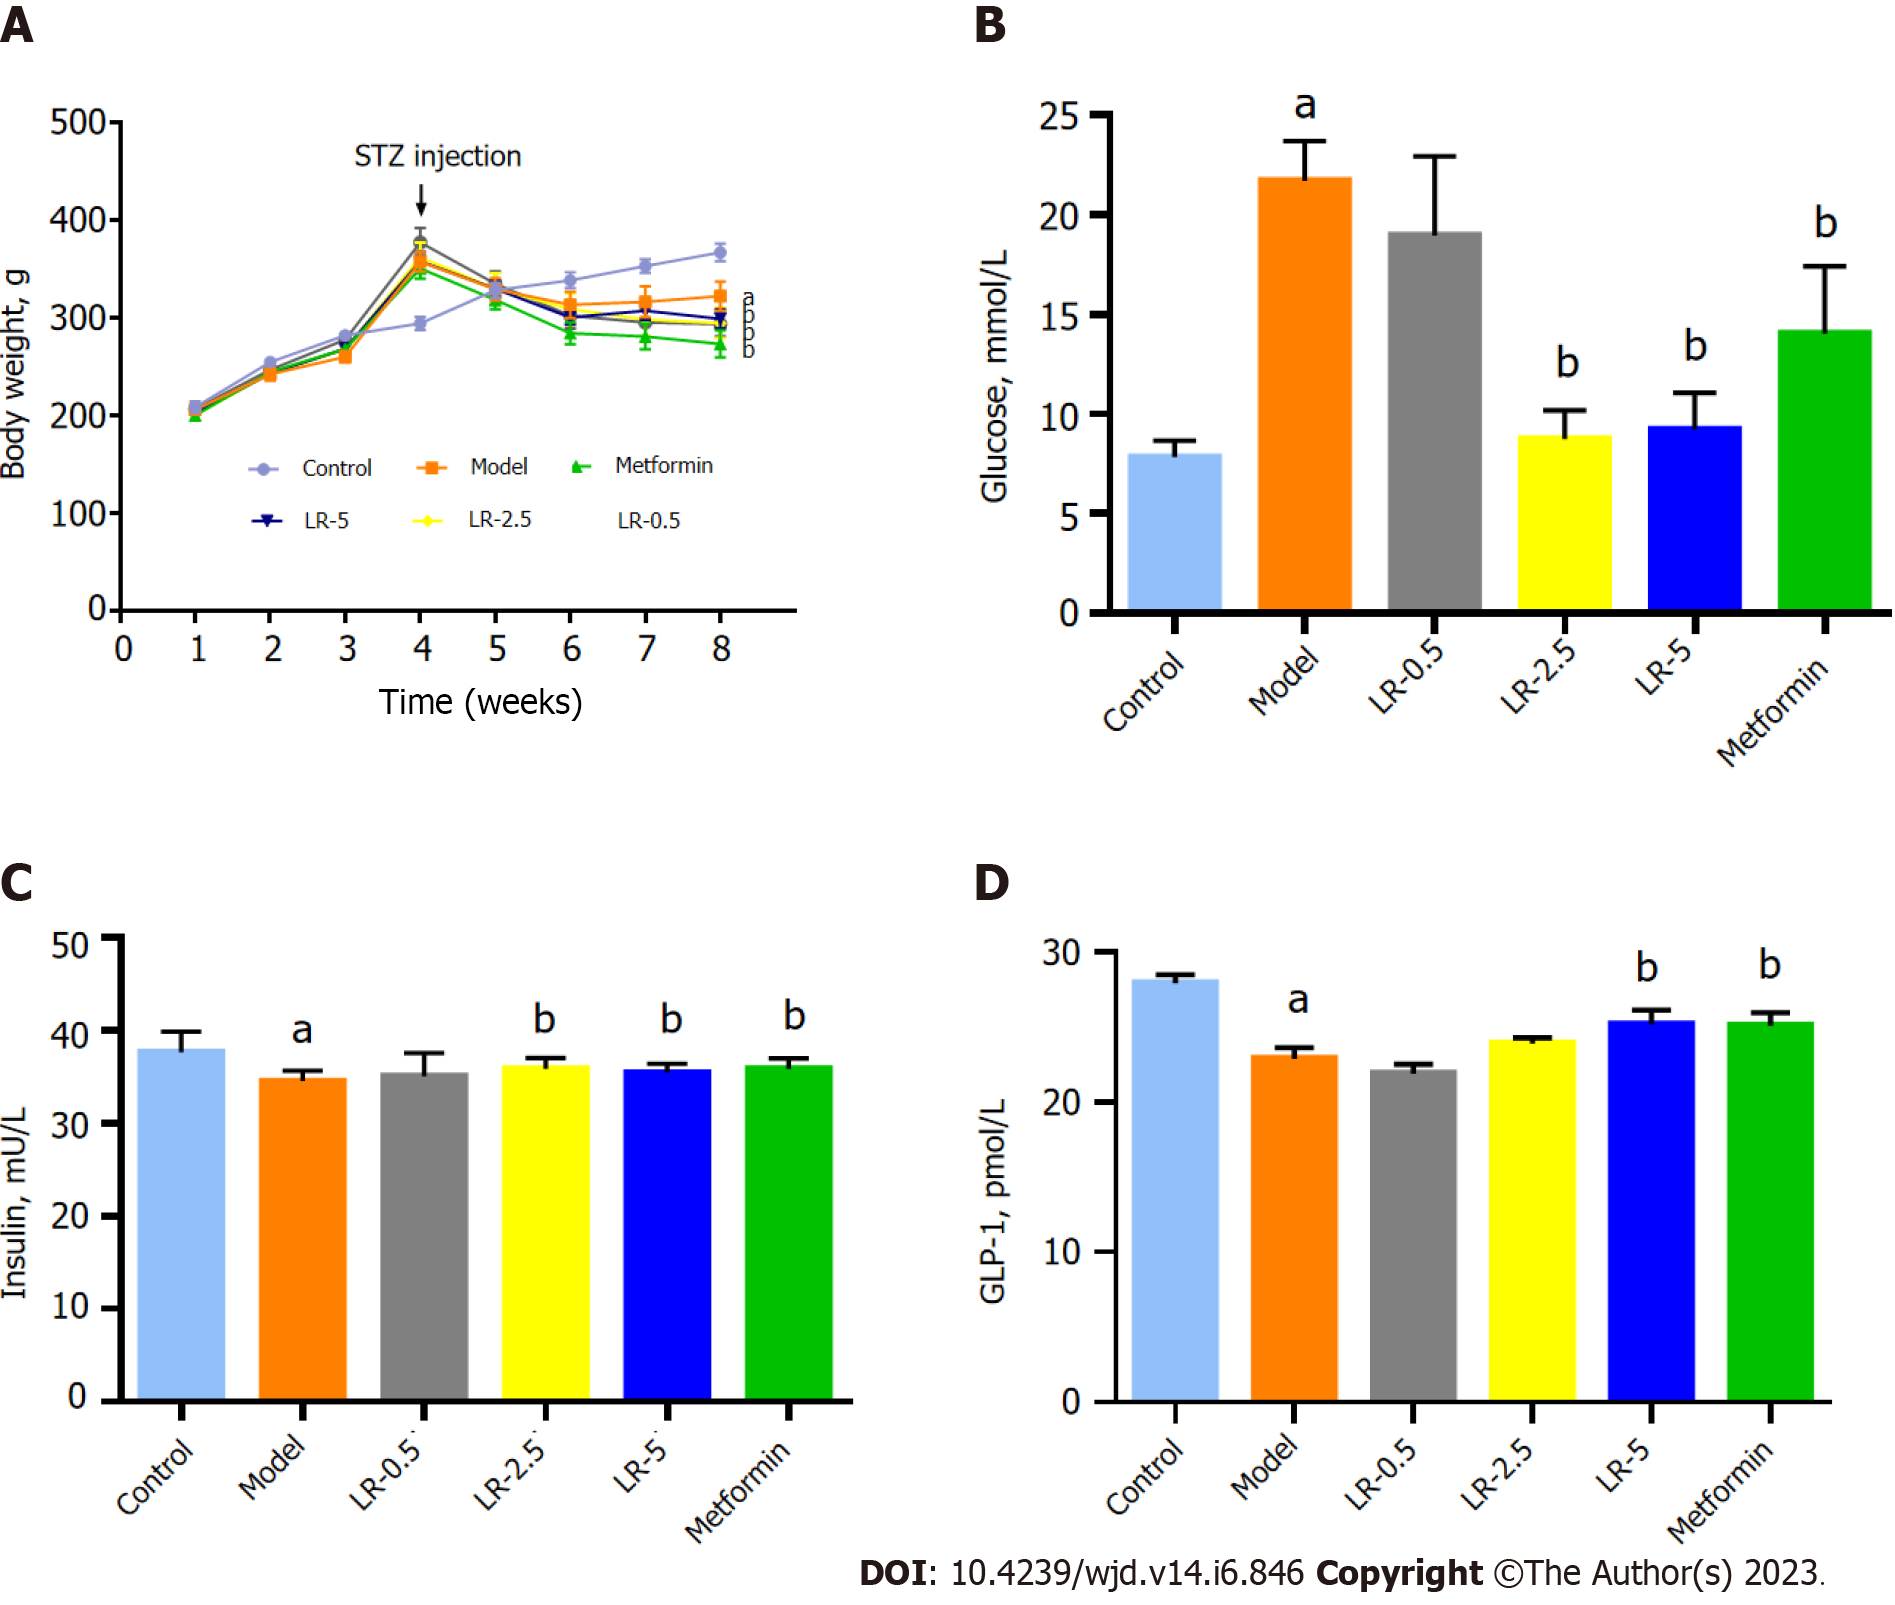
Figure 2 Effects of Lomatogonium rotatum on body weight, serum glucose, insulin, and glucagon-like peptide 1 levels in the diabetic rat model.
A: Body weight; B: Serum glucose; C: Insulin; D: Glucagon-like peptide 1. The data represent means ± standard error of the mean (n = 10). aP < 0.05 vs the control group; bP < 0.05 vs the model group. GLP-1: Glucagon-like peptide 1; LR: Lomatogonium rotatum; STZ: Streptozotocin.
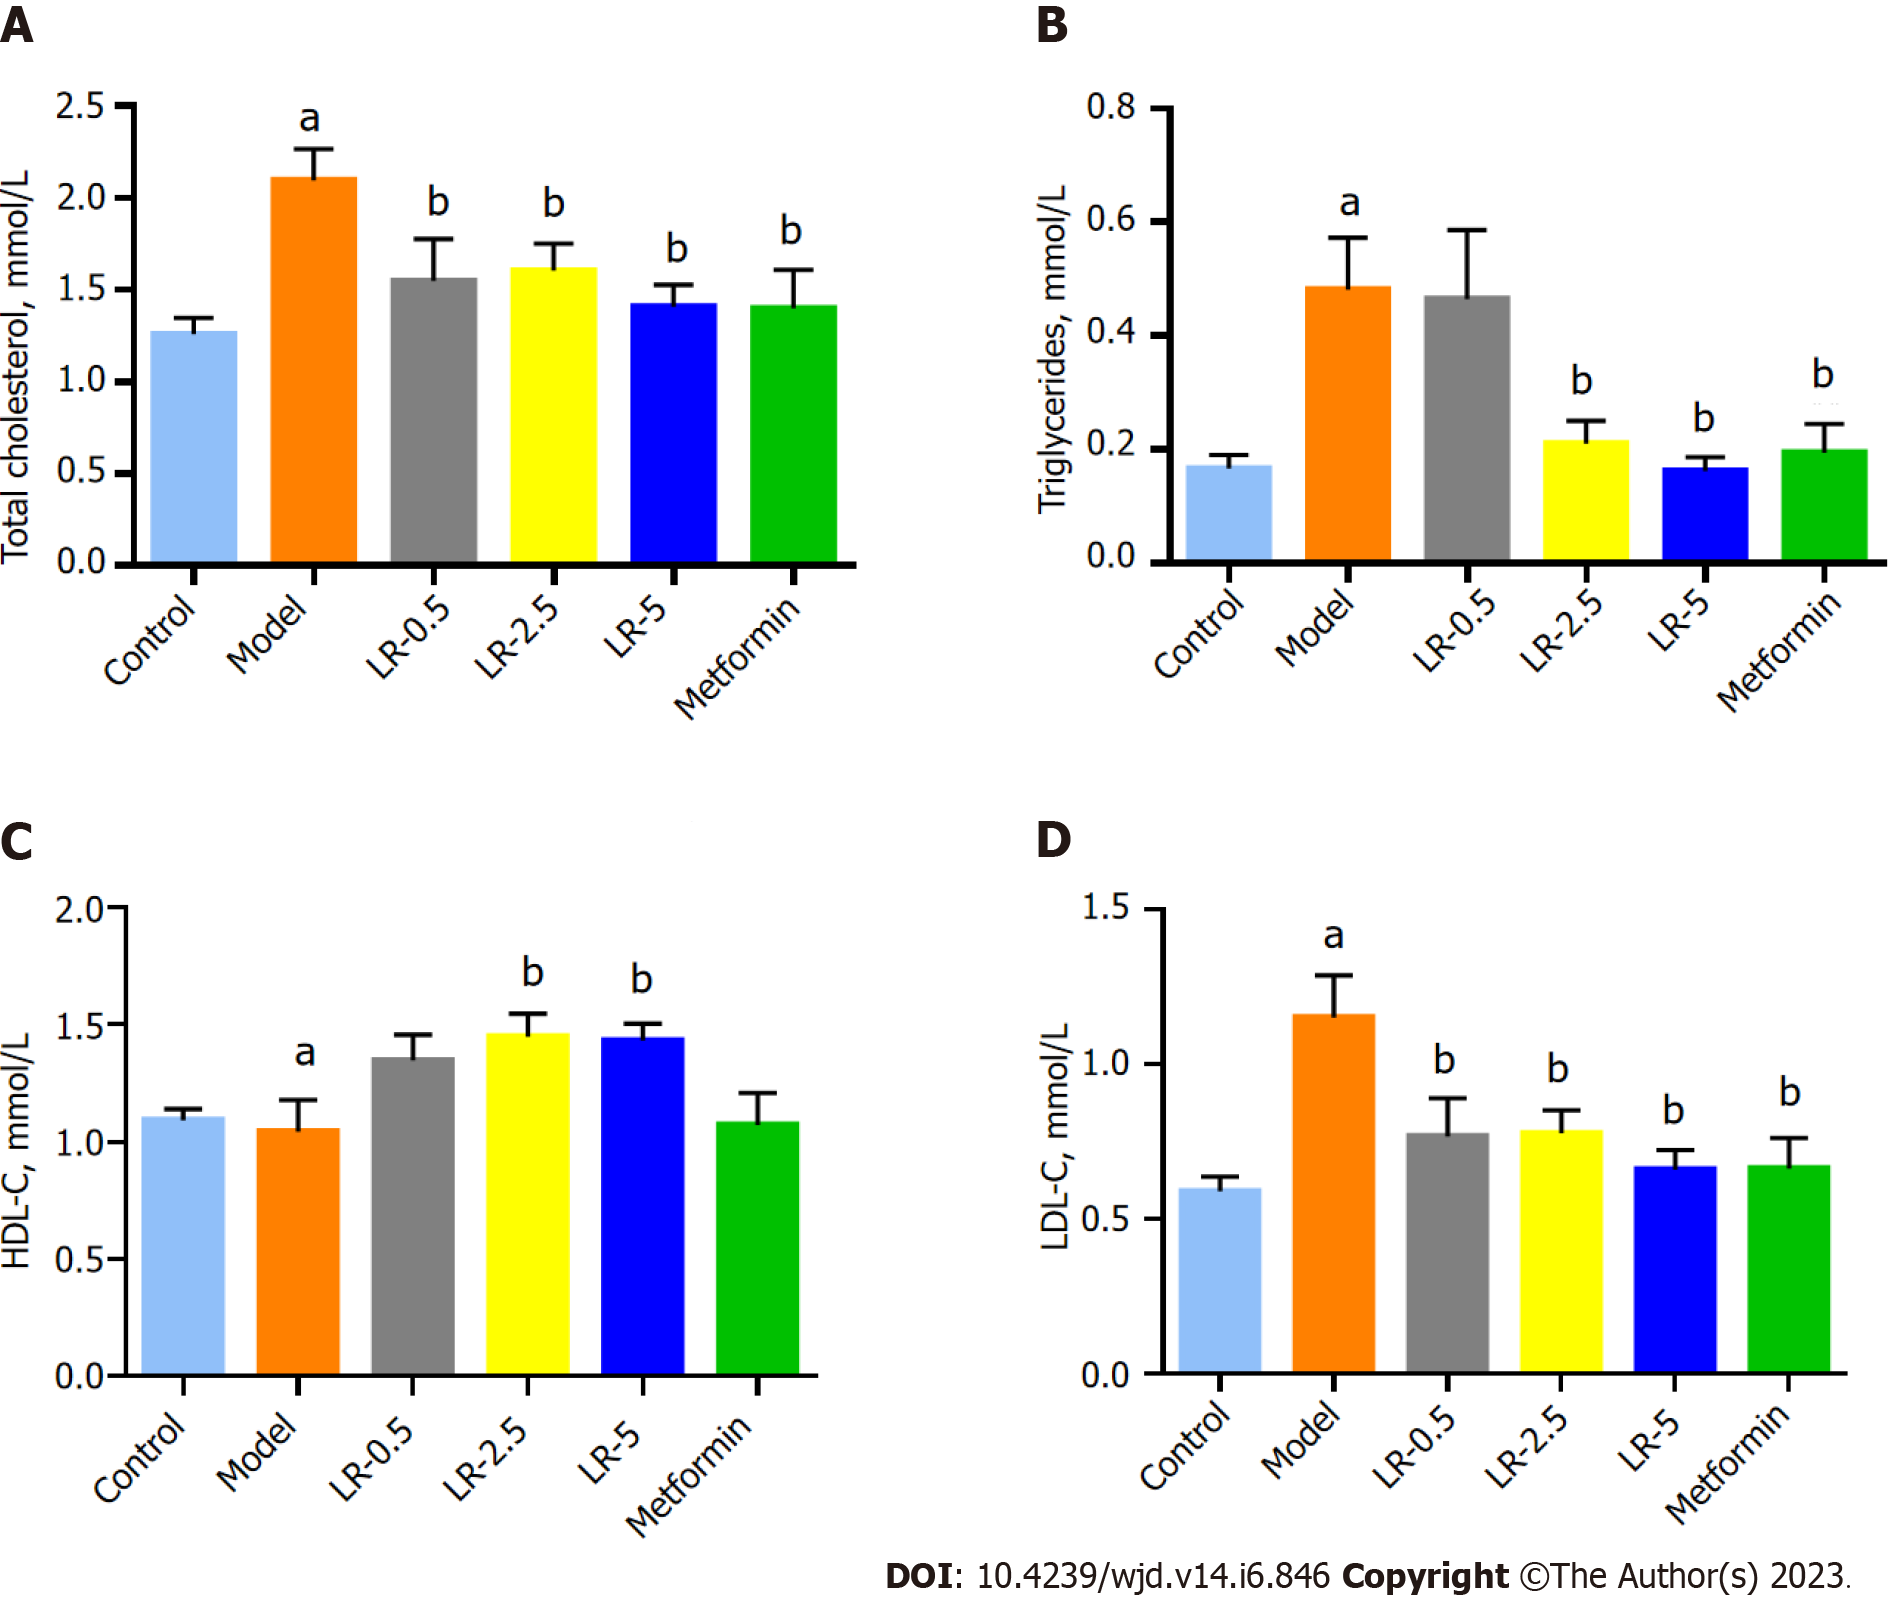
Figure 3 Effects of Lomatogonium rotatum on serum total cholesterol, triglycerides, high-density lipoprotein-cholesterol, and low-density lipoprotein cholesterol levels in diabetic rats.
A: Total cholesterol; B: Triglycerides; C: High-density lipoprotein-cholesterol; D: Low-density lipoprotein cholesterol. The data represent means ± standard error of the mean (n = 10). aP < 0.01 and bP < 0.05 vs the model group. HDL-C: High-density lipoprotein-cholesterol; LDL-C: Low-density lipoprotein cholesterol; LR: Lomatogonium rotatum.
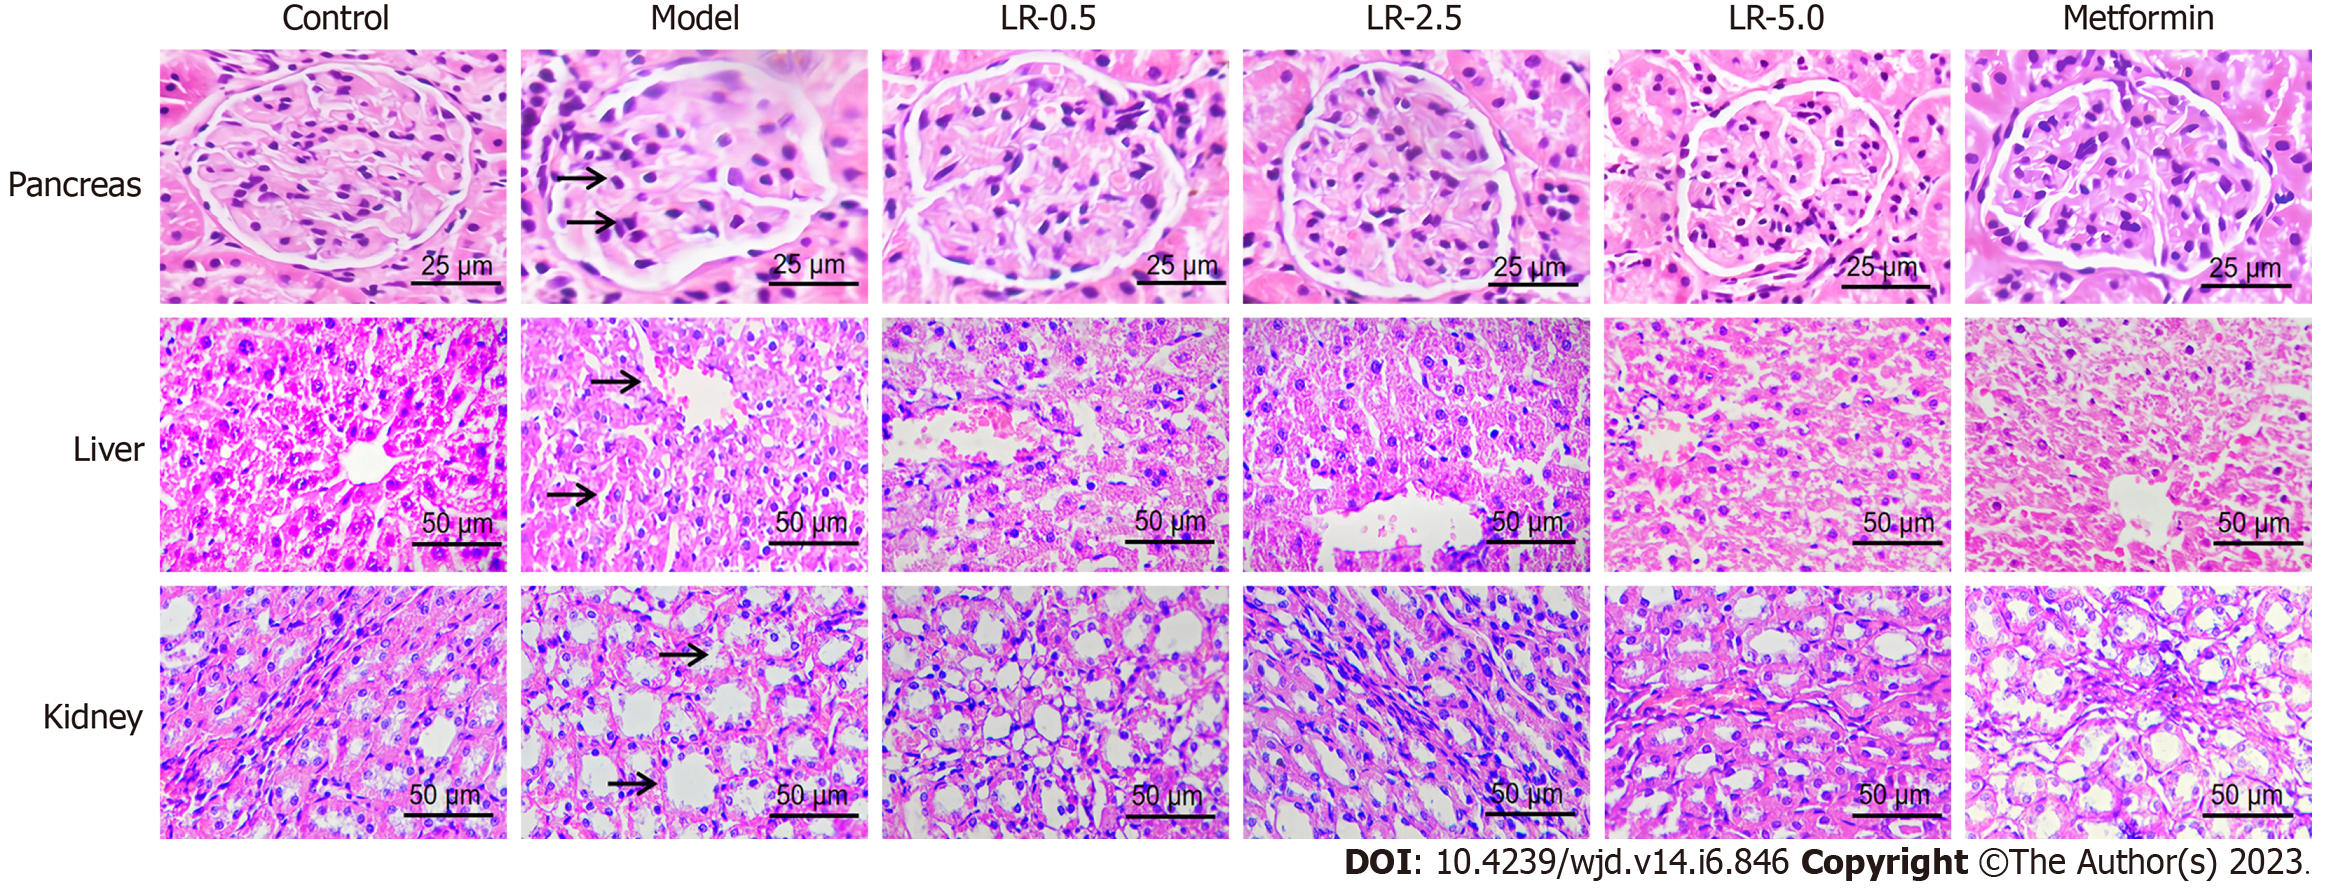
Figure 4 Effects of Lomatogonium rotatum on histological changes of the pancreas, liver, and kidney tissues in the streptozotocin-induced diabetic rat model.
Arrows indicate β-cell vacuolation and granulation in the pancreas, impaired central vein and steatosis in the liver, and renal lesions and glomerular hypertrophy in the kidney. LR: Lomatogonium rotatum.
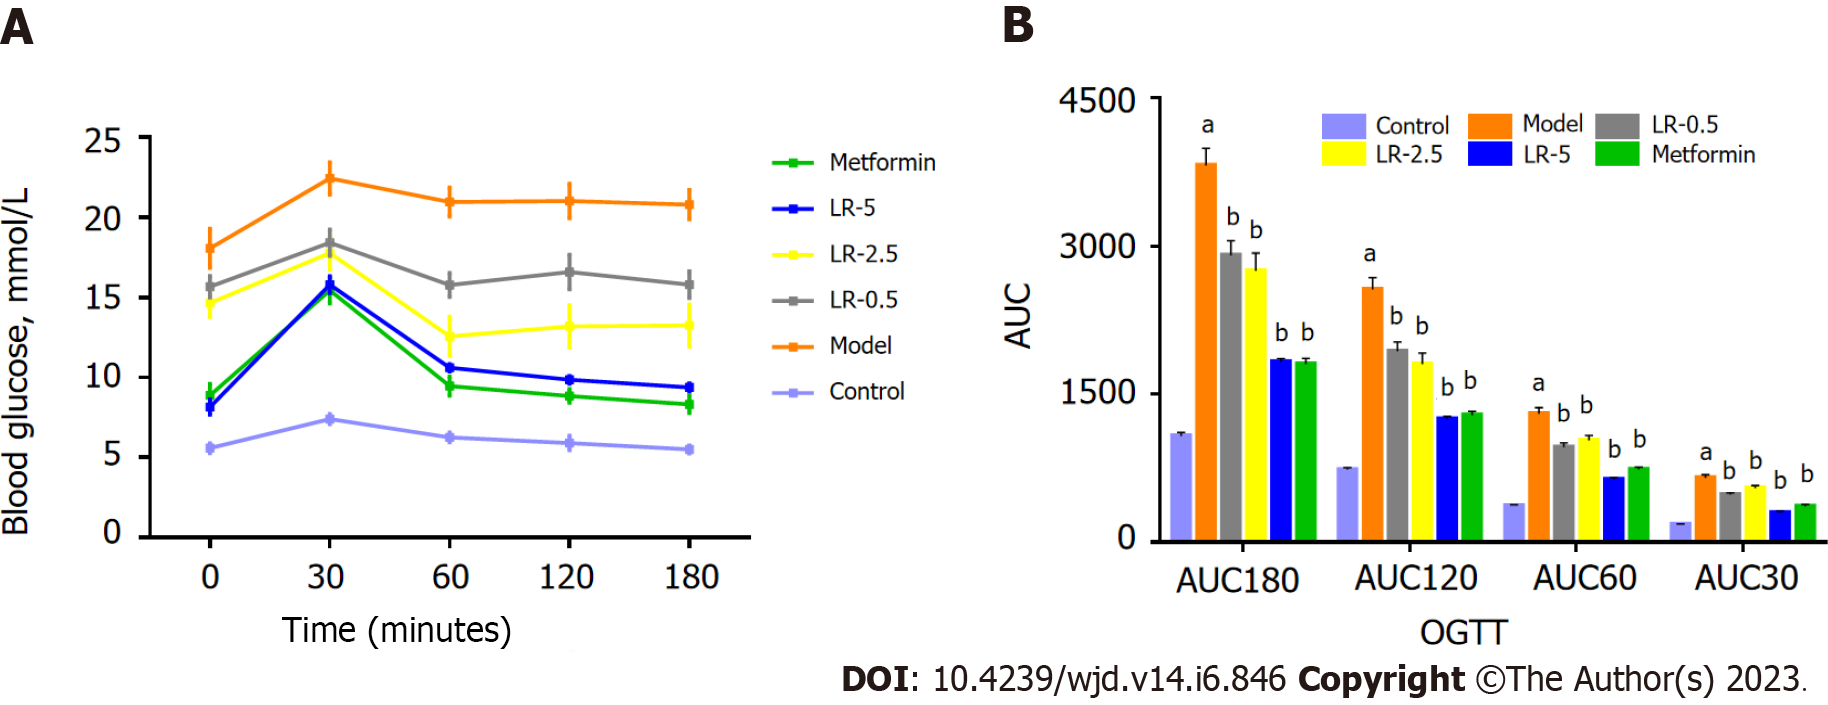
Figure 5 Effects of Lomatogonium rotatum on the oral glucose tolerance test of diabetic rats.
A: Changes in blood glucose from 0 to 180 min; B: Values for the area under the curve. The data represents means ± standard error of the mean (n = 10). aP < 0.05 vs the control group; bP < 0.05 vs the model group. AUC: Area under the curve; LR: Lomatogonium rotatum; OGTT: Oral glucose tolerance test.
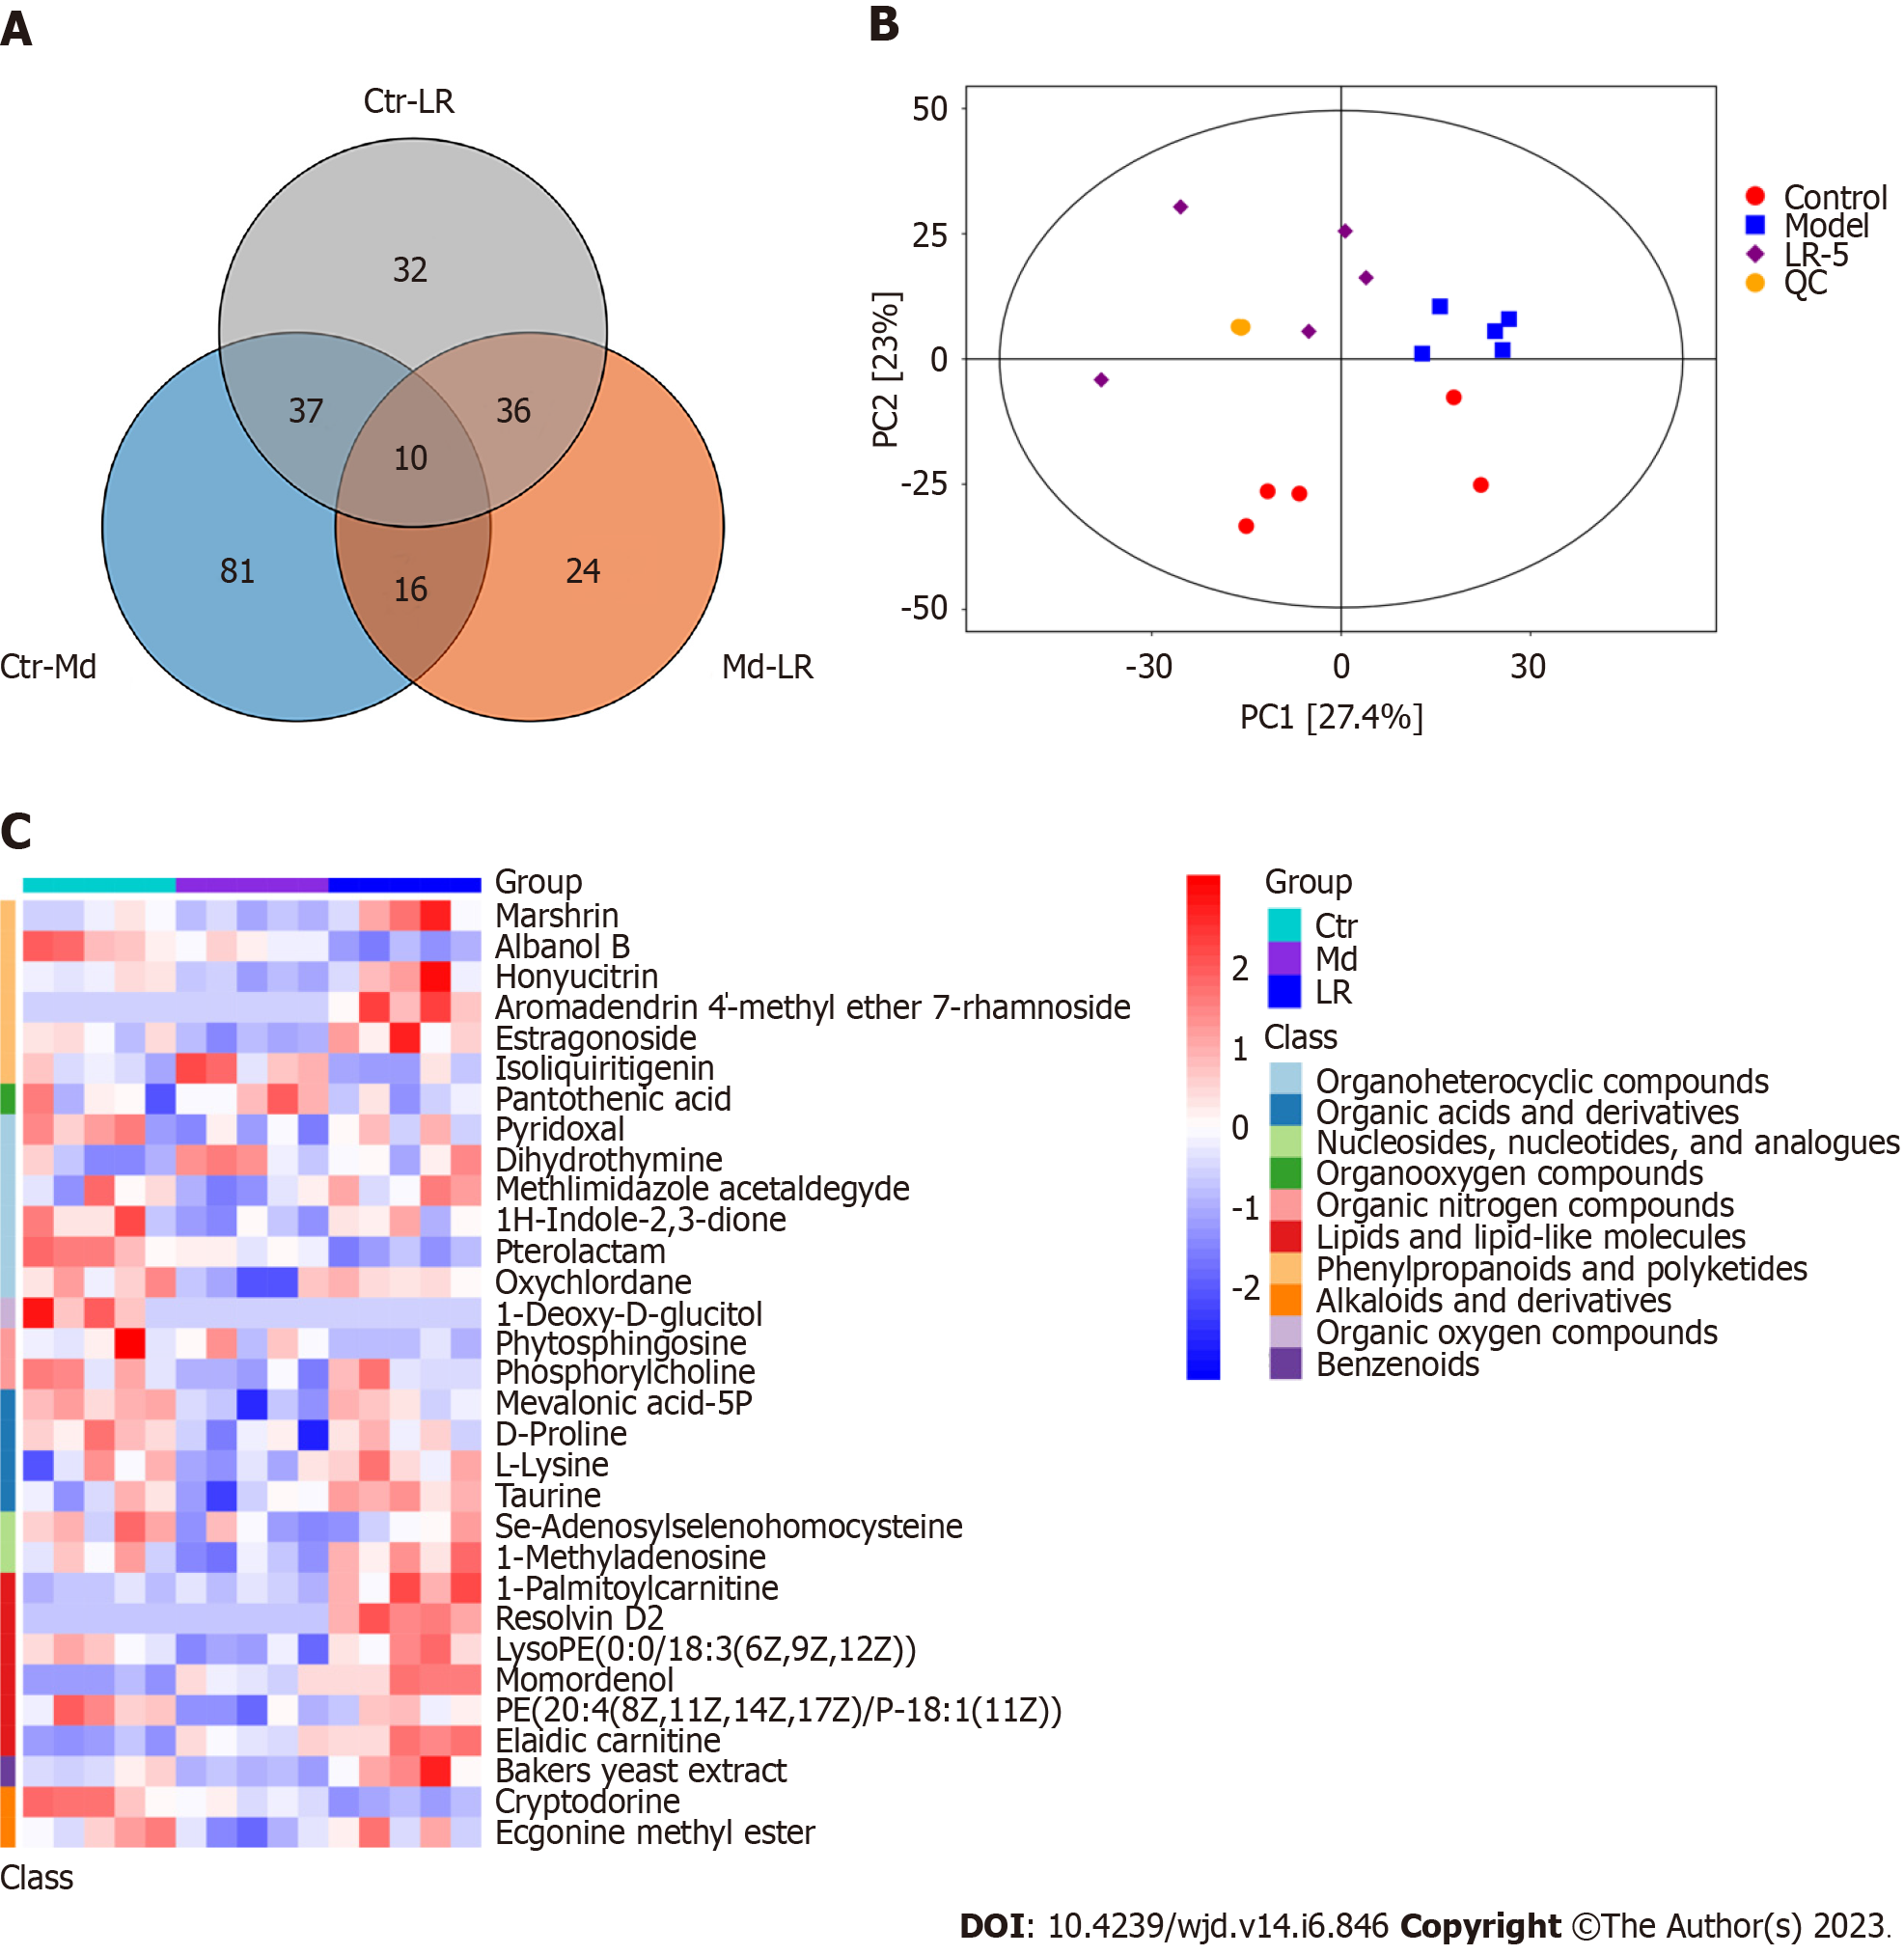
Figure 6 Metabolomic analysis of Lomatogonium rotatum-treated streptozotocin-induced diabetic rats.
A: The Venn diagram displays the amount of metabolites with differential expression. Different colors indicate distinct comparisons, whereas overlapping regions show differentially expressed metabolites shared by two groups; B: Serum metabolic characteristics of different groups were determined by a principal component analysis diagram; C: Cluster heat map of differentially-expressed metabolites in three experimental groups. In each sample, red and blue colors indicated higher and lower expression, respectively. LR: Lomatogonium rotatum; QC: Quality control.
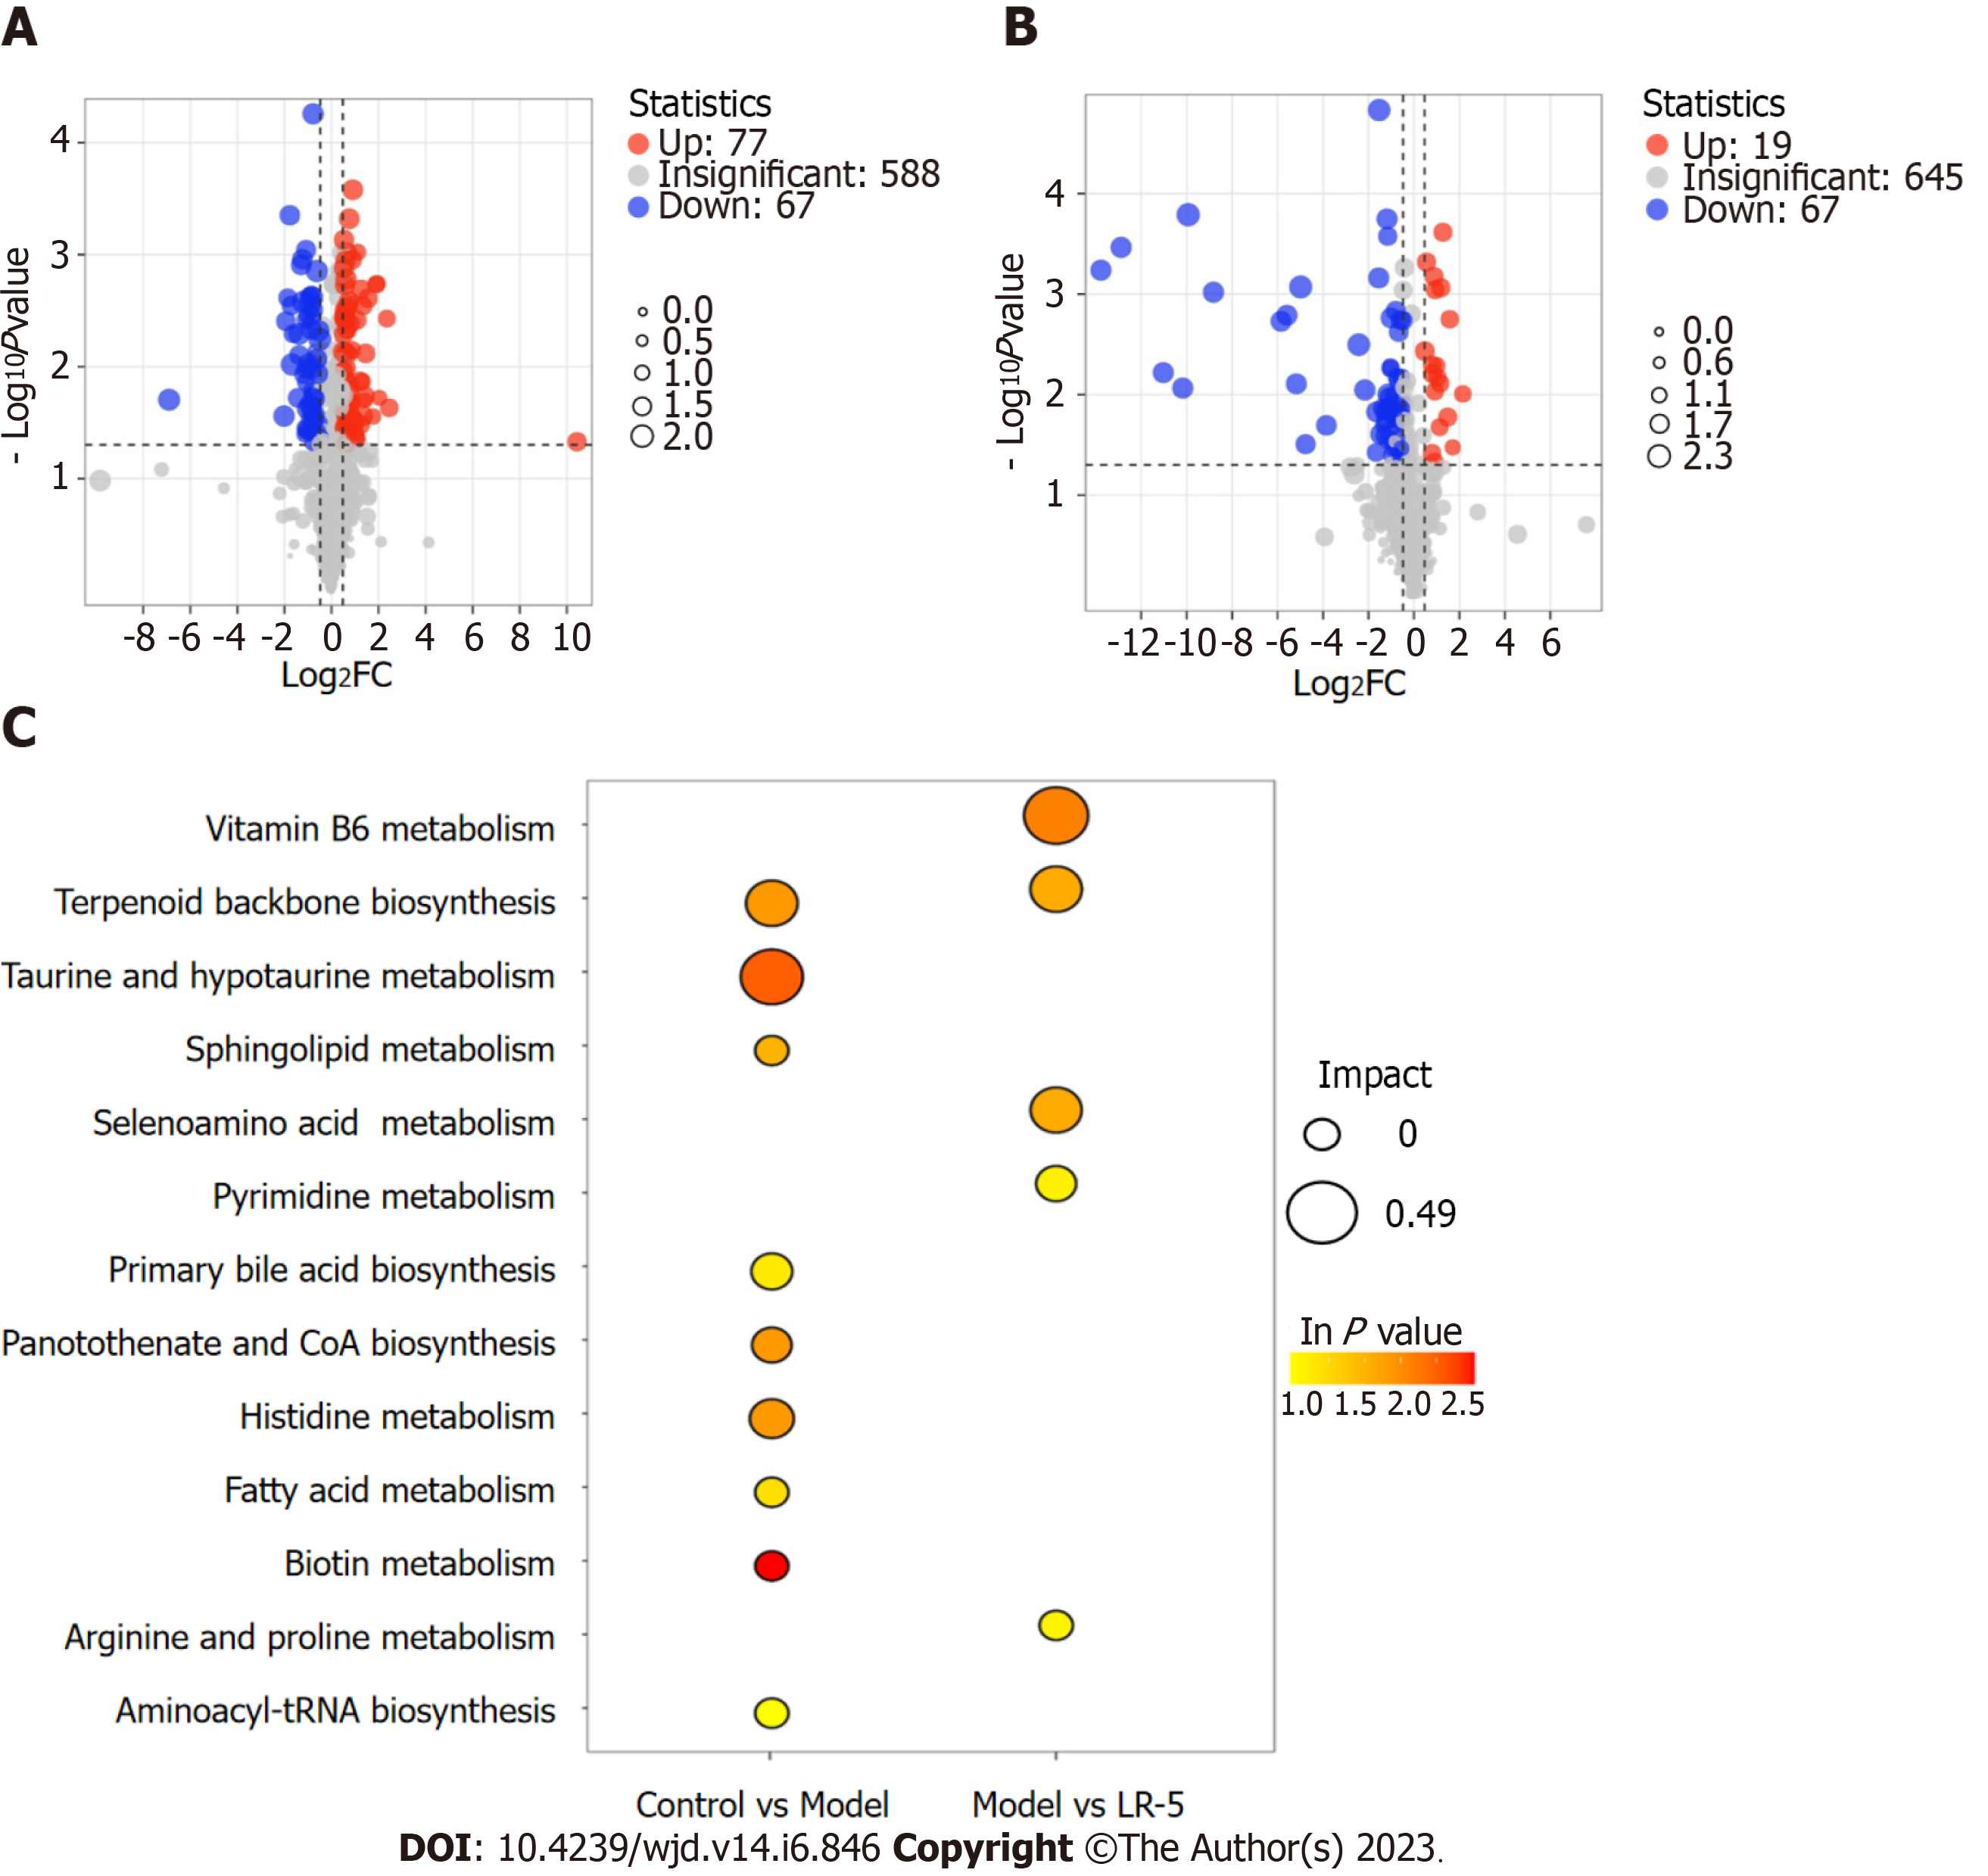
Figure 7 Differential metabolites and pathways across groups.
A and B: A volcano diagram illustrated the distinct metabolite compositions between control vs model (A) and model vs LR-5 (B). Green and red colors represent significant upregulation and downregulation of metabolites, respectively. Significant deferentially expressed metabolites were determined based on a P value < 0.05 and a log2fold-change of at least 2.0; C: XploreMET (Metabo-Profile) was used to evaluate the Kyoto Encyclopedia of Genes and Genomes metabolic pathways of the differential metabolites. FC: Fold change; LR: Lomatogonium rotatum; VIP: Variable importance in projection.
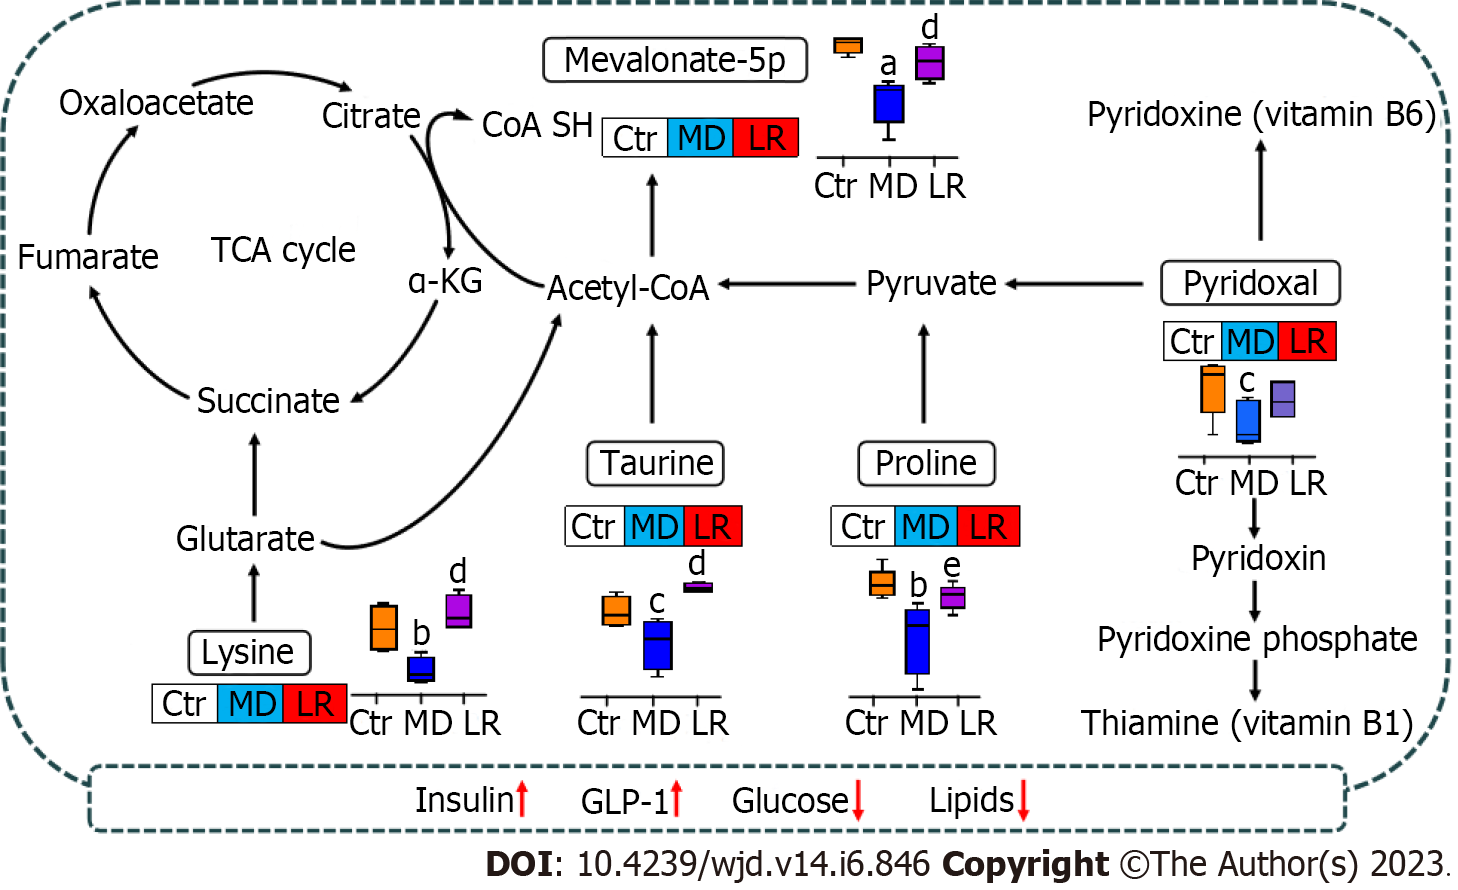
Figure 8 Schematic summary of metabolic pathways related to the Lomatogonium rotatum effect on streptozotocin-induced diabetic rats.
The relative levels of significantly altered metabolites were presented in different colors. The blue rectangle represents downregulation, the red rectangle represents upregulation, and the gray rectangle reveals no change in contrast to the control. aP < 0.001, bP < 0.01 and cP < 0.05 vs the control group; dP < 0.01 and eP < 0.05 vs the model group. Ctr: Control group; LR: Lomatogonium rotatum-treated group; MD: Model group; TCA: Tricarboxylic acid.
- Citation: Dai LL, Cho SB, Li HF, A LS, Ji XP, Pan S, Bao ML, Bai L, Ba GN, Fu MH. Lomatogonium rotatum extract alleviates diabetes mellitus induced by a high-fat, high-sugar diet and streptozotocin in rats. World J Diabetes 2023; 14(6): 846-861
- URL: https://www.wjgnet.com/1948-9358/full/v14/i6/846.htm
- DOI: https://dx.doi.org/10.4239/wjd.v14.i6.846


