©The Author(s) 2023.
World J Diabetes. Mar 15, 2023; 14(3): 279-289
Published online Mar 15, 2023. doi: 10.4239/wjd.v14.i3.279
Published online Mar 15, 2023. doi: 10.4239/wjd.v14.i3.279
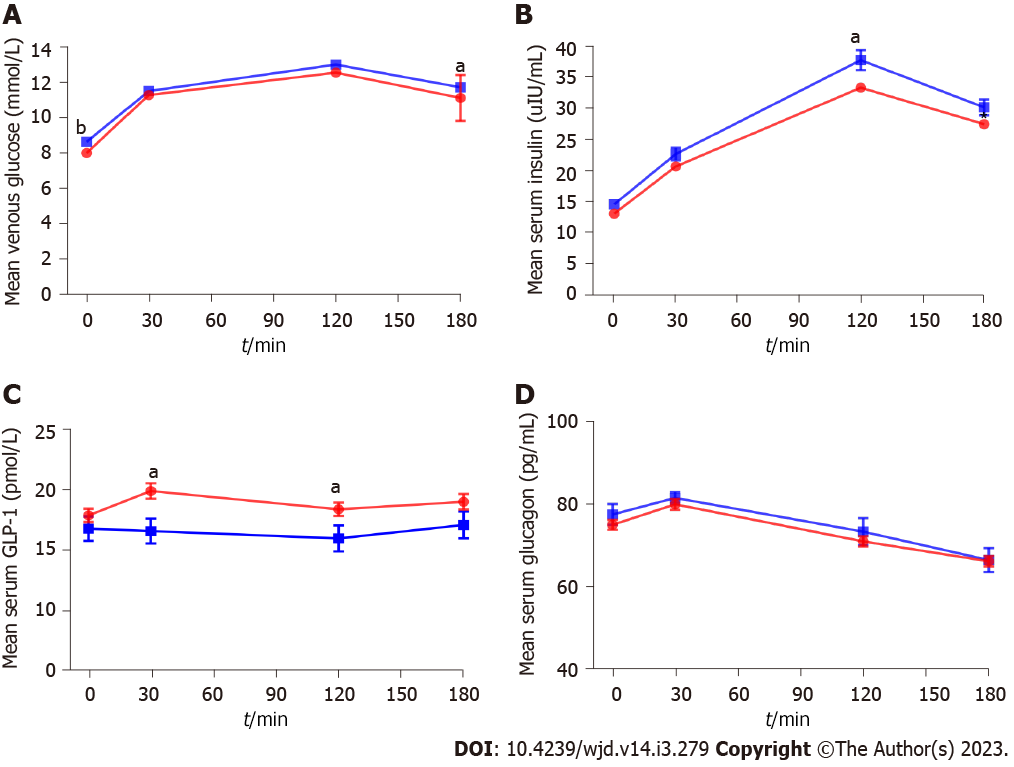
Figure 1 Mean concentrations of glucose and some related endocrine hormones during the standard meal test.
A: Glucose; B: Insulin; C: Glucagon; D: Glucagon-like peptide 1 (active). Values show means with standard error, aP < 0.05; bP < 0.01. GLP-1: Glucagon-like peptide 1.
Figure 2 Scatter plot the correlation between natural logarithm of urinary albumin-to-creatinine ratio and postprandial glucagon-like peptide 1 levels.
A: Scatter plot for the correlations between 30 min glucagon-like peptide 1 (GLP-1) levels and the urinary albumin-creatinine ratio (UACR) in all type 2 diabetes mellitus (T2DM) patients; B: Scatter plot for the correlations between 120 min GLP-1 levels and the UACR in all T2DM patients; C: Scatter plot for the correlations between area under the curve for GLP-1 and the UACR in all T2DM patients. GLP-1: Glucagon-like peptide 1; UACR: Urinary albumin-creatinine ratio; AUCGLP-1: Area under the curve for active glucagon-like peptide 1; LnUACR: Natural logarithm of urinary albumin-to-creatinine ratio.
- Citation: Song LL, Wang N, Zhang JP, Yu LP, Chen XP, Zhang B, Yang WY. Postprandial glucagon-like peptide 1 secretion is associated with urinary albumin excretion in newly diagnosed type 2 diabetes patients. World J Diabetes 2023; 14(3): 279-289
- URL: https://www.wjgnet.com/1948-9358/full/v14/i3/279.htm
- DOI: https://dx.doi.org/10.4239/wjd.v14.i3.279


