Copyright
©The Author(s) 2022.
World J Diabetes. Apr 15, 2022; 13(4): 338-357
Published online Apr 15, 2022. doi: 10.4239/wjd.v13.i4.338
Published online Apr 15, 2022. doi: 10.4239/wjd.v13.i4.338
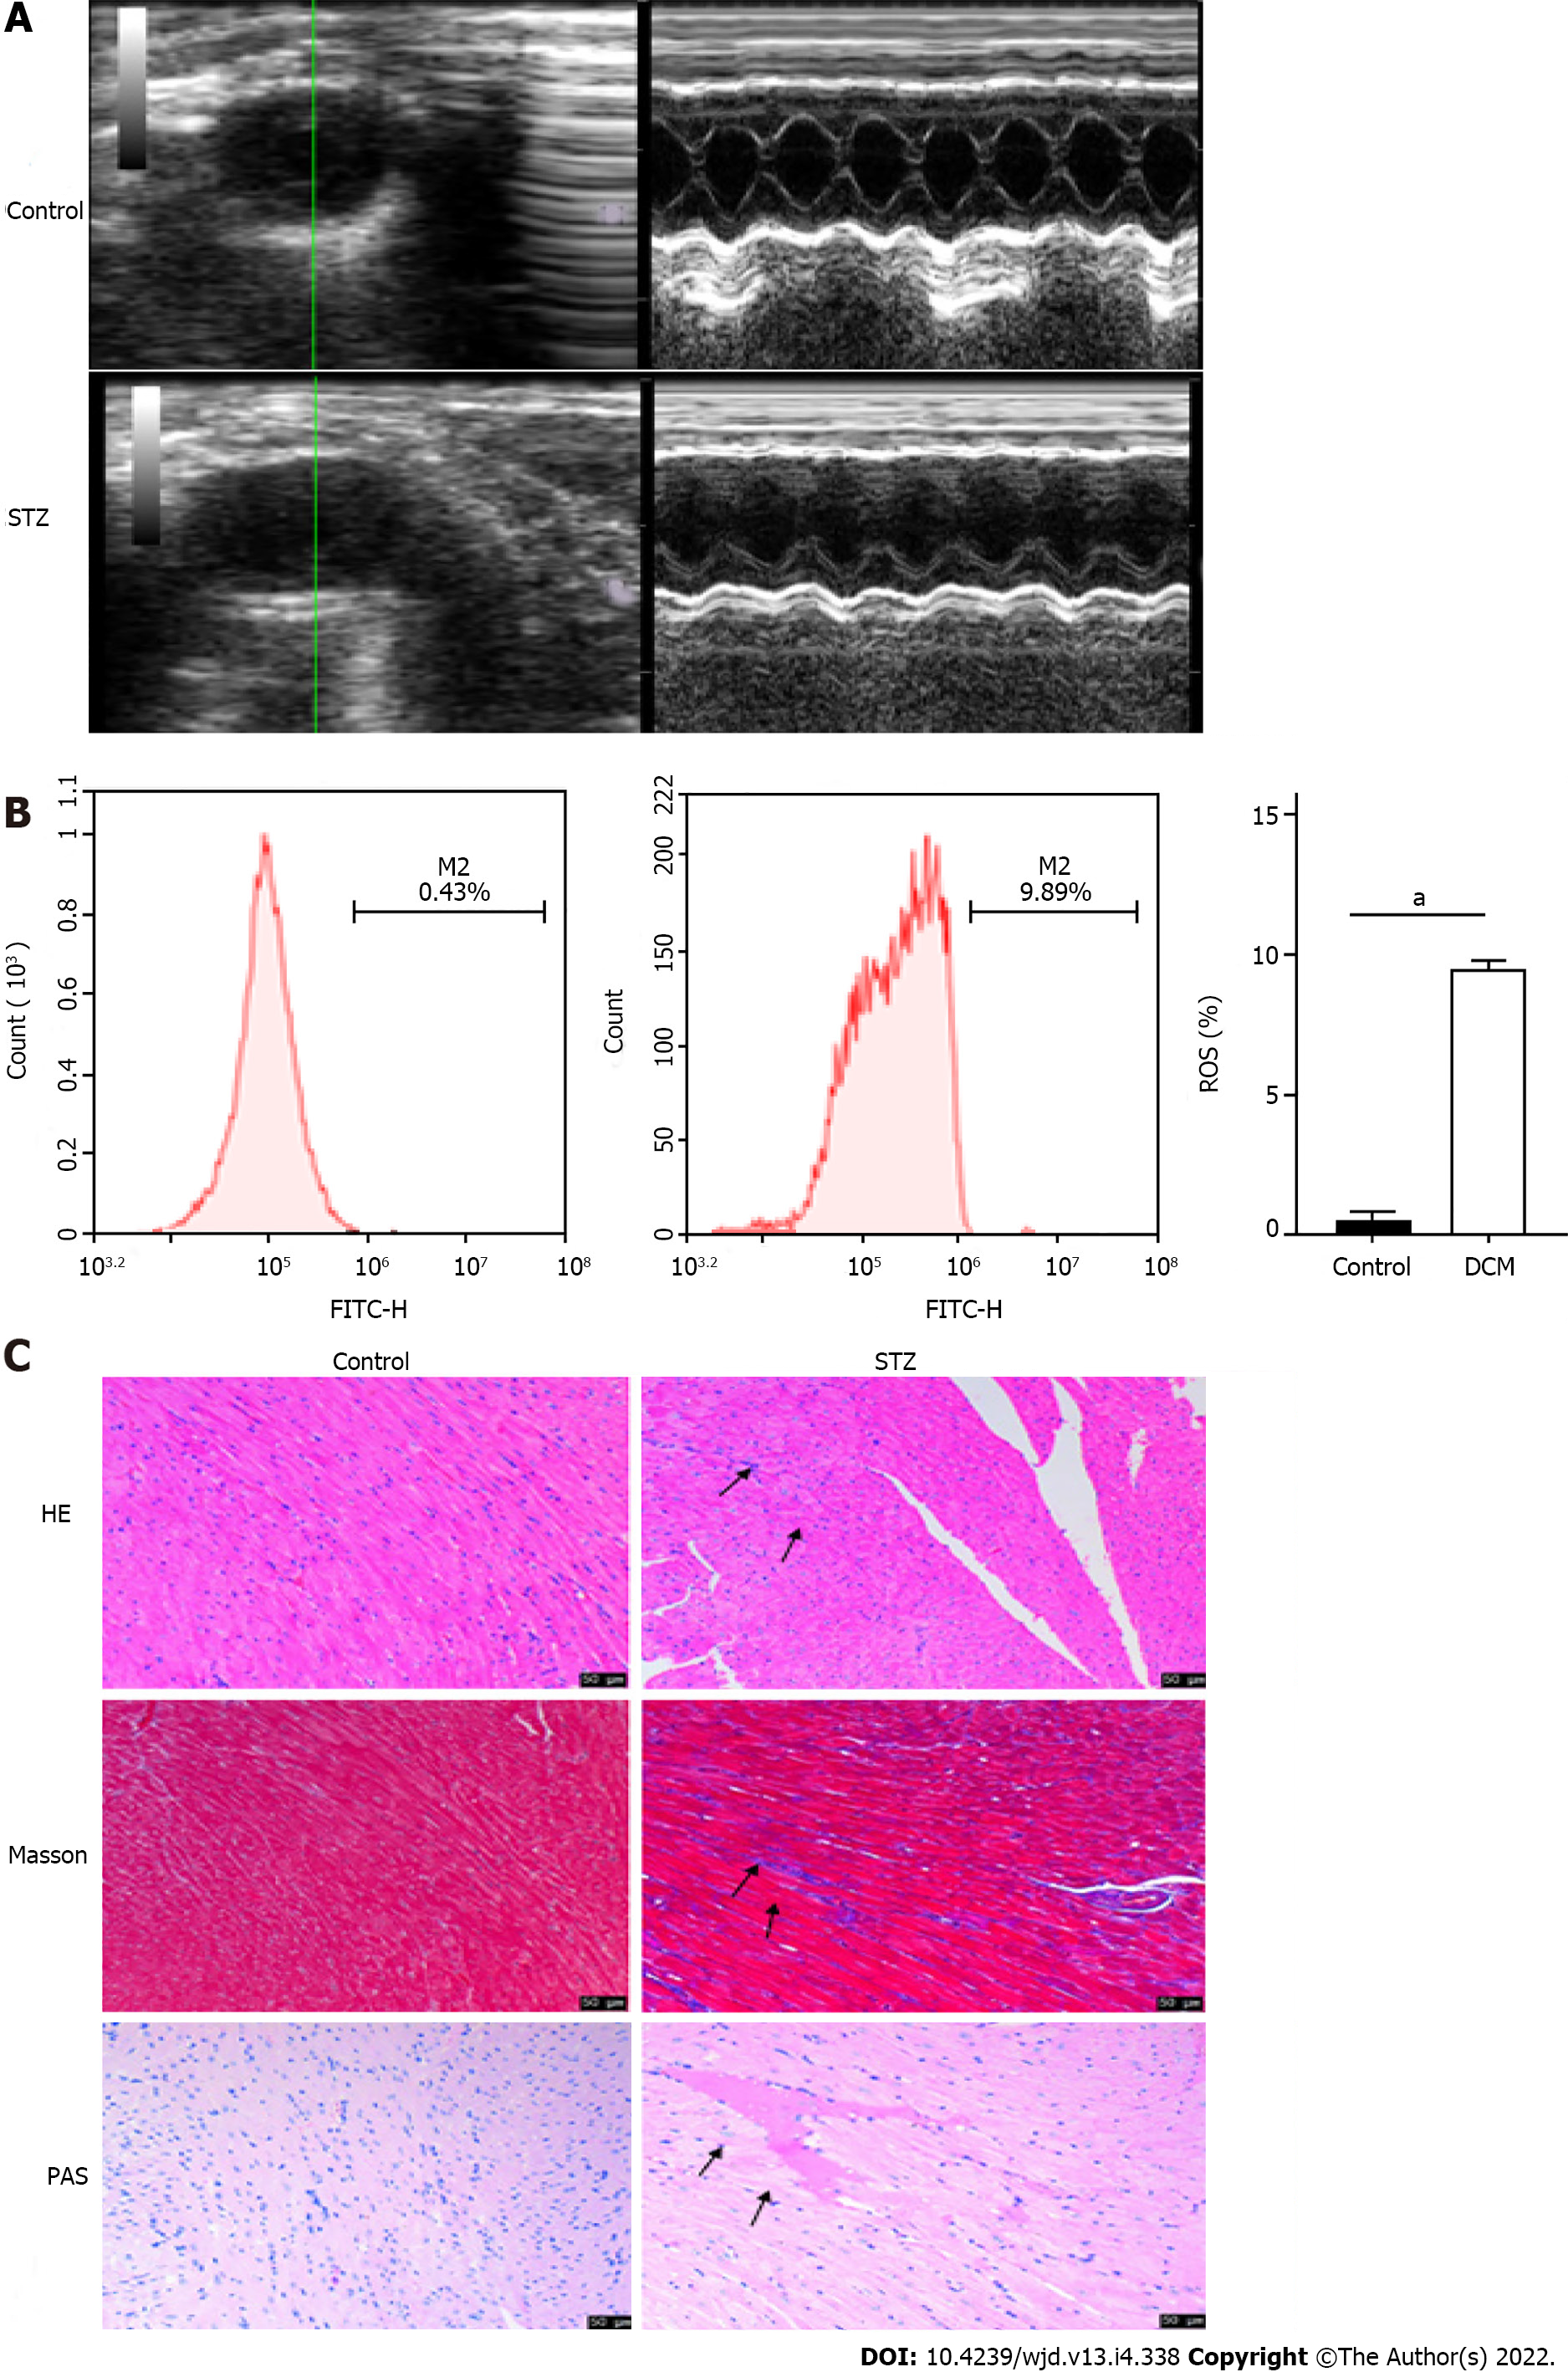
Figure 1 Long axis ultrasound imaging and cardiac function measurement of the left ventricle.
A: Left ventricular short axis view and cardiac function were measured in the control group and streptozotocin (STZ) injection group; B: Flow cytometry of reactive oxygen species in the control group and STZ injection group; C: HE, Masson, and periodic acid Schiff staining of diabetic cardiomyopathy and control mice. Scale bars = 50 μm. aP < 0.0001. STZ: Streptozotocin; ROS: Reactive oxygen species; PAS: Periodic acid Schiff.
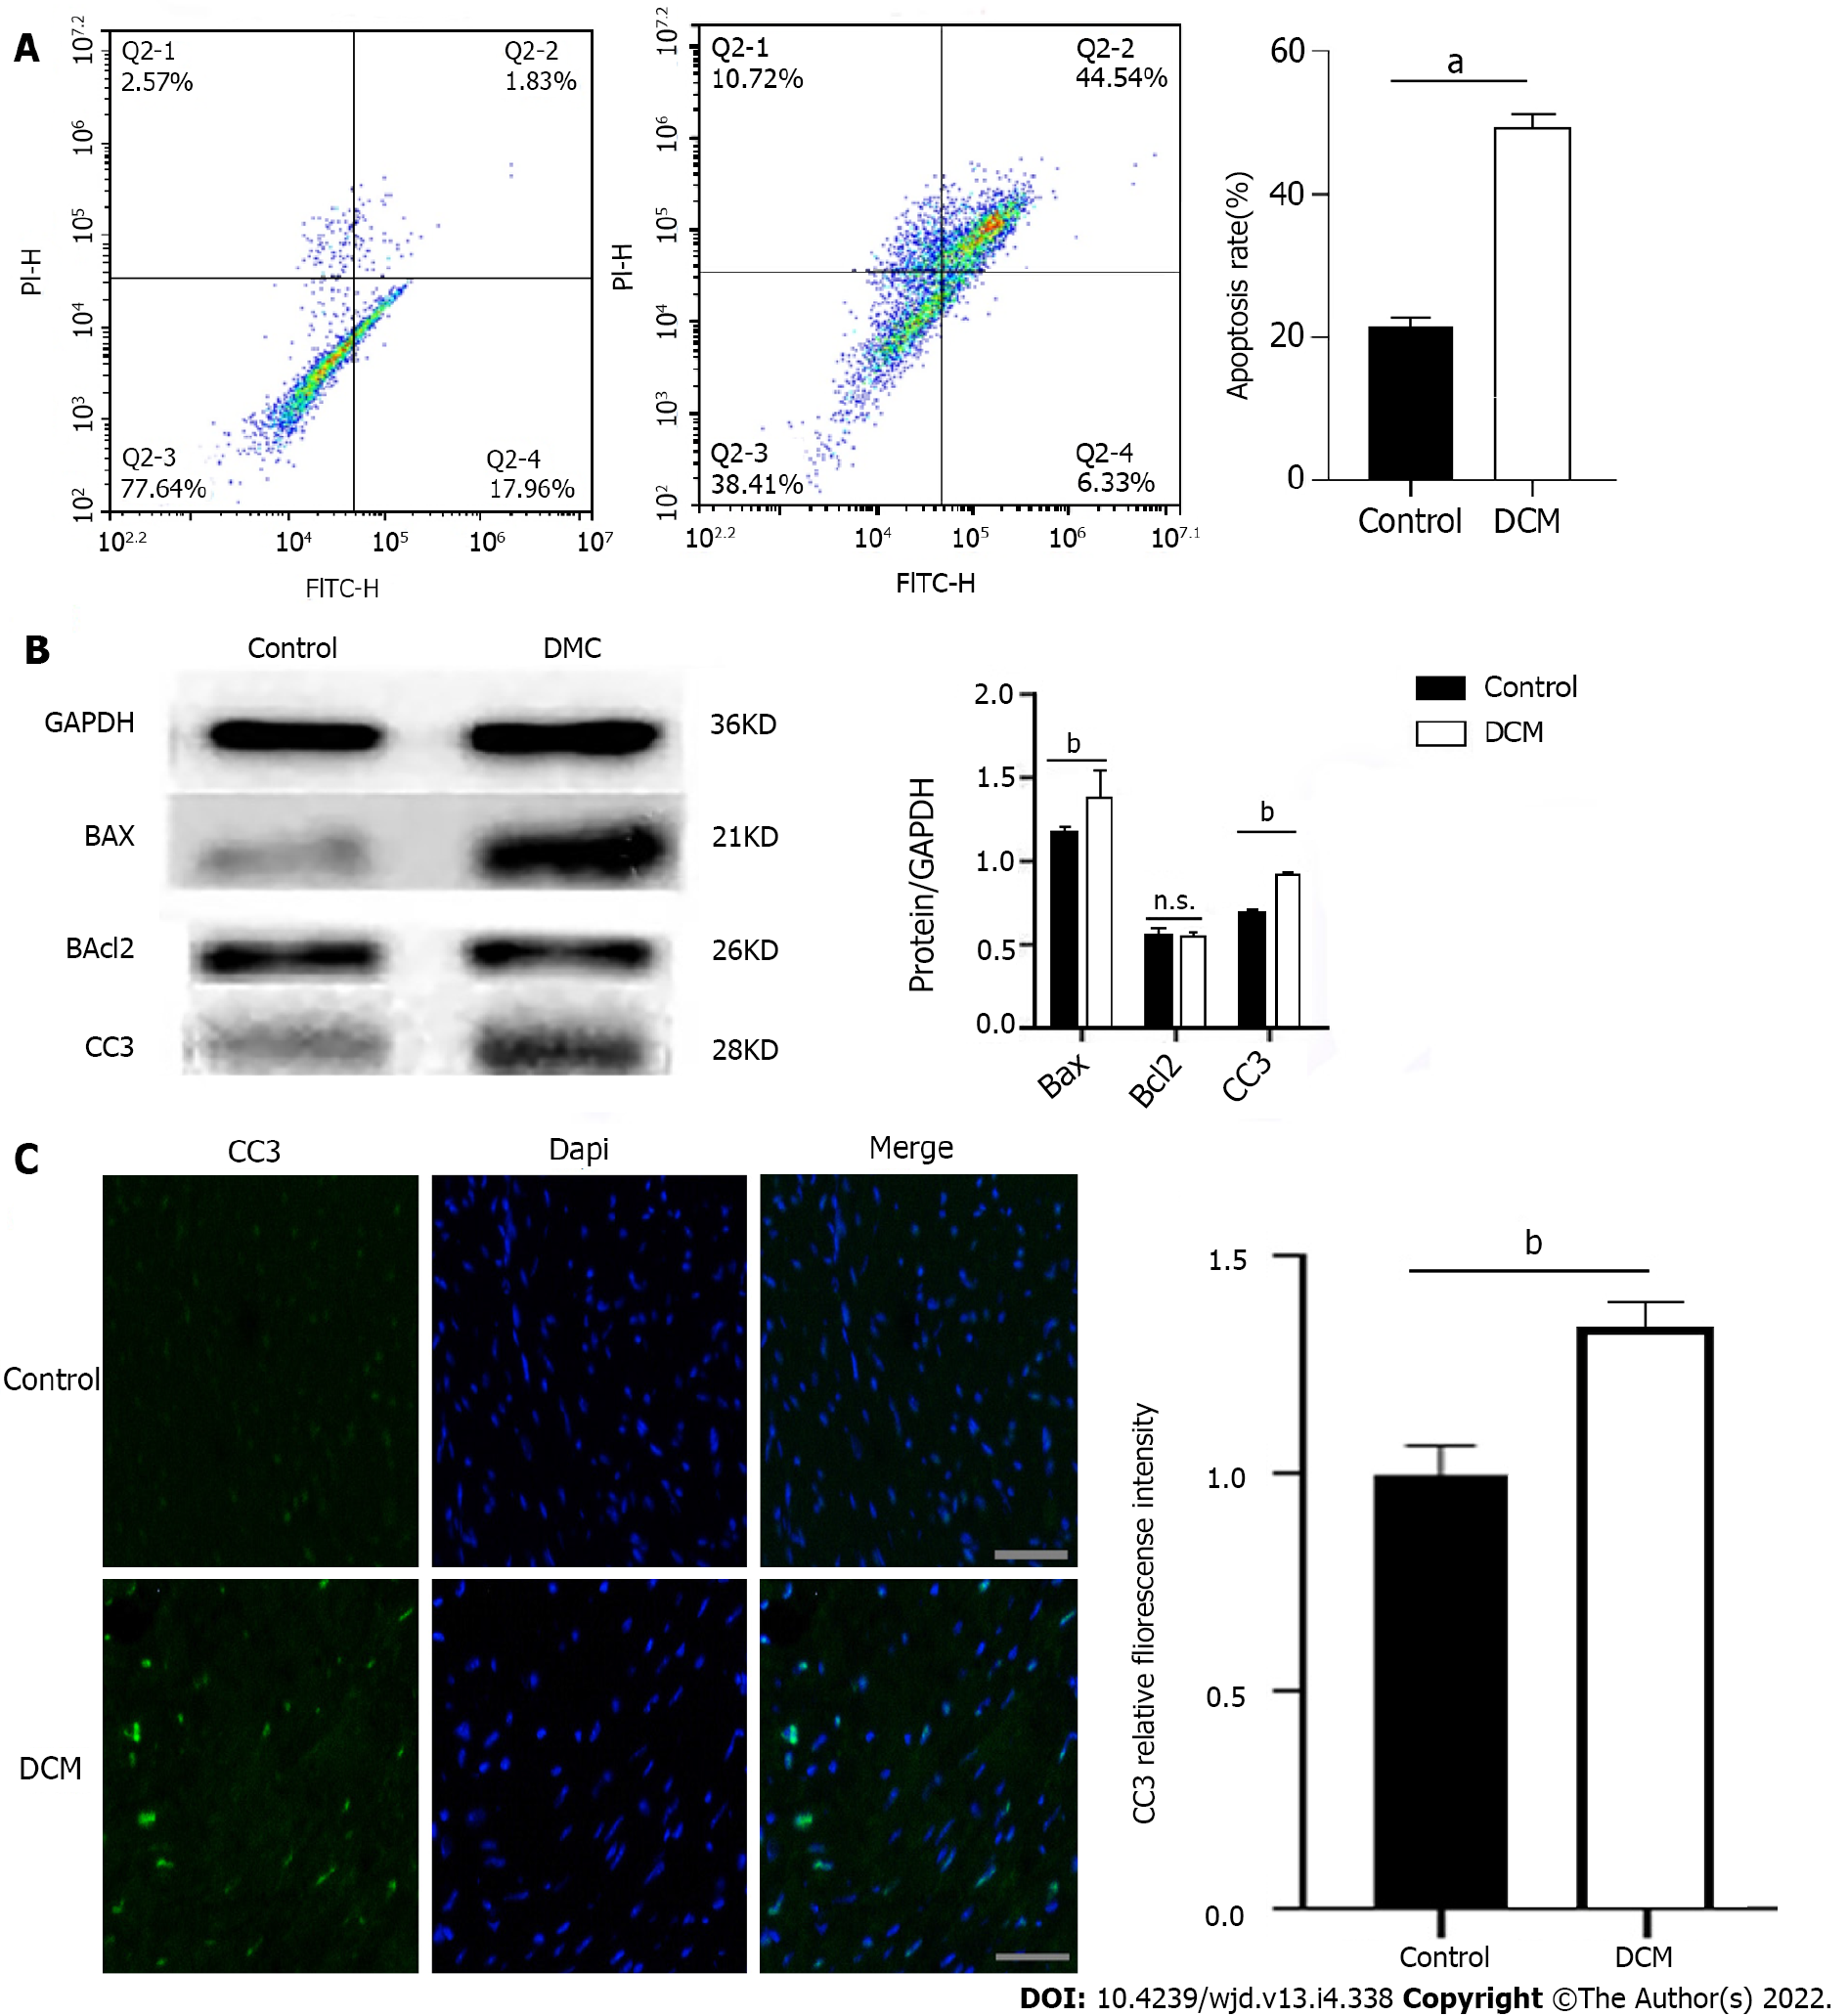
Figure 2 Apoptosis of cardiomyocytes in diabetic cardiomyopathy mice.
A: Apoptosis of diabetic cardiomyopathy (DCM) and control mice was detected using double staining of FITC-Annexin V and propidine iodide and the representative images of flow cytometry are presented. aP < 0.0001; B: Expression levels of apoptosis related proteins BAX, cleaved Caspase 3 (CC3), and Bcl2 in DCM mice and control mice. n = 5, unpaired t-test, bP < 0.01. n.s.: No statistical difference; C: Fluorescence intensity of CC3 in cardiac myocytes of DCM and control mice. Scale bars = 20 μm, bP < 0.01. DCM: Diabetic cardiomyopathy.
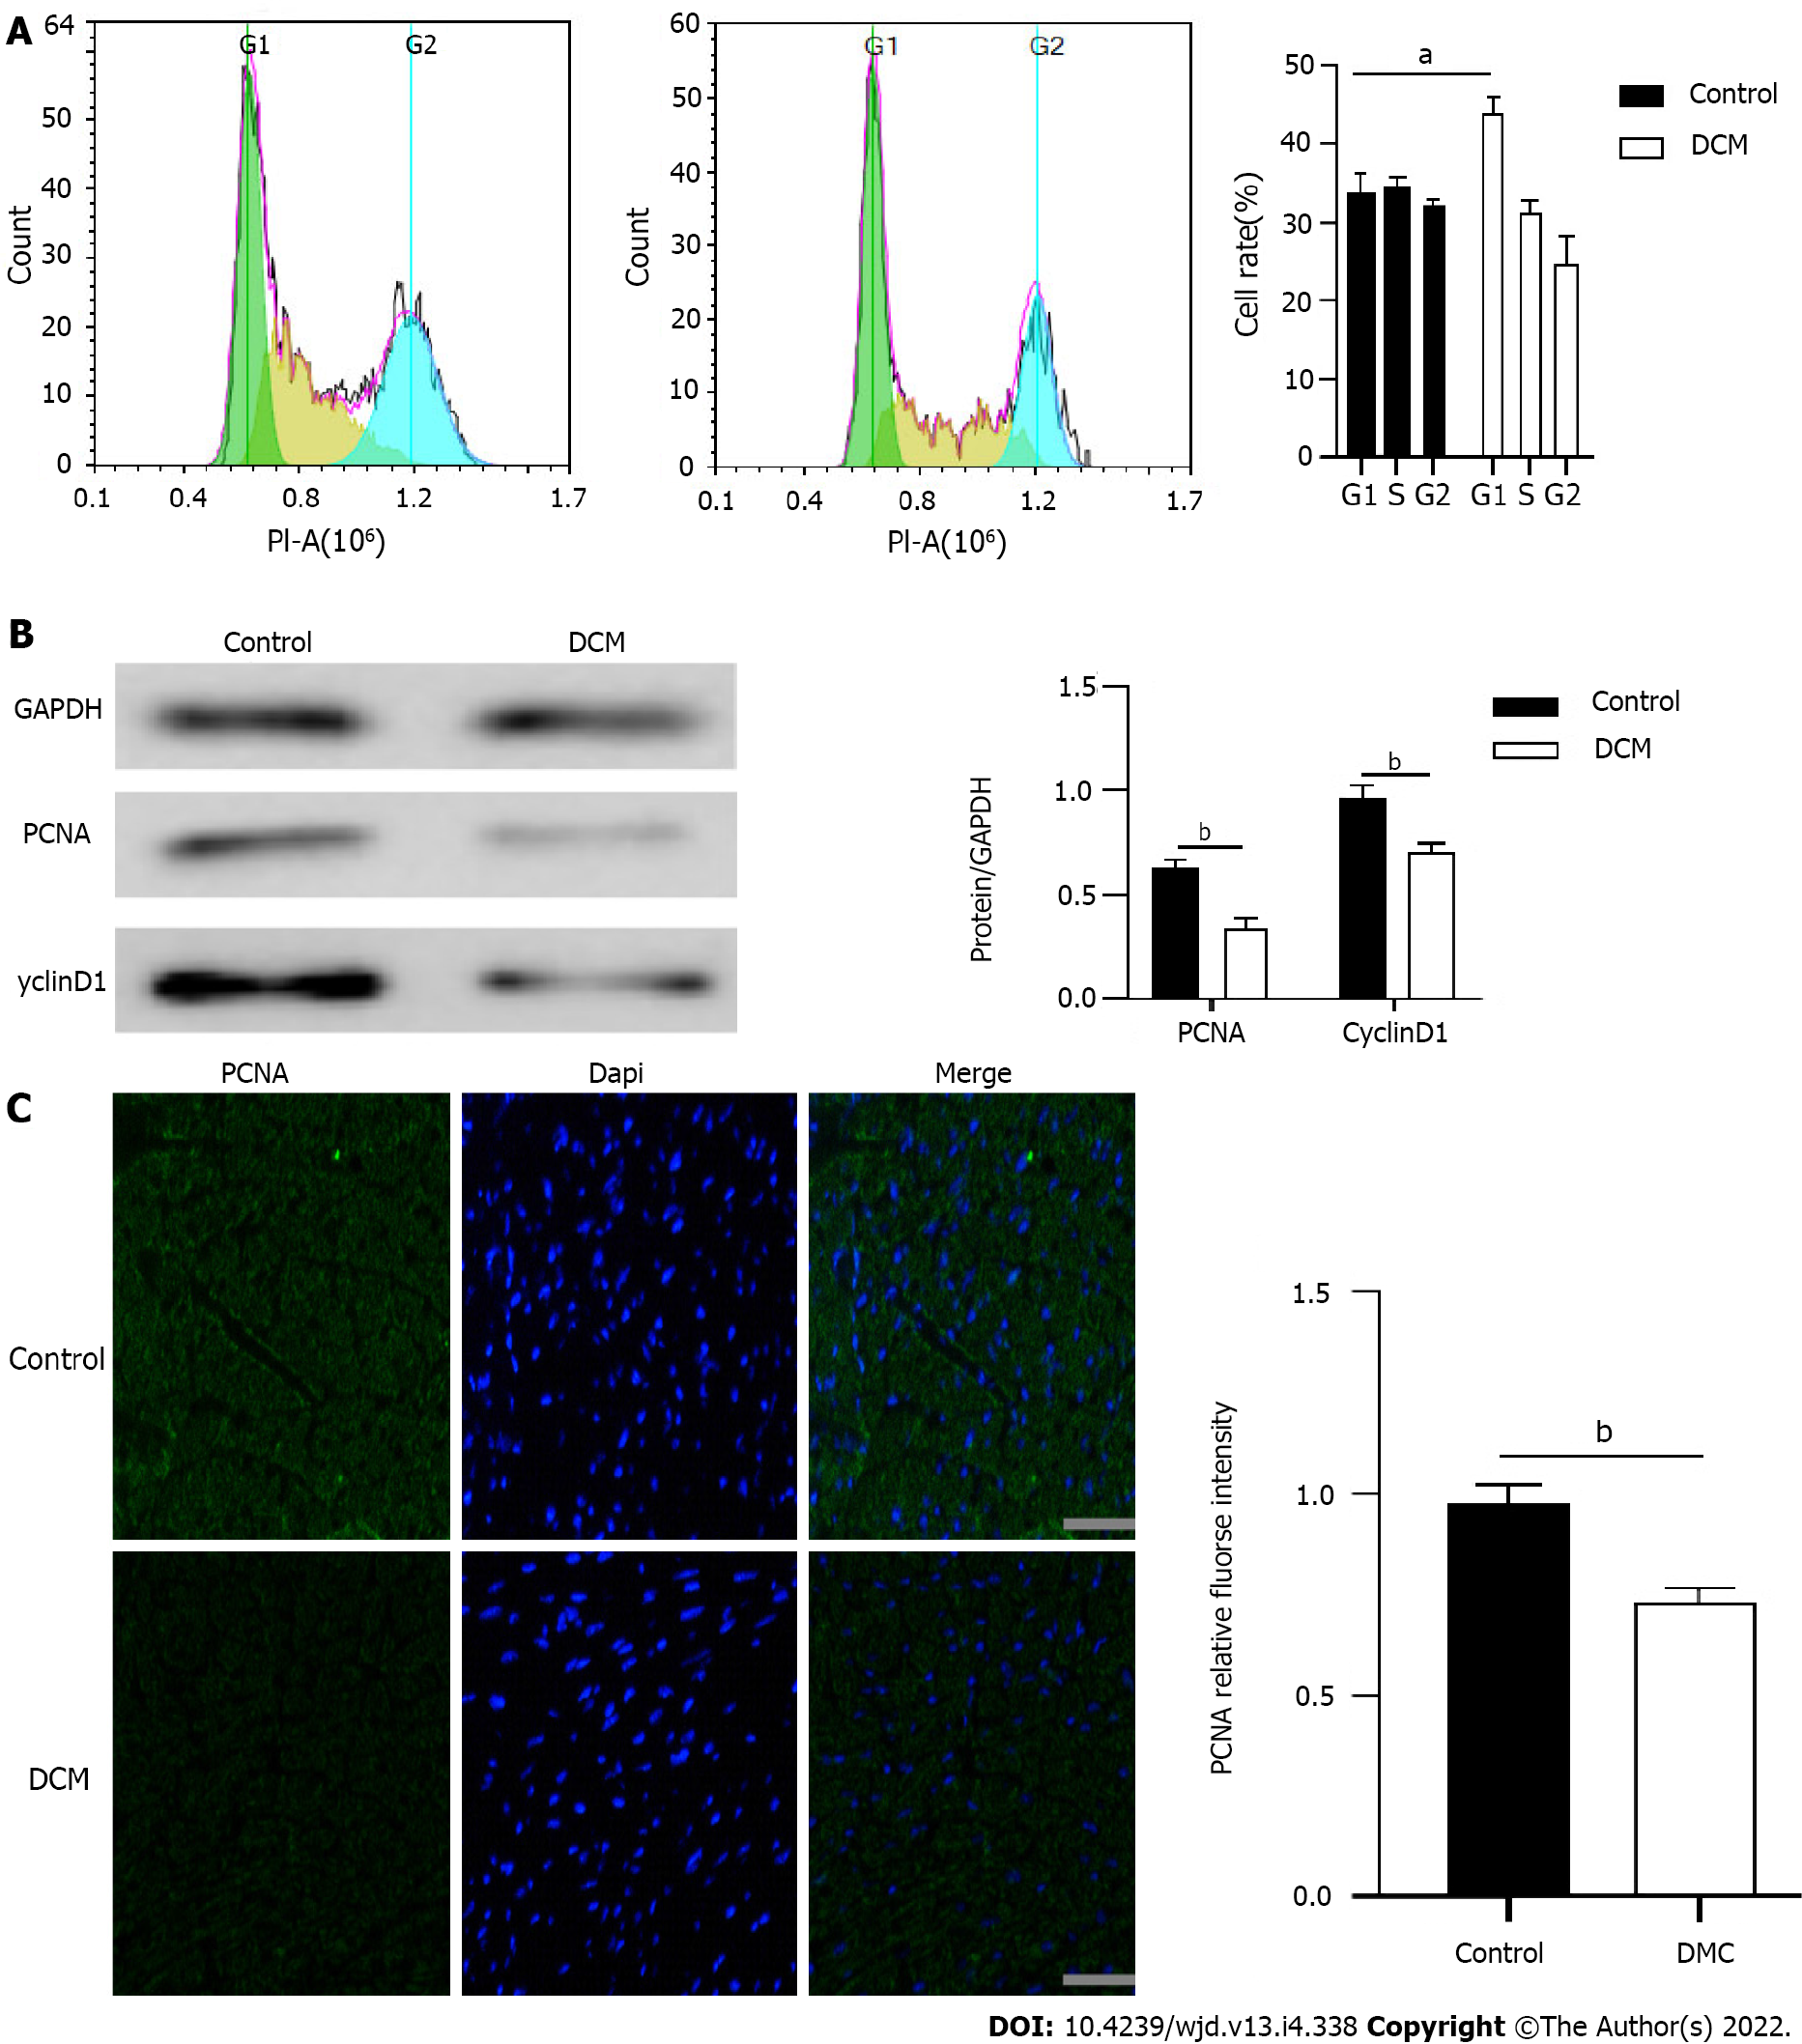
Figure 3 Proliferation of cardiomyocytes in diabetic cardiomyopathy mice.
A: Cell cycle was detected by flow cytometry for the percentage of cells in each cell cycle of diabetic cardiomyopathy (DCM) and control mice. n = 5, unpaired t-test, aP < 0.001; B: The expression levels of cardiac cell cycle related proteins PCNA and CyclinD1 in DCM and control mice. n = 5, unpaired t-test, bP < 0.01; C: Fluorescence intensity of PCNA in cardiac myocytes of DCM and control mice. Scale bars = 20 μm, bP < 0.01. DCM: Diabetic cardiomyopathy.
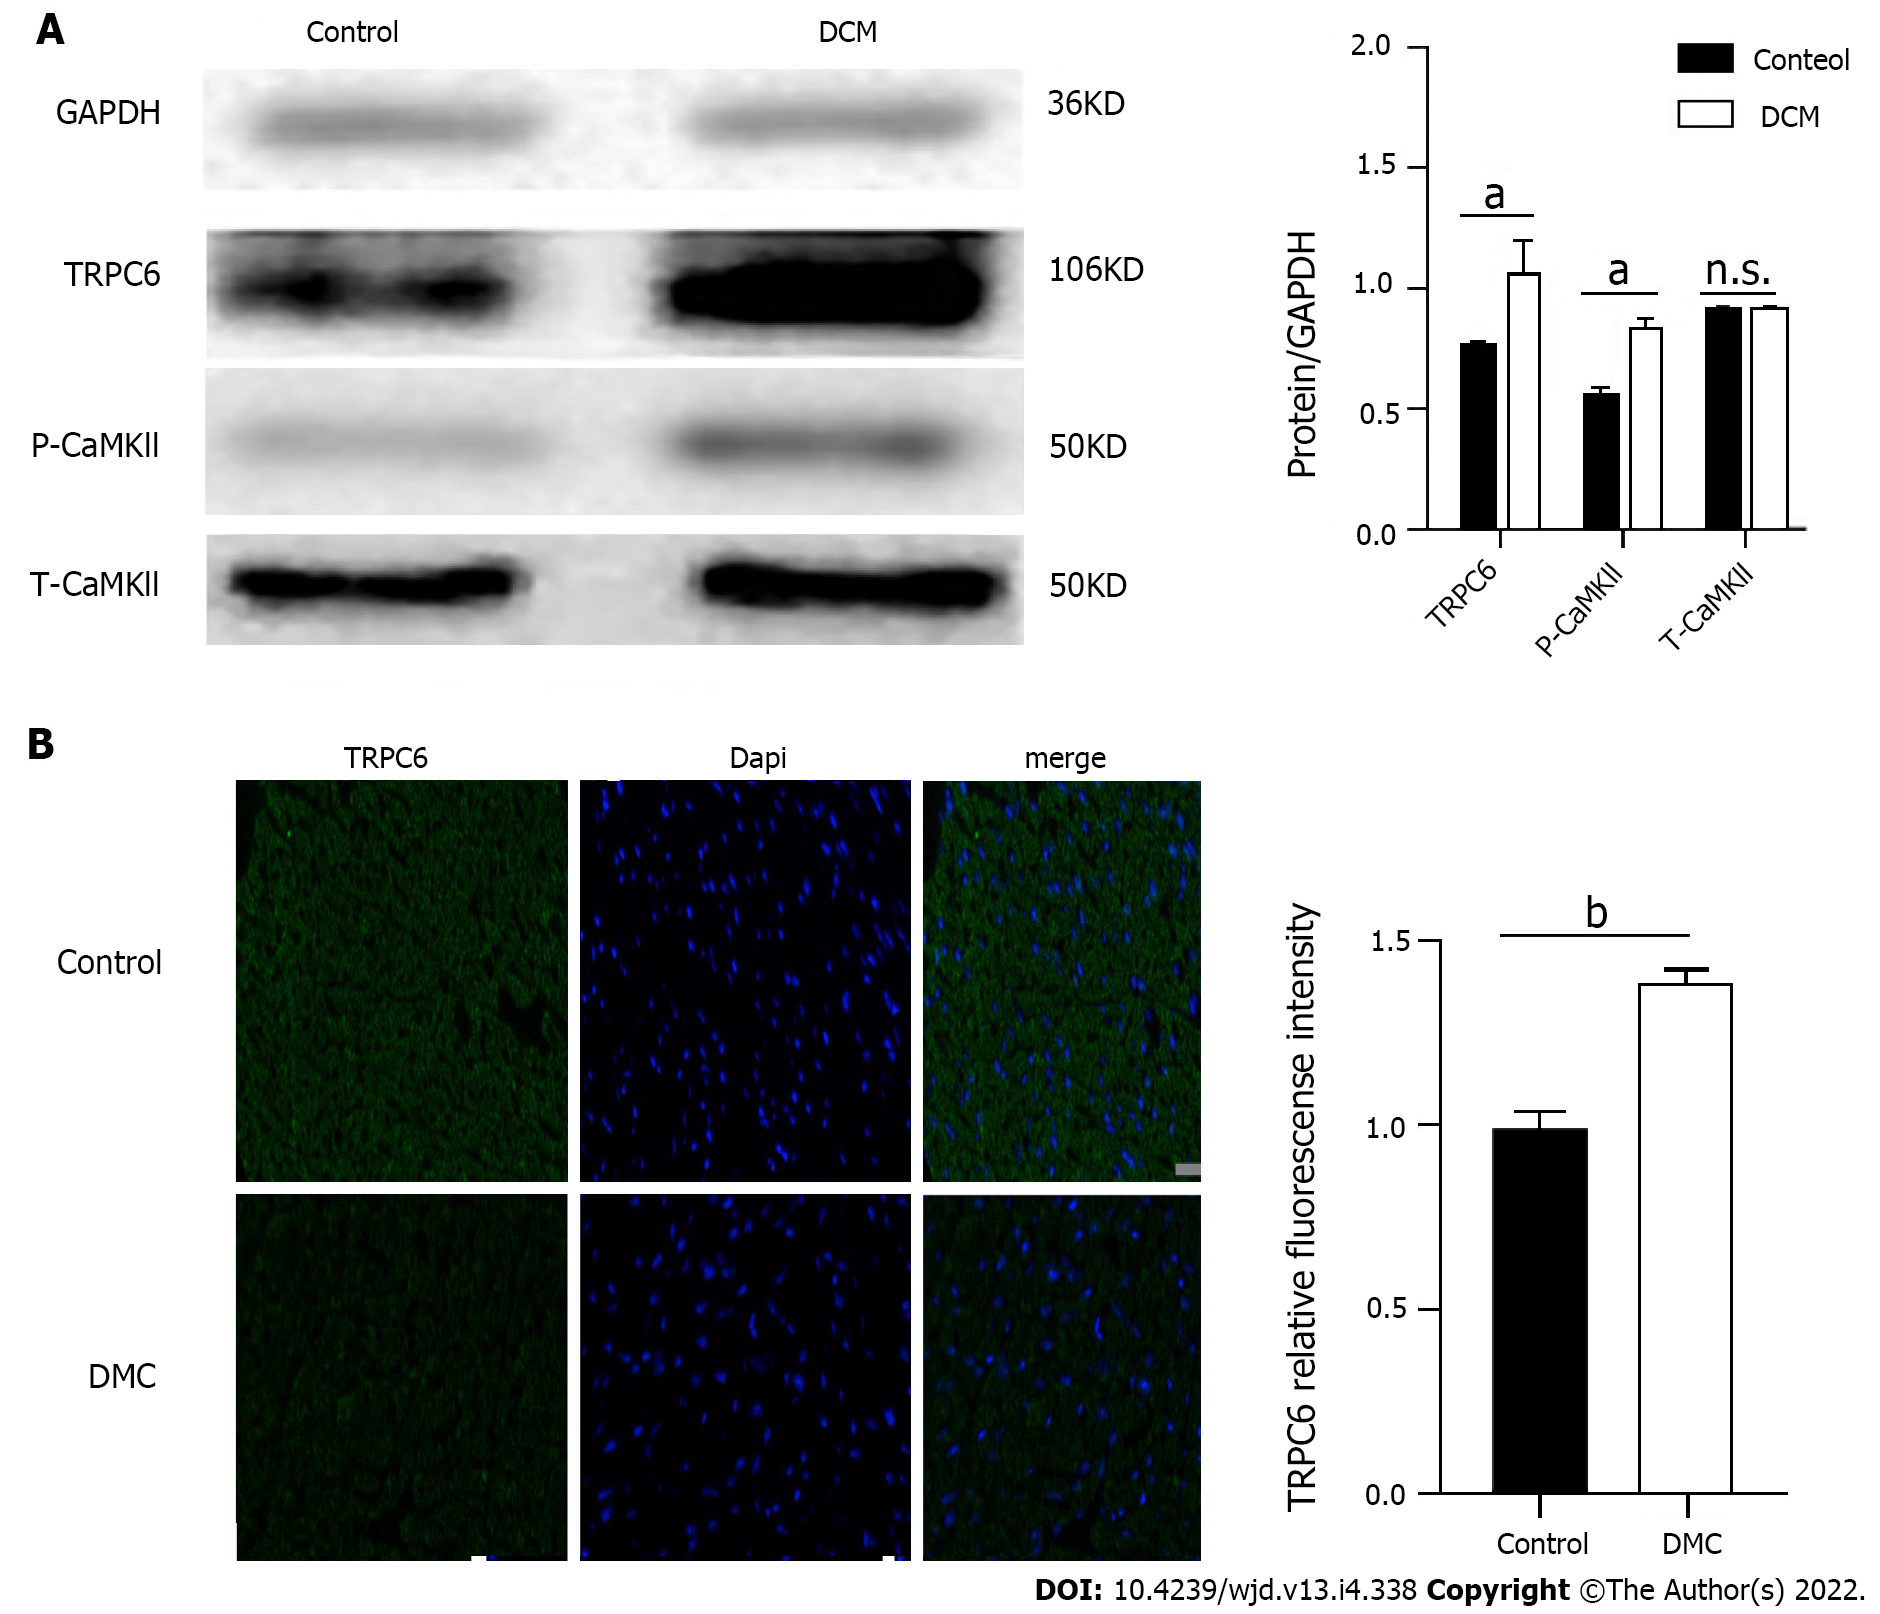
Figure 4 Expression of transient receptor potential channel 6 and P-CAMKII proteins in the myocardium of diabetic cardiomyopathy mice.
A: Expression levels of calcium channel protein transient receptor potential channel 6 (TRPC6) and P-CAMKII in cardiac myocytes of diabetic cardiomyopathy (DCM) and control mice. n = 5, unpaired t-test, aP < 0.01. n.s.: No statistical difference; B: Fluorescence intensity of TRPC6 in cardiac myocytes of DCM and control mice. Scale bars = 20 μm, bP < 0.001. DCM: Diabetic cardiomyopathy; TRPC6: Transient receptor potential channel 6.
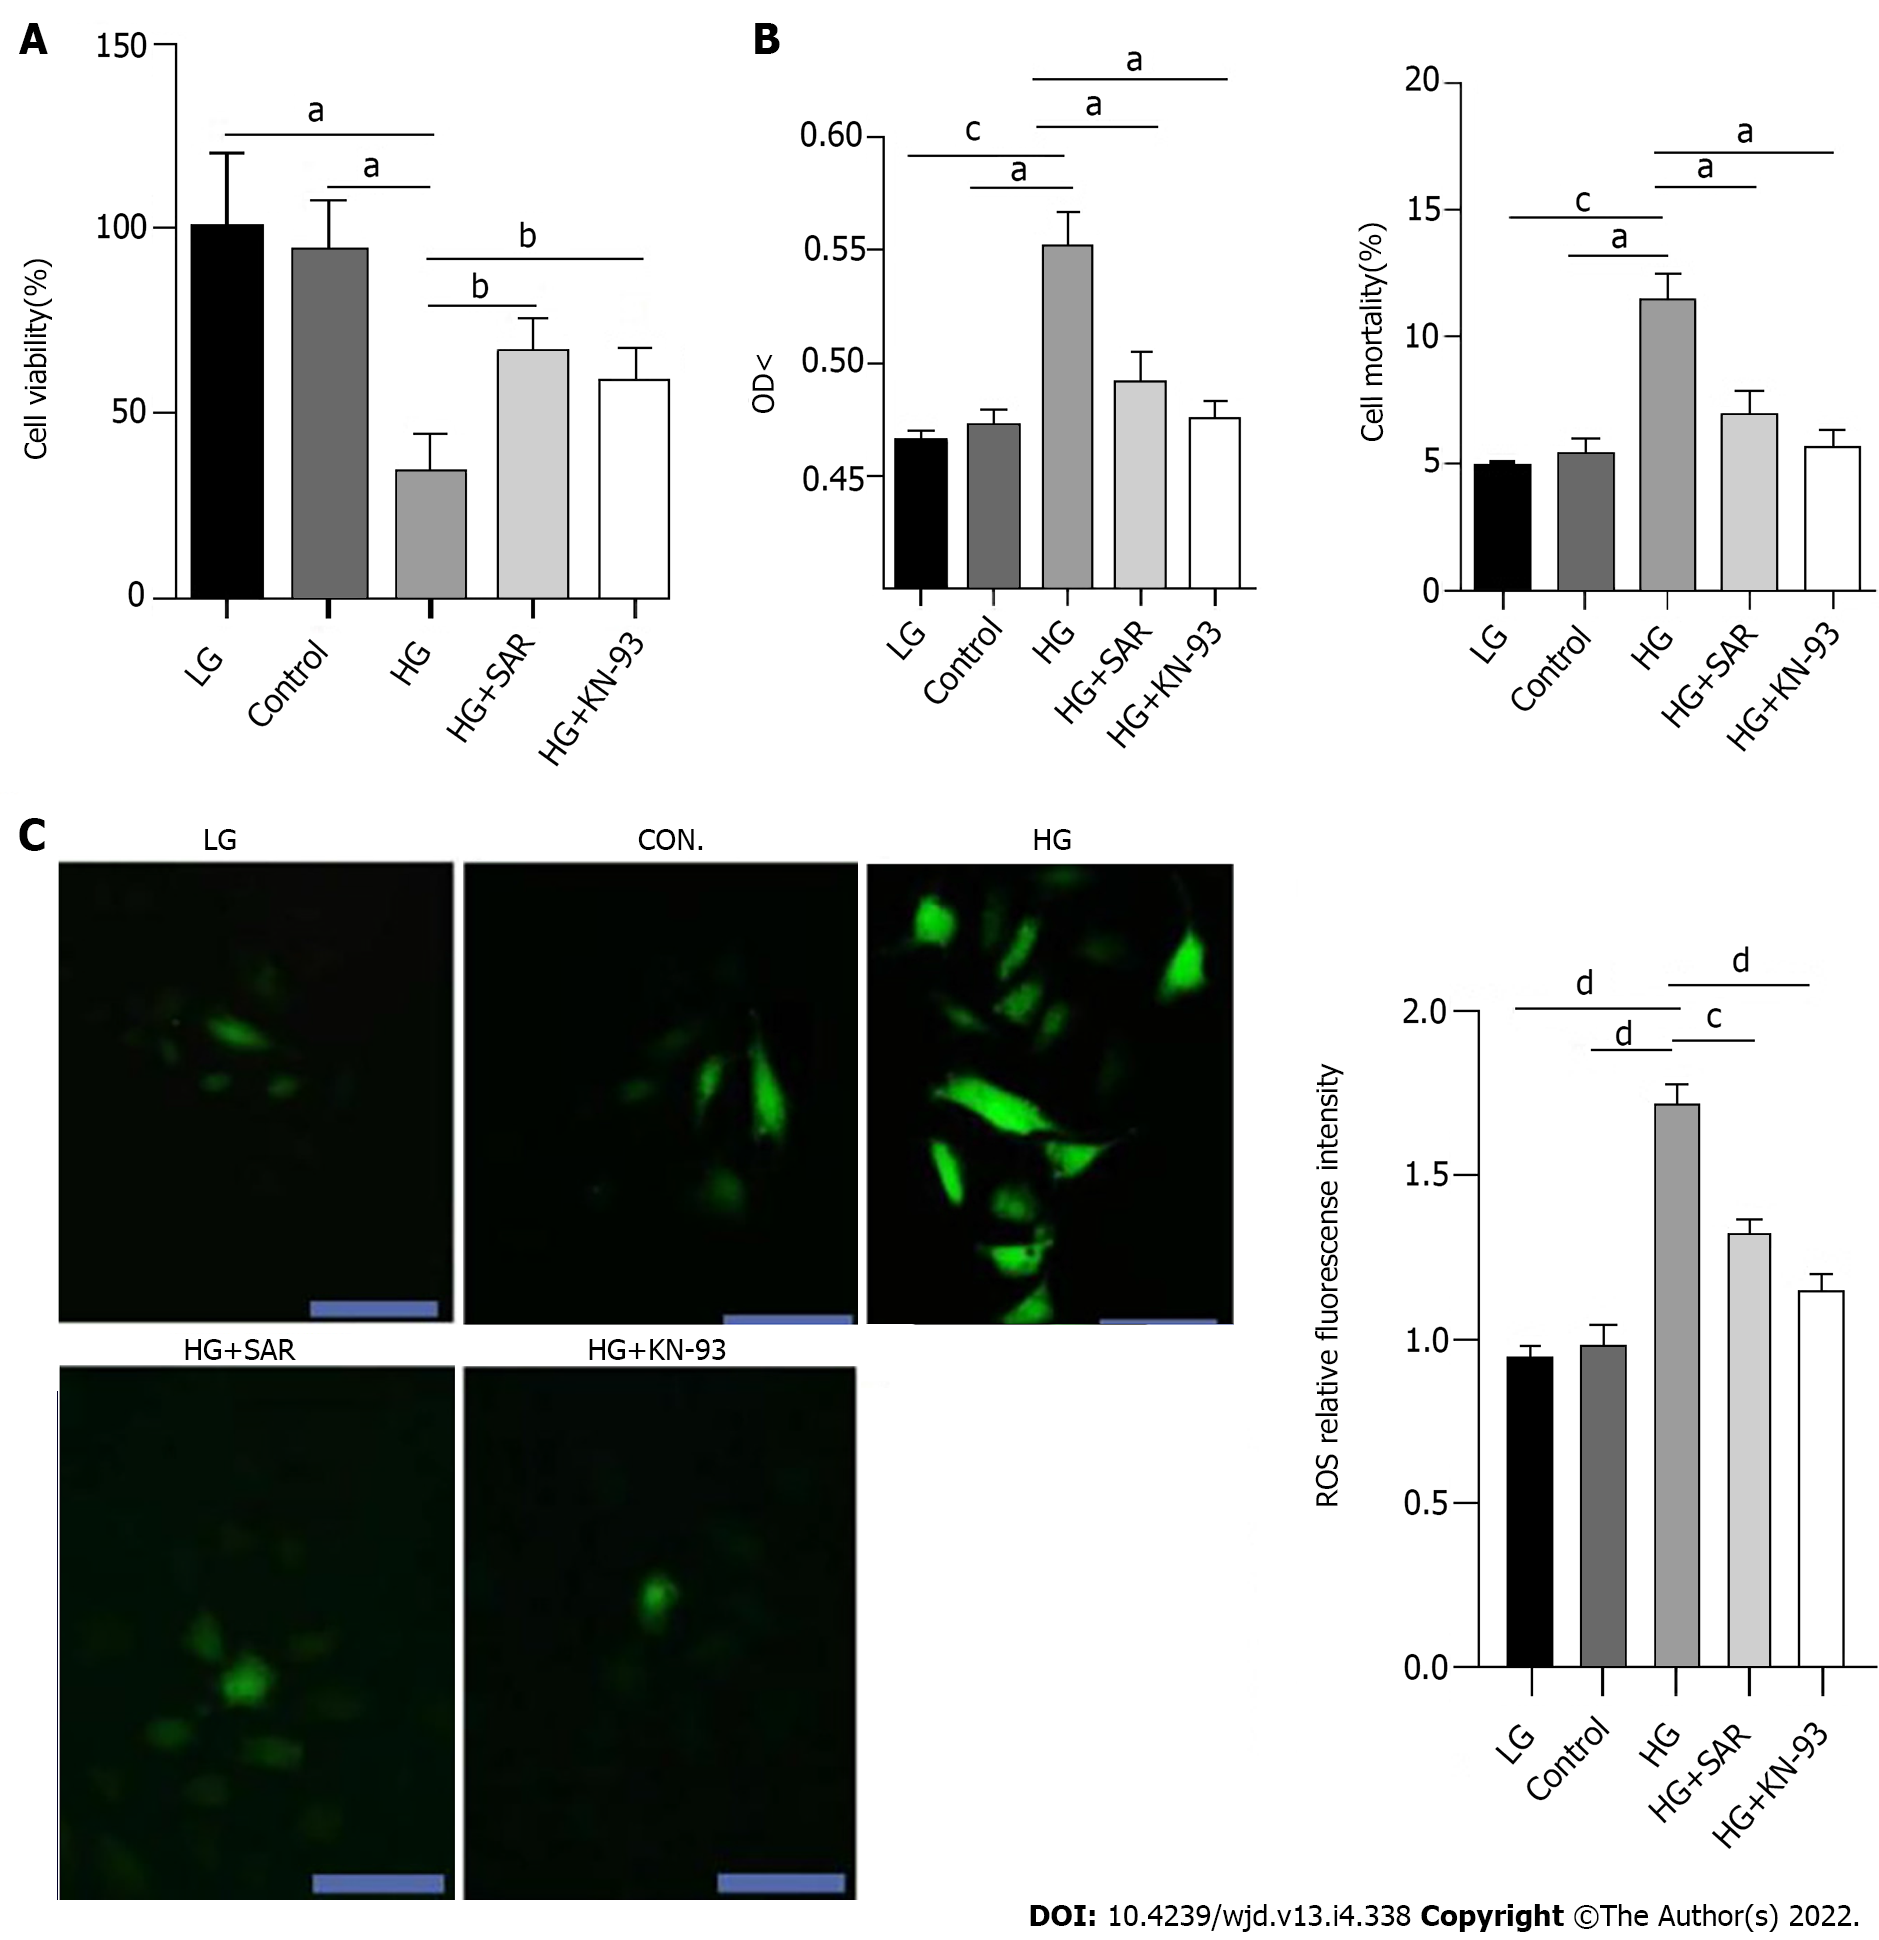
Figure 5 Pathological and biochemical changes of H9C2 cardiomyocytes in each group.
A: After high glucose induced injury of H9C2 cells, the effects of SAR7334 and KN-93 on the proliferation of H9C2 cells were observed by Cell Counting Kit-8 method. aP < 0.01, bP < 0.05; B: After high glucose induced injury of H9C2 cells, lactate dehydrogenase method was used to detect the effects of SAR and KN-93 on the mortality of H9C2 cells. n = 5, unpaired t-test, aP < 0.01, cP < 0.001; C: Reactive oxygen species fluorescence intensity of each group after treatment with fluorescent probe DCFH-DA. n = 5, unpaired t-test, scale bars = 20 μm, cP < 0.001, dP < 0.0001. HG: High-glucose; LG: Low-glucose.
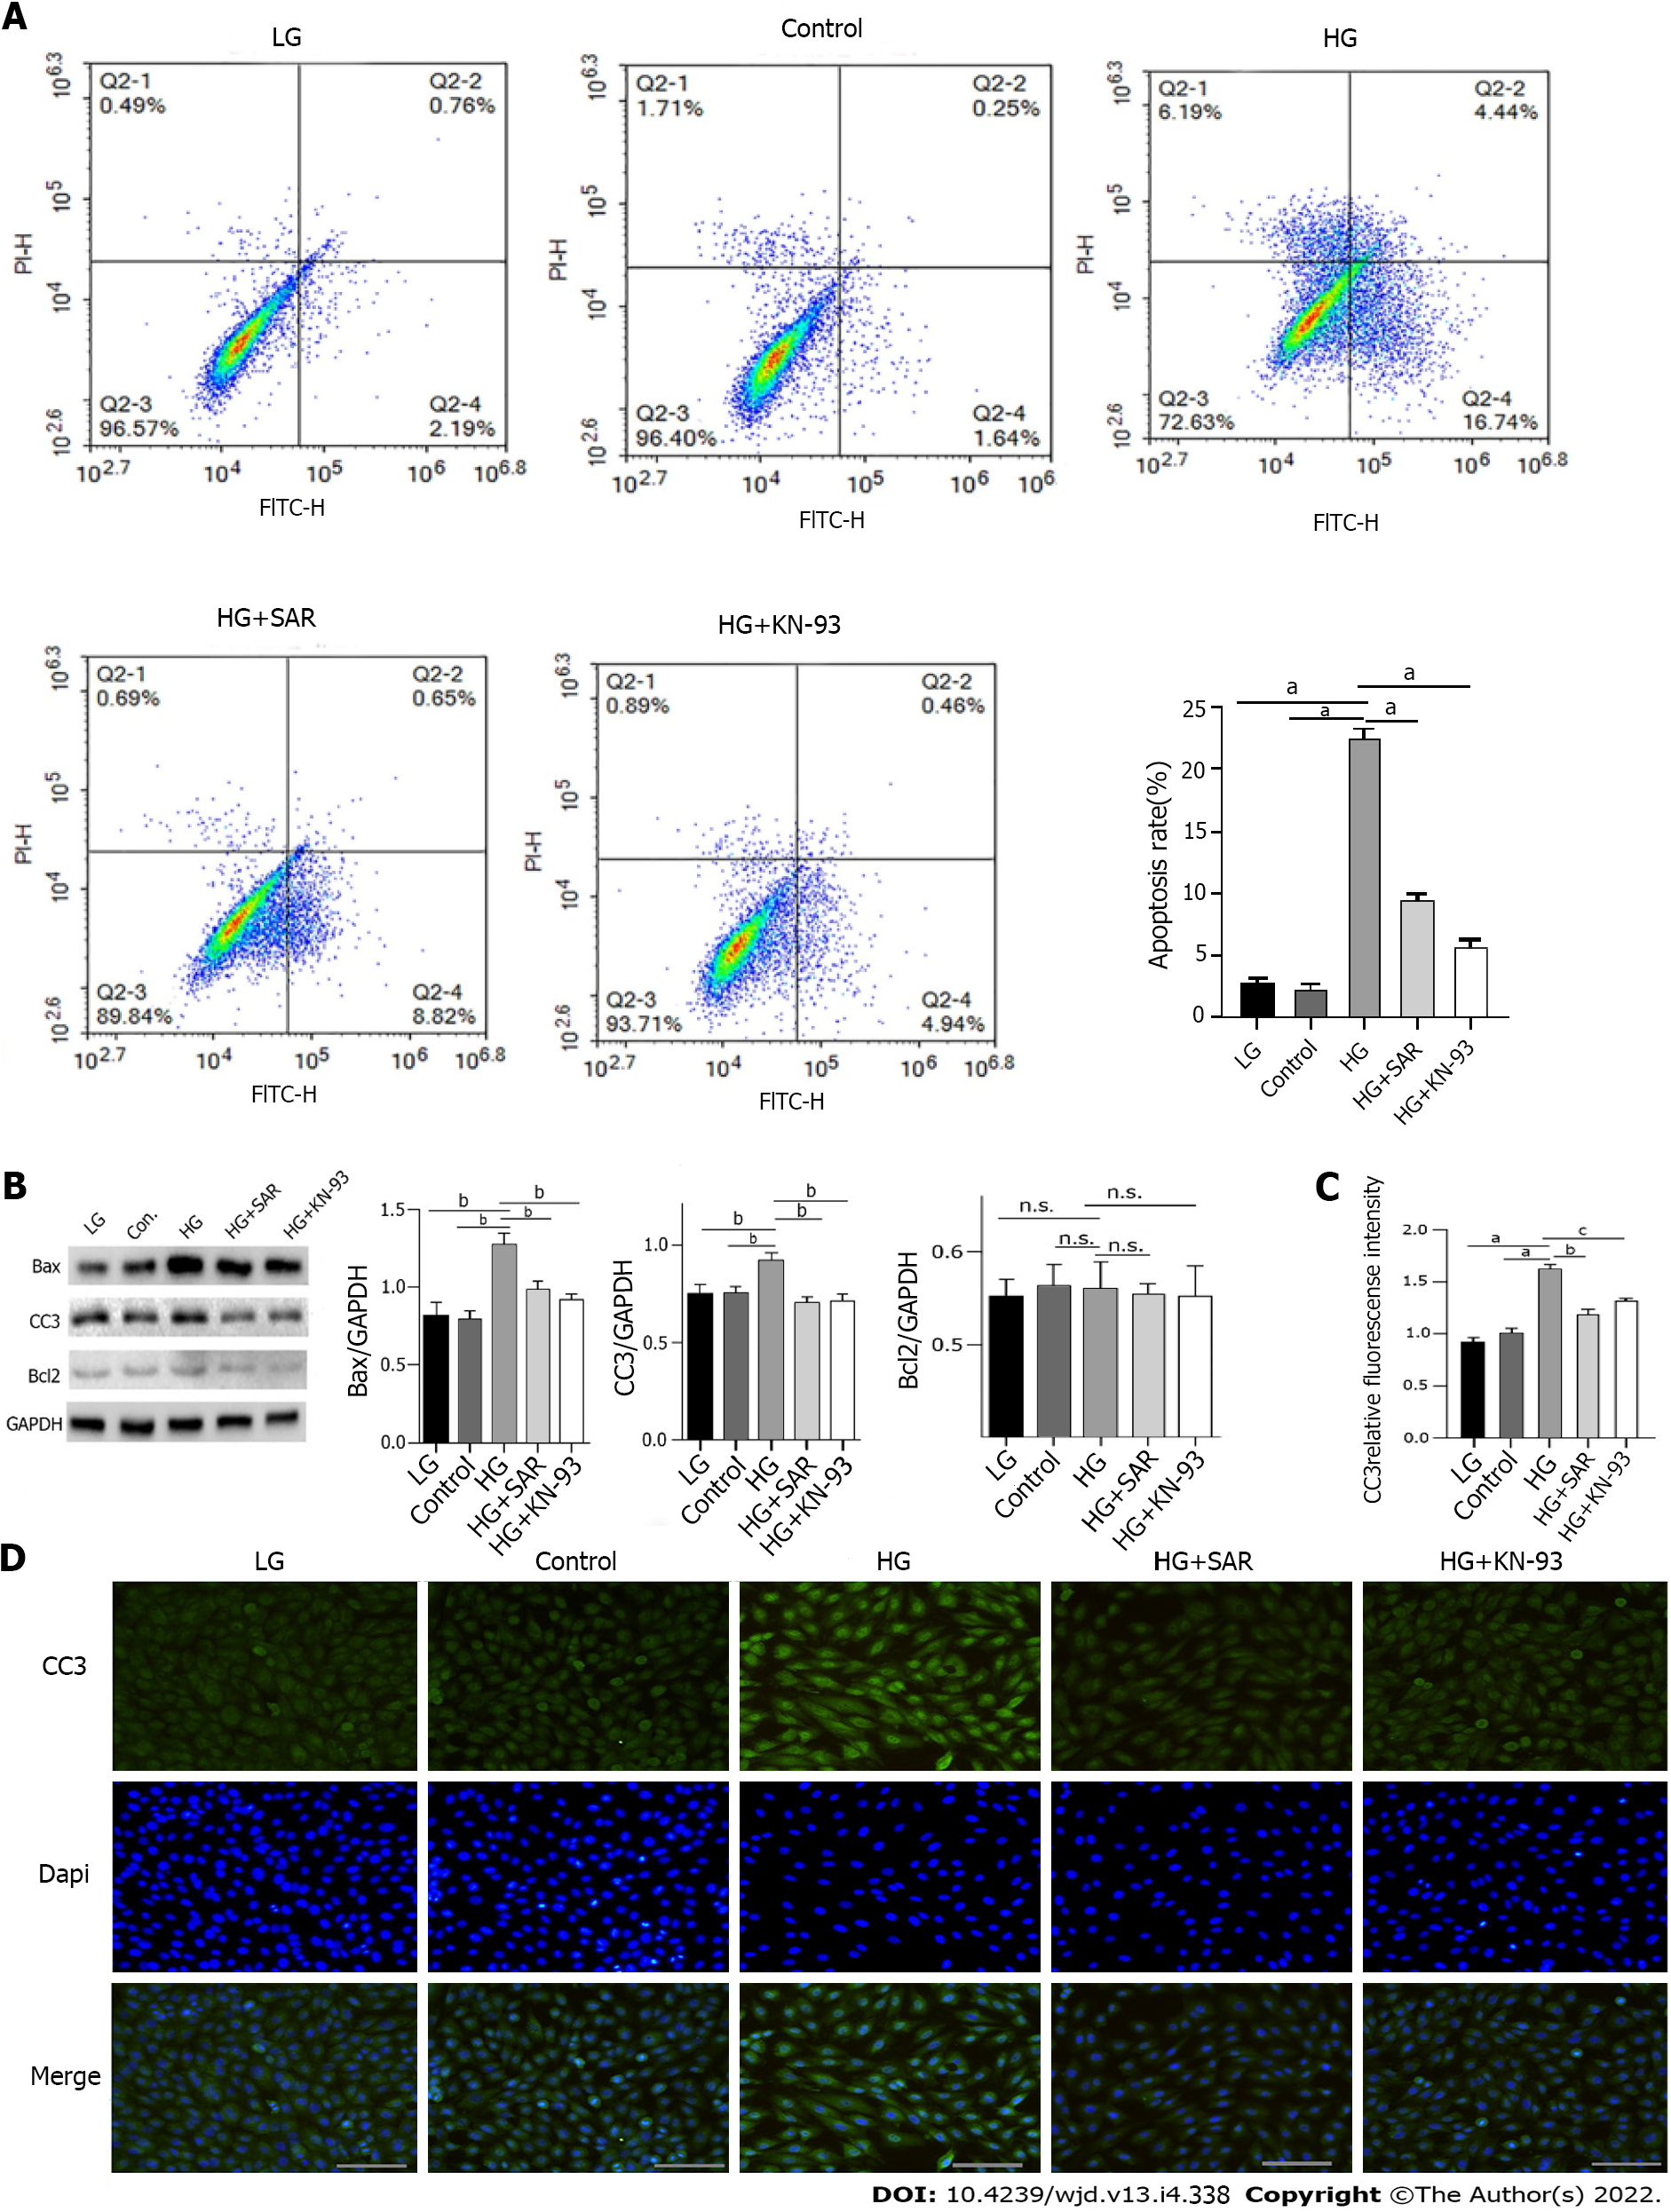
Figure 6 Effects of SAR7334 and KN-93 on high-glucose-induced apoptosis of H9C2 cells.
A: Apoptosis rate of H9C2 cells in each group was detected by flow cytometry. n = 5, unpaired t-test, aP < 0.0001; B: Effects of SAR7334 and KN-93 on the expression of apoptosis related proteins Bax, cleaved Caspase 3 (CC3), and BCl2 in H9C2 cells induced by high glucose. n = 5, unpaired t-test, bP < 0.001. n.s.: No statistical difference; C and D: Expression of apoptosis protein CC3 detected by immunofluorescence. n = 5, unpaired t-test, aP < 0.0001, bP < 0.001, cP < 0.01. Scale bars = 10 μm. HG: High-glucose; LG: Low-glucose.
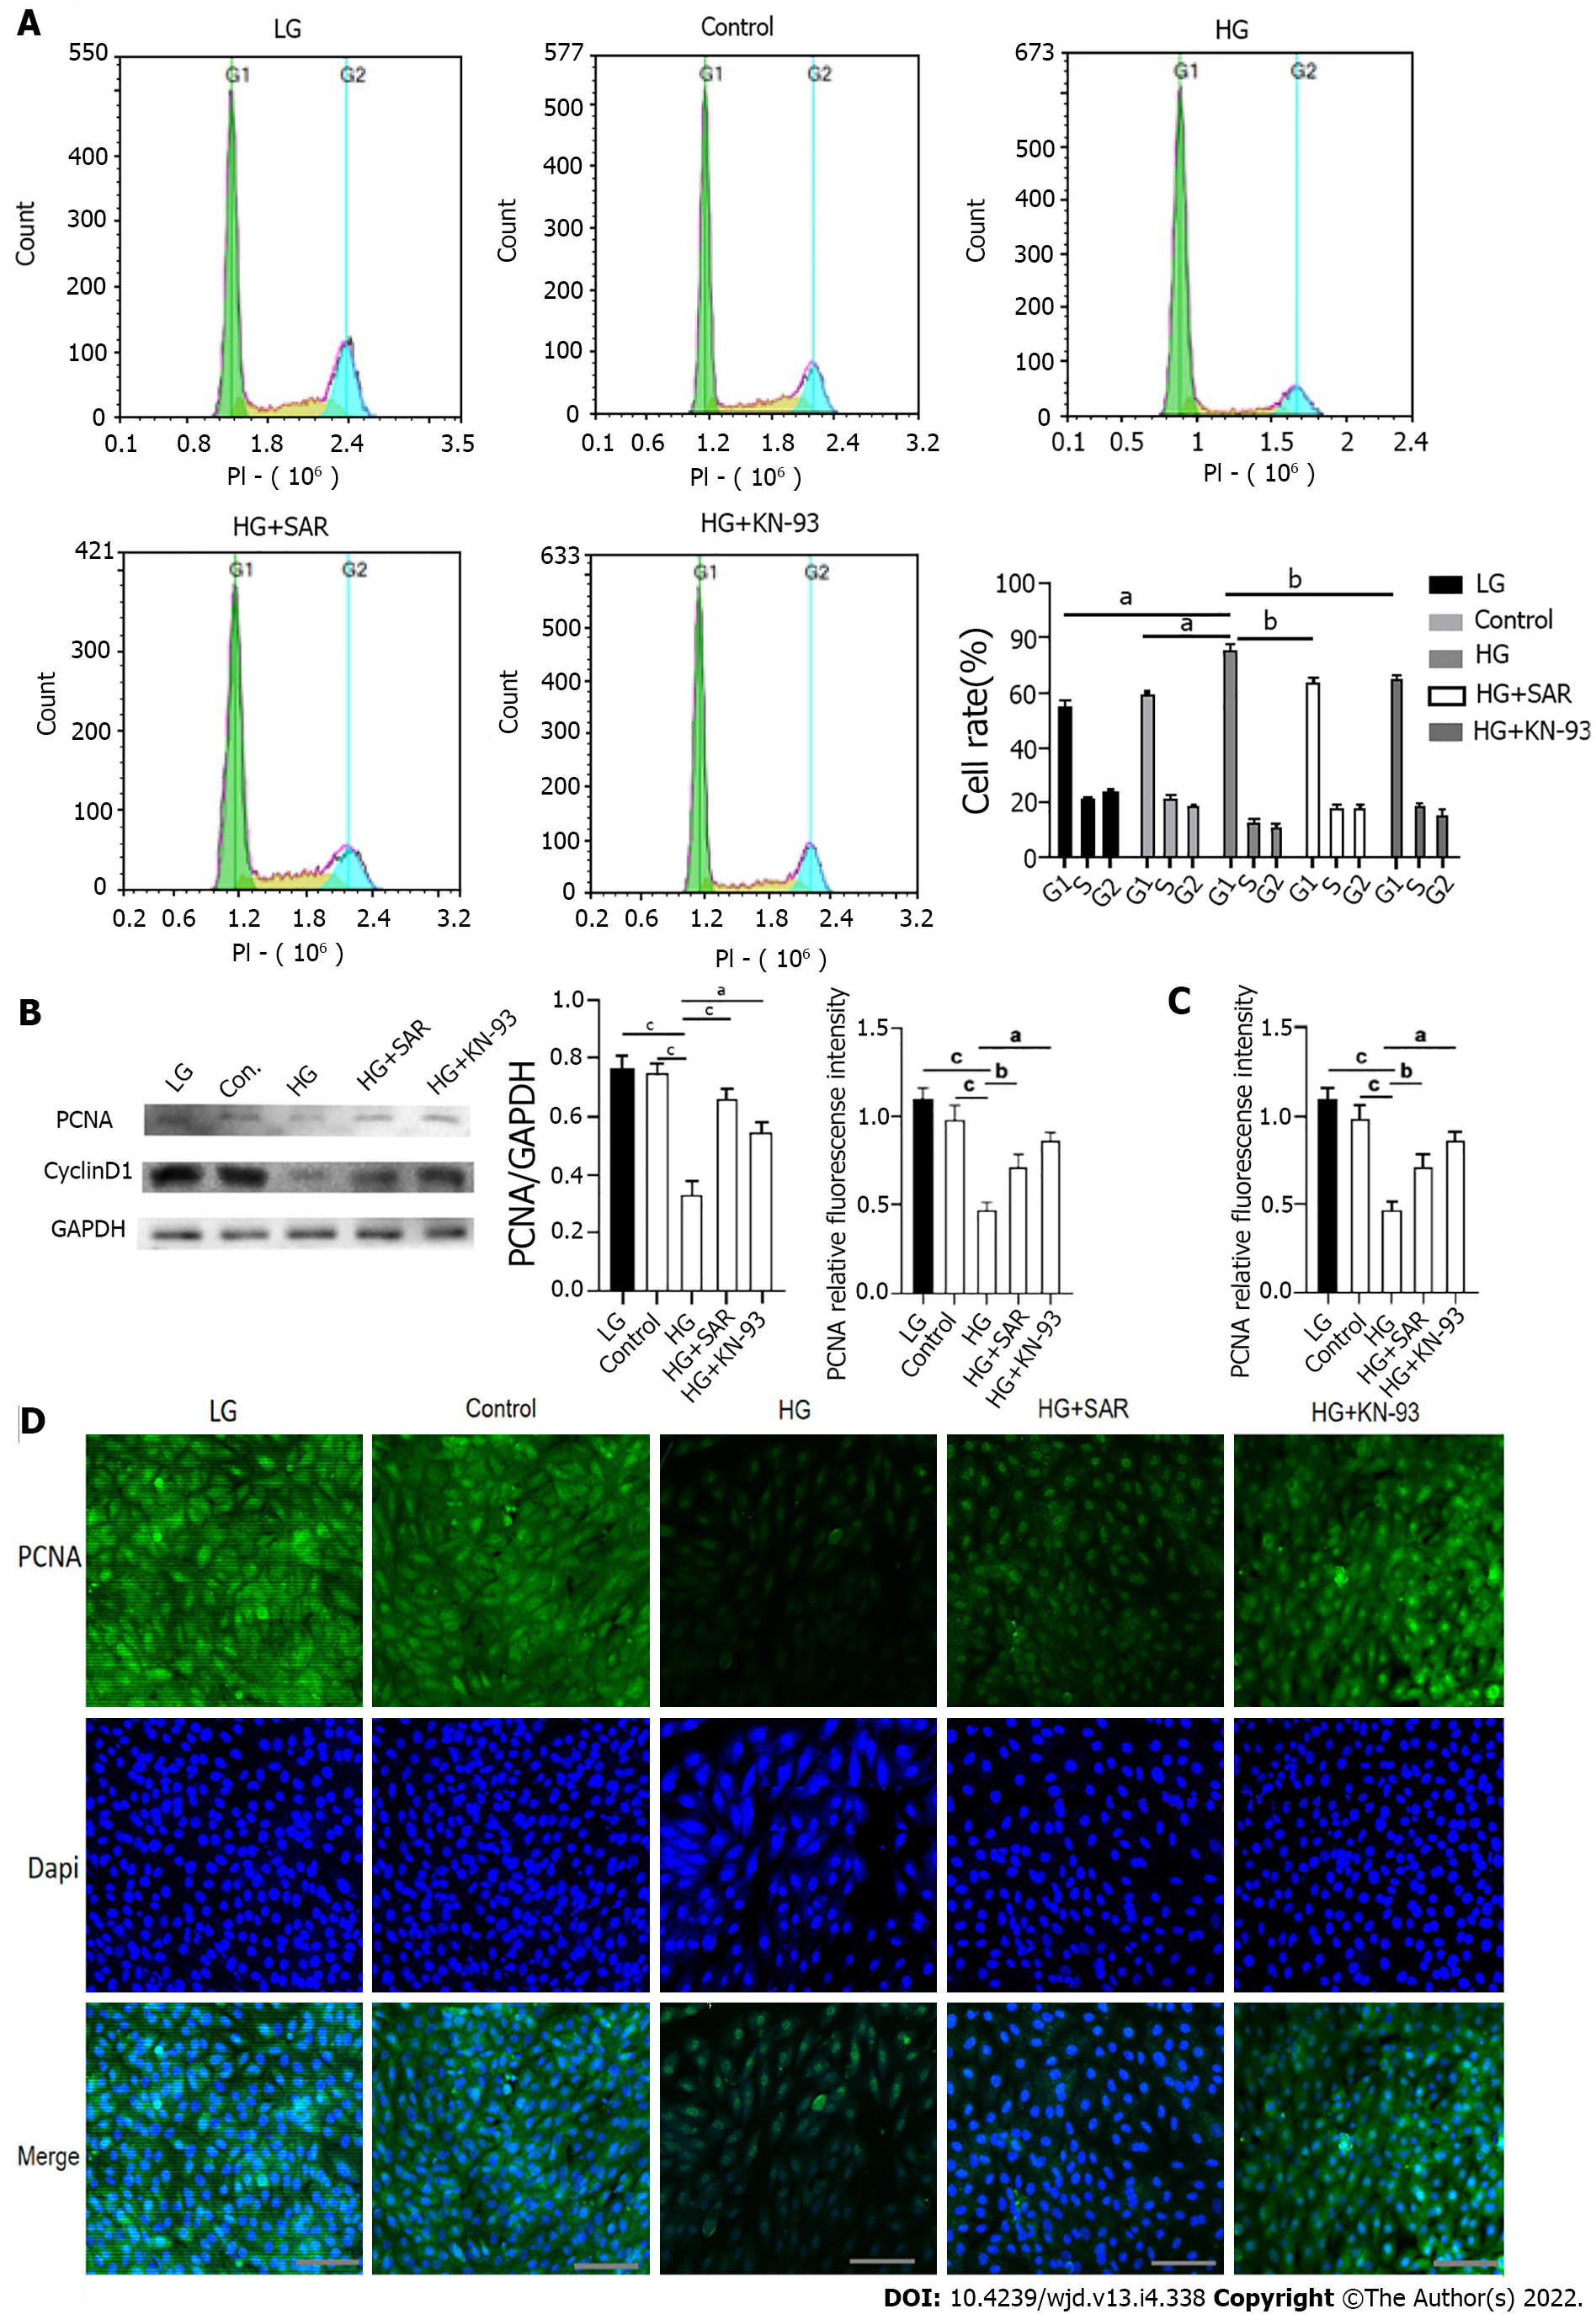
Figure 7 Effects of SAR7334 and KN-93 on high-glucose-induced inhibition of H9C2 cell proliferation.
A: Percentage of cells in each group in each period was detected by flow cytometry. n = 5, unpaired t-test, aP < 0.001, bP < 0.01; B: Effects of SAR7334 and KN-93 on the expression levels of cycle related proteins PCNA and CyclinD1 in H9C2 cells induced by high glucose. n = 5, unpaired t-test, aP < 0.001, bP < 0.01, cP < 0.0001. n.s.: No statistical difference; C and D: Expression of PCNA detected by immunofluorescence. n = 5, unpaired t-test, aP < 0.001, bP < 0.01, cP < 0.0001. Scale bars = 10 μm. HG: High-glucose; LG: Low-glucose.
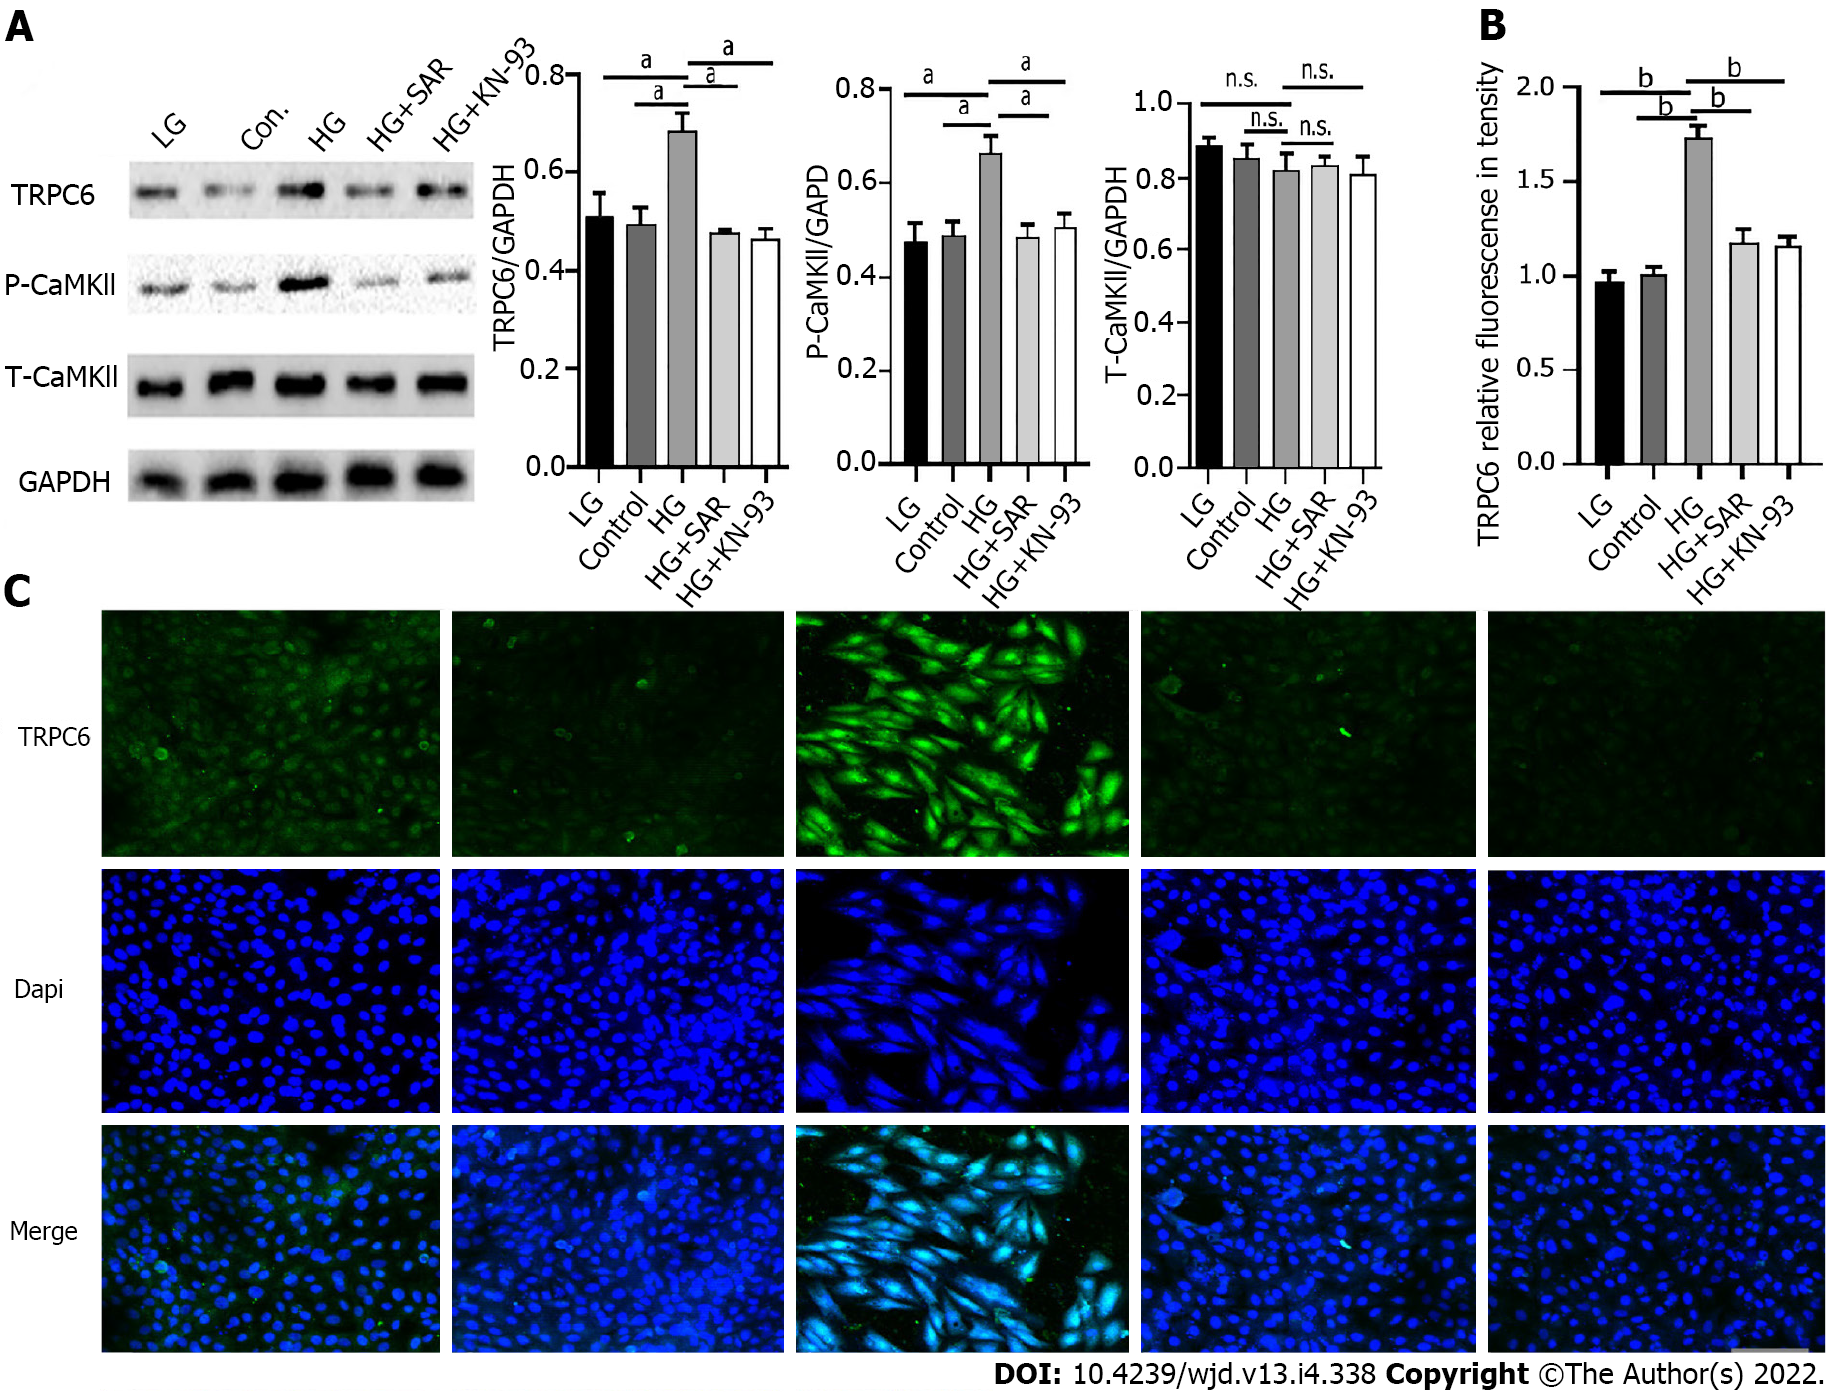
Figure 8 Changes of expression of transient receptor potential channel 6 (TRPC6) and P-CaMKll under the intervention of SAR7334 and KN-93.
A: Effects of SAR7334 and KN-93 on the expression of transient receptor potential channel 6 (TRPC6) and P-CaMKll in high glucose induced H9C2 cells. n = 5, unpaired t-test, aP < 0.001. n.s.: No statistical difference; B and C: Expression of TRPC6 protein detected by immunofluorescence. n = 5, unpaired t-test, bP < 0.0001. Scale bars = 10 μm. HG: High-glucose; LG: Low-glucose; TRPC6: Transient receptor potential channel 6.
- Citation: Jiang SJ. Roles of transient receptor potential channel 6 in glucose-induced cardiomyocyte injury . World J Diabetes 2022; 13(4): 338-357
- URL: https://www.wjgnet.com/1948-9358/full/v13/i4/338.htm
- DOI: https://dx.doi.org/10.4239/wjd.v13.i4.338


