©The Author(s) 2021.
World J Diabetes. Jul 15, 2021; 12(7): 1042-1056
Published online Jul 15, 2021. doi: 10.4239/wjd.v12.i7.1042
Published online Jul 15, 2021. doi: 10.4239/wjd.v12.i7.1042
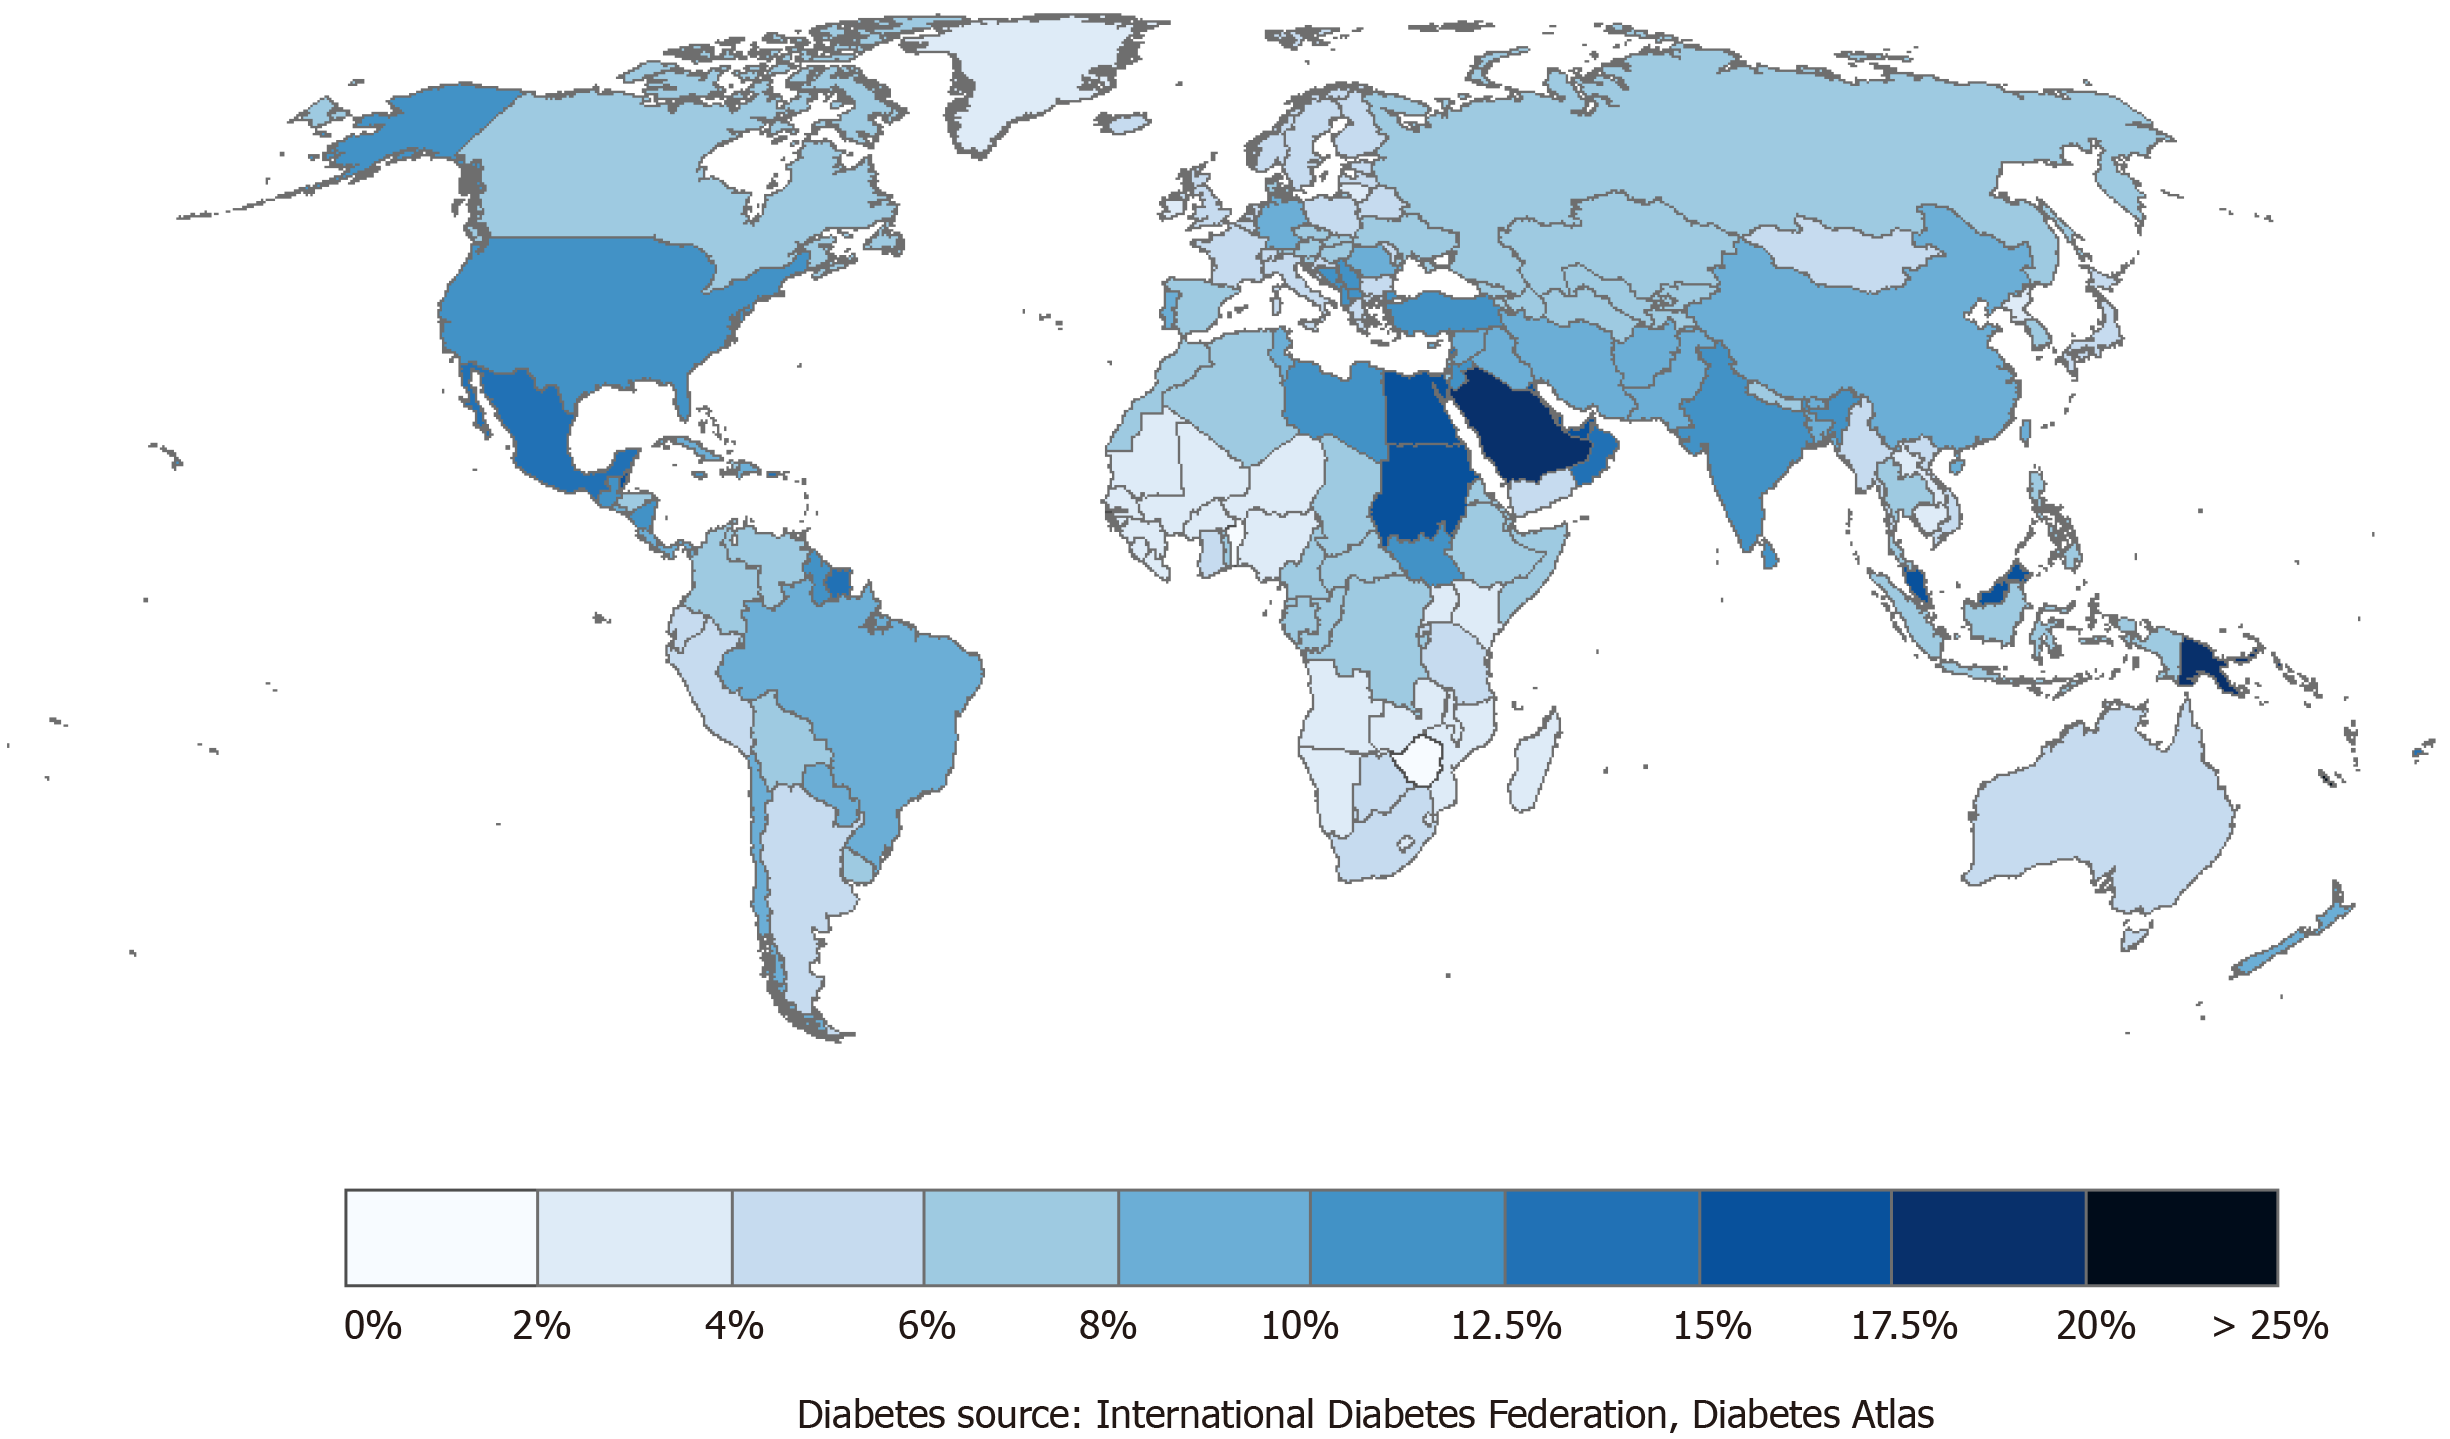
Figure 1 Global distribution of diabetes prevalence in 2017.
Maps were created using ArcGIS® by ESRI version 10.5 (http://www.esri.com)[91].
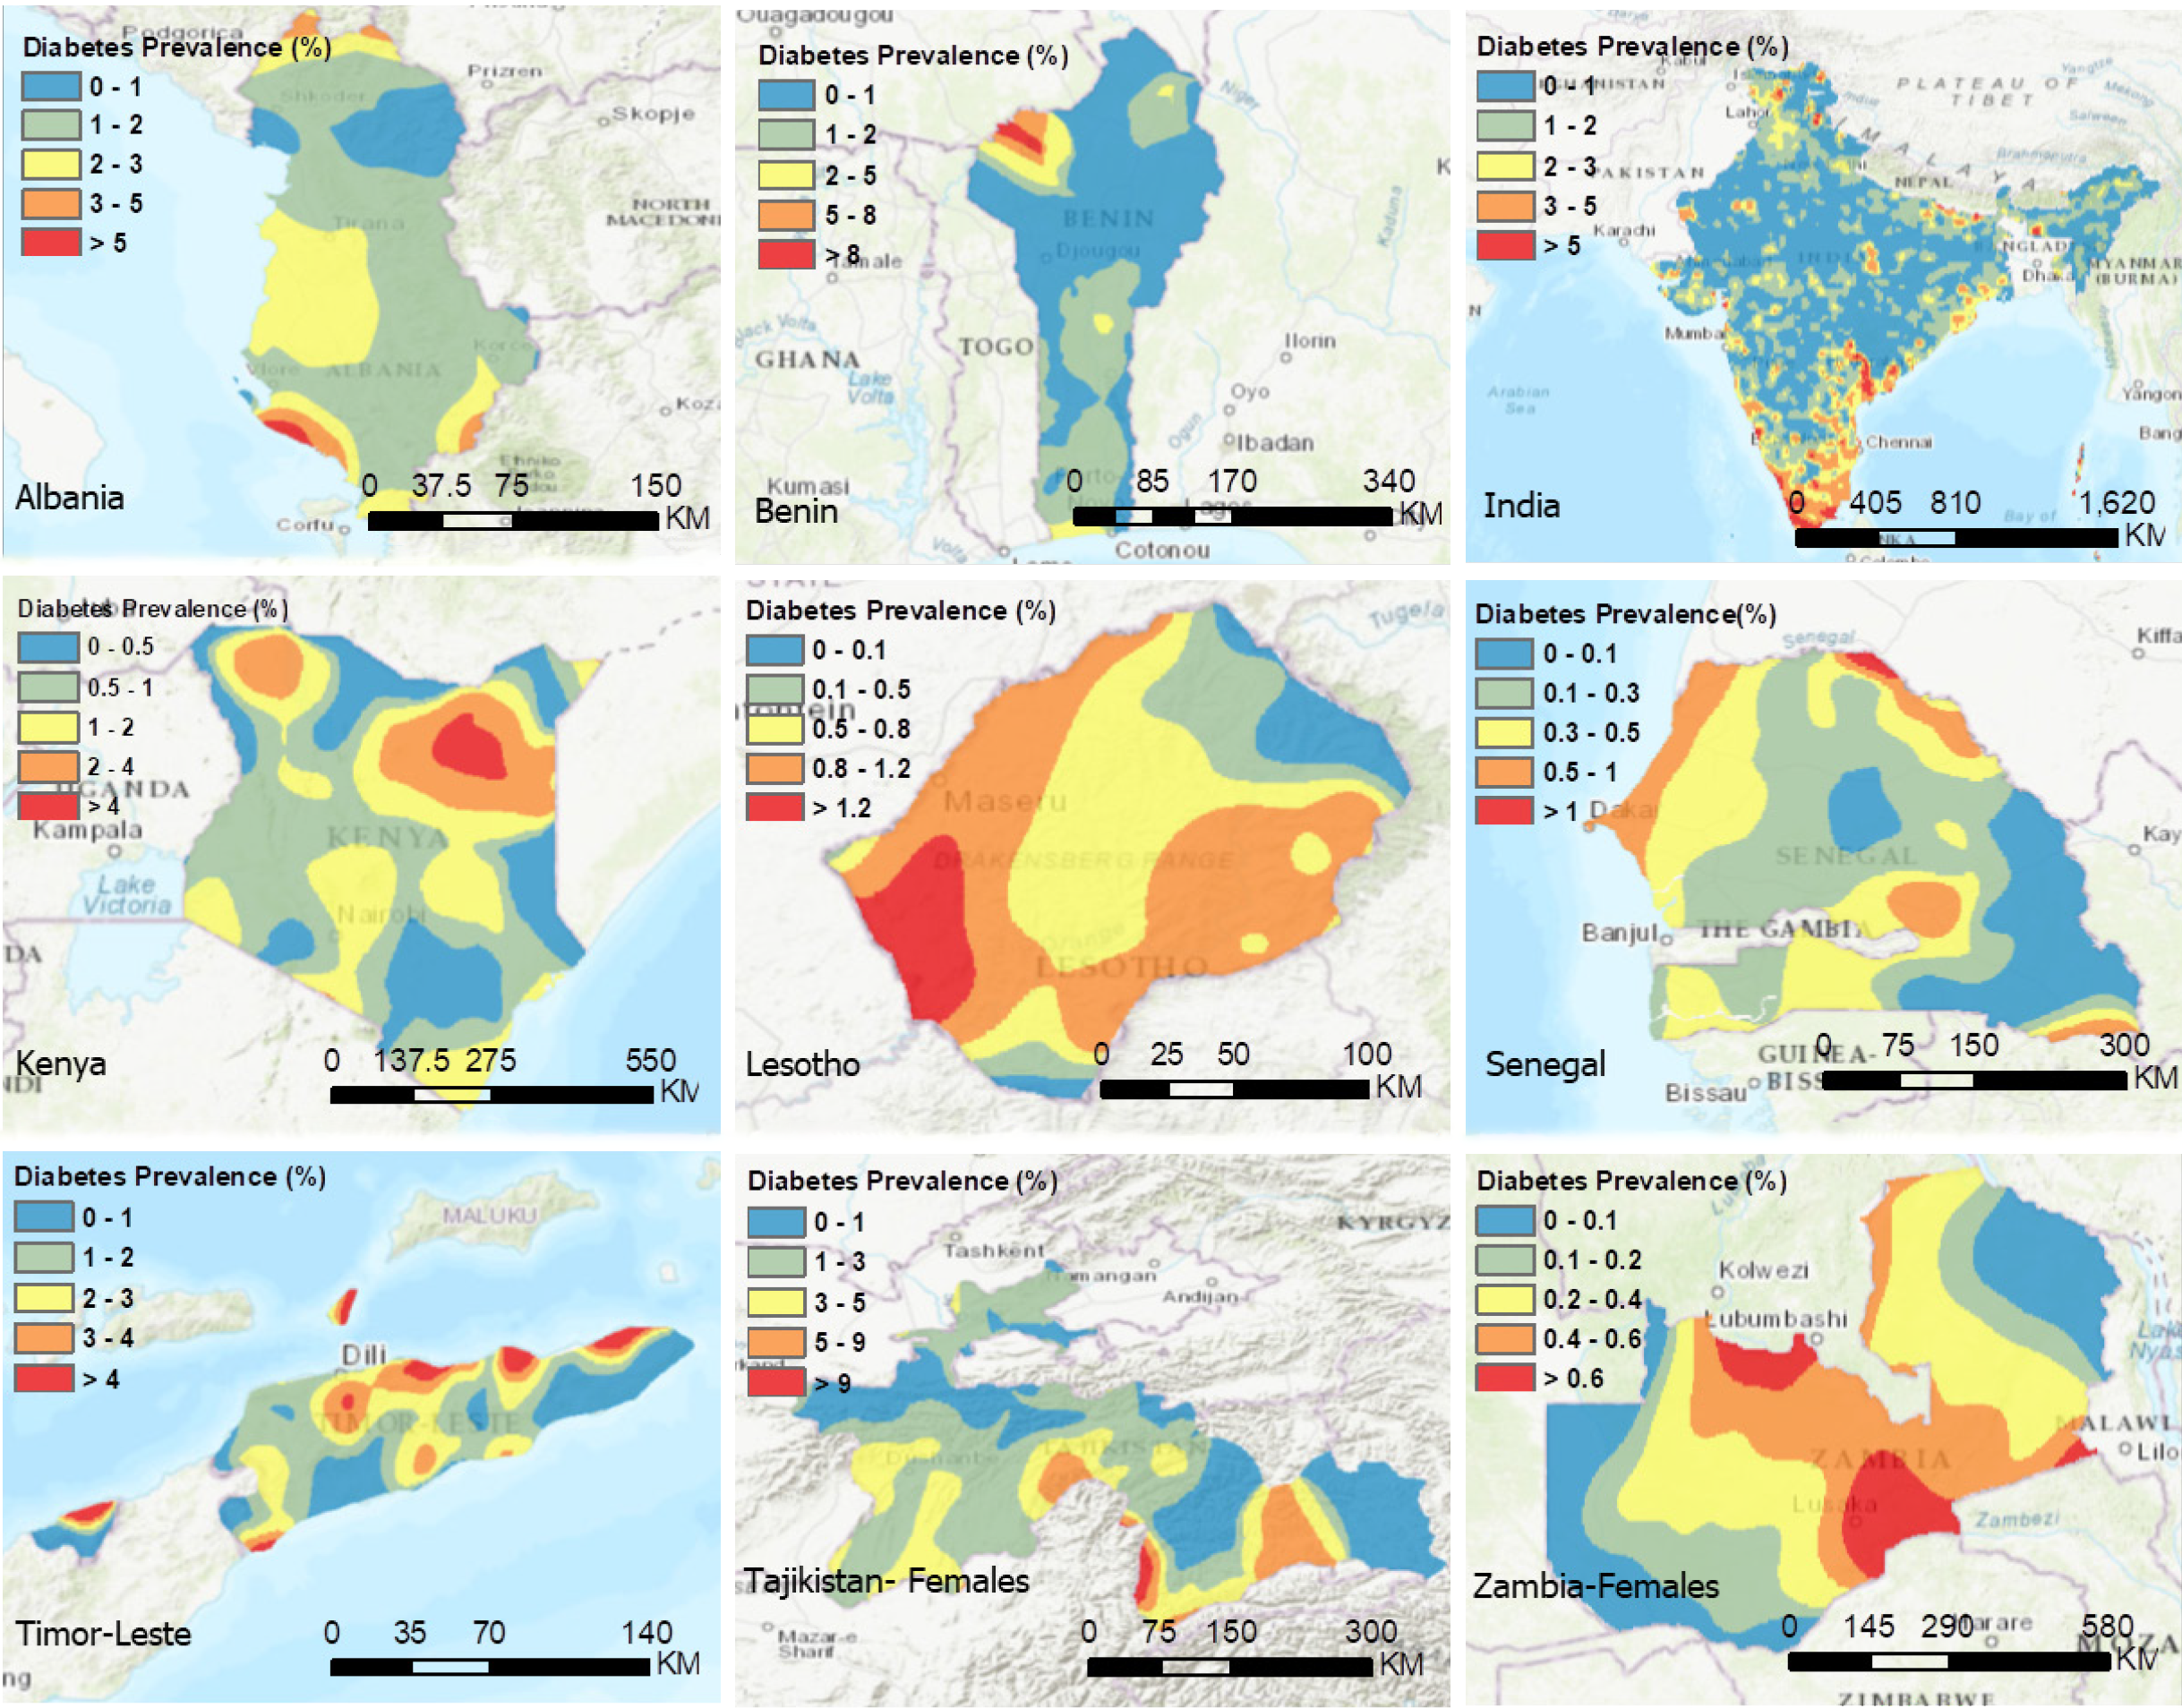
Figure 2 Spatial variations of diabetes prevalence in nine countries using a kernel smooth method.
Maps were created using ArcGIS® by ESRI version 10.5 (http://www.esri.com)[91].
- Citation: Cuadros DF, Li J, Musuka G, Awad SF. Spatial epidemiology of diabetes: Methods and insights. World J Diabetes 2021; 12(7): 1042-1056
- URL: https://www.wjgnet.com/1948-9358/full/v12/i7/1042.htm
- DOI: https://dx.doi.org/10.4239/wjd.v12.i7.1042


