©The Author(s) 2021.
World J Diabetes. Jun 15, 2021; 12(6): 893-907
Published online Jun 15, 2021. doi: 10.4239/wjd.v12.i6.893
Published online Jun 15, 2021. doi: 10.4239/wjd.v12.i6.893
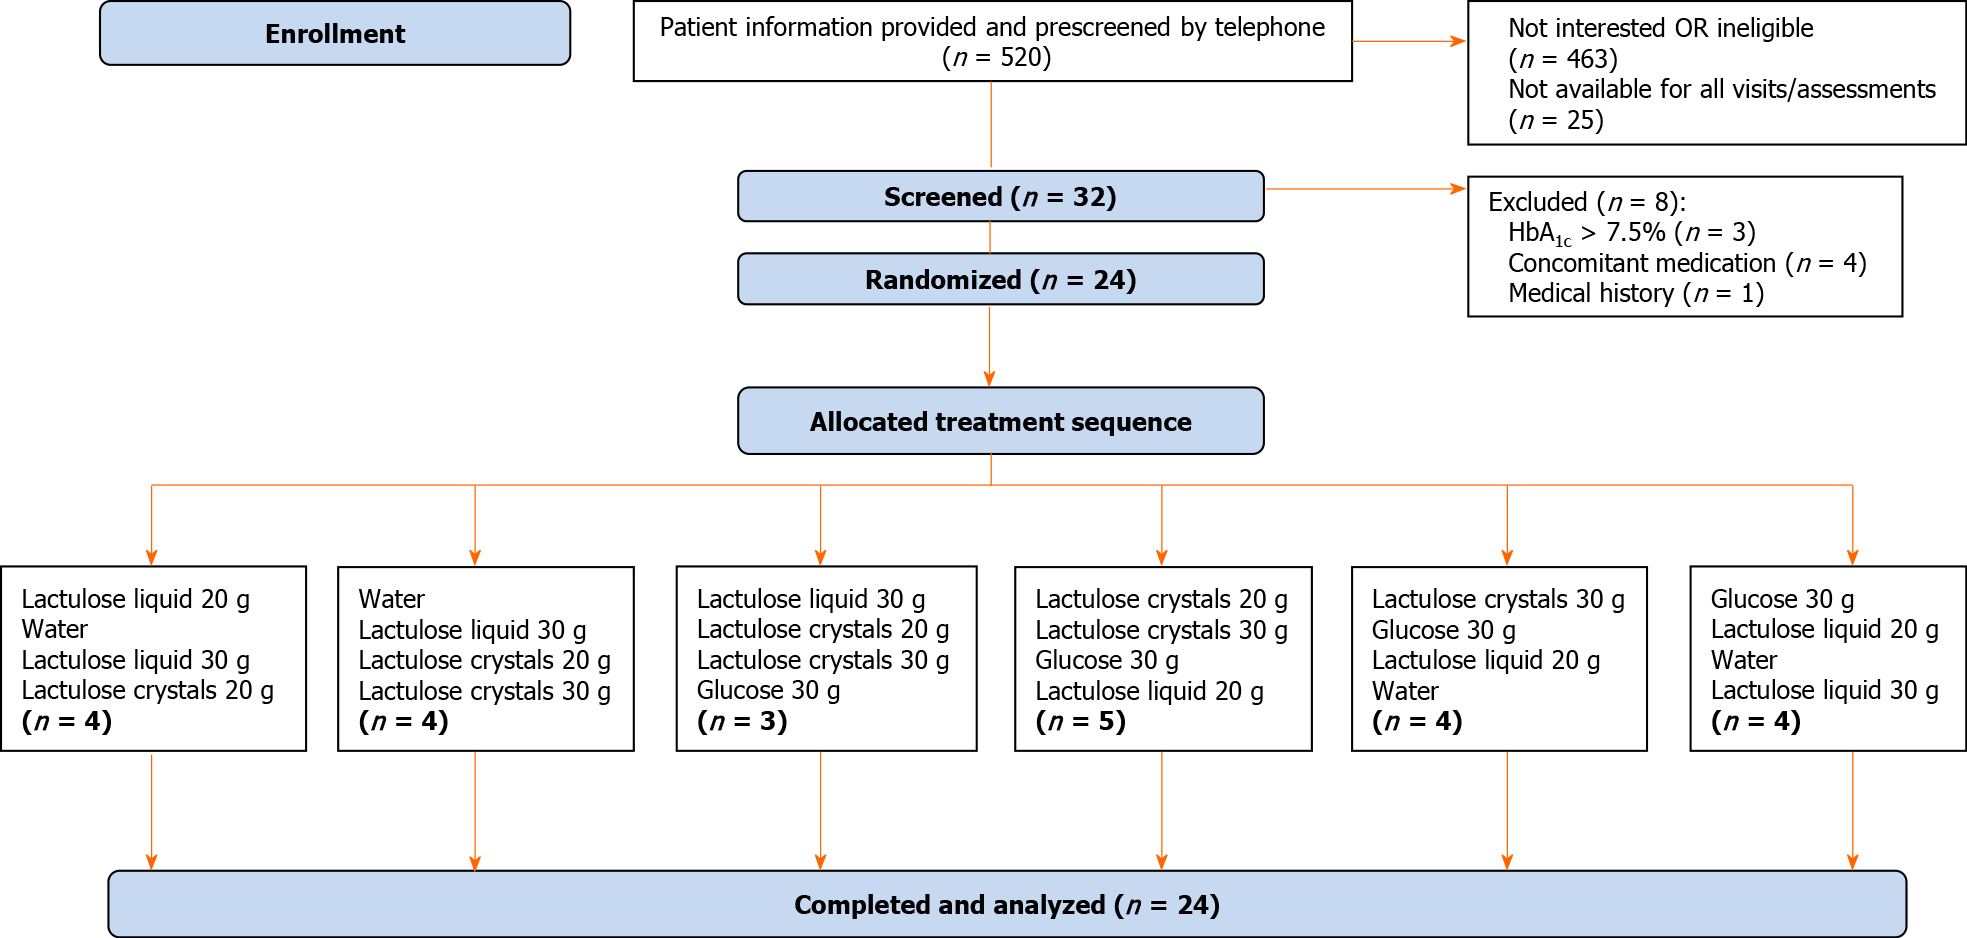
Figure 1 Flow chart of trial subjects.
The main reasons for pre-screening failure included: Not interested (n = 85), missing signs of functional constipation (n = 220), insufficient blood glucose control (n = 24), not allowed concomitant medication, e.g., insulin (n = 58), body mass index ≥ 35 kg/m2 (n = 31) gastrointestinal or other relevant comorbidity (cancer, lactose intolerance etc.) (n = 39), smoking habit (n = 7). HbA1c: Glycosylated hemoglobin.
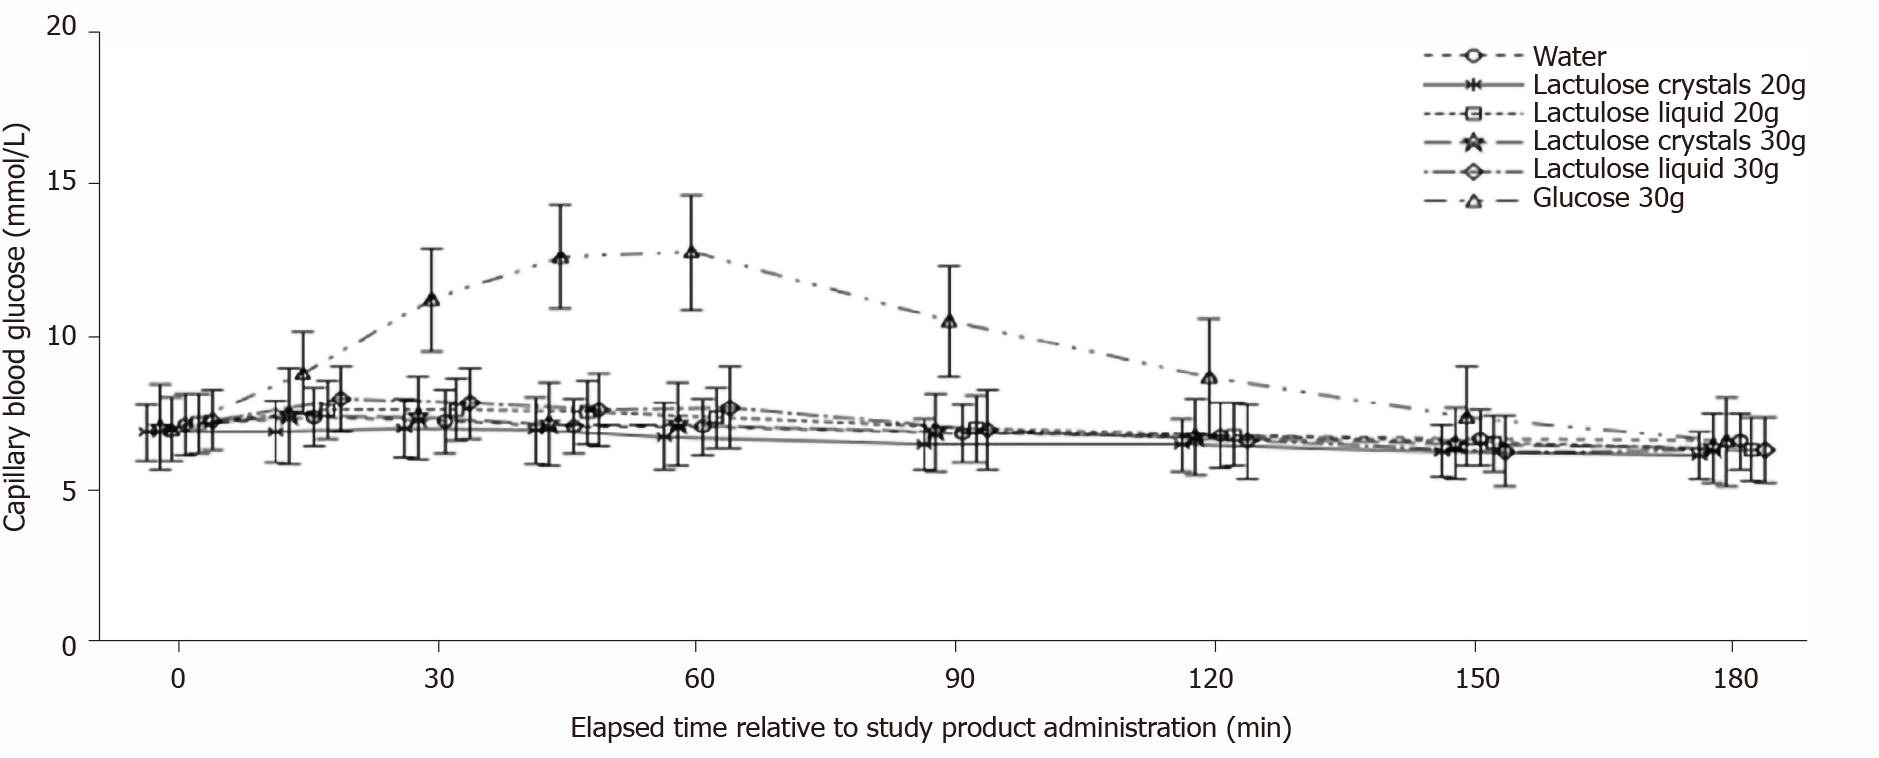
Figure 2 Blood glucose concentration-time curves.
Each line represents mean ± SD. n = 16 each for water, 20 g crystal lactulose, 30 g crystal lactulose, and 30 g glucose, n = 17 for 20 g liquid lactulose, n = 15 for 30 g liquid lactulose.
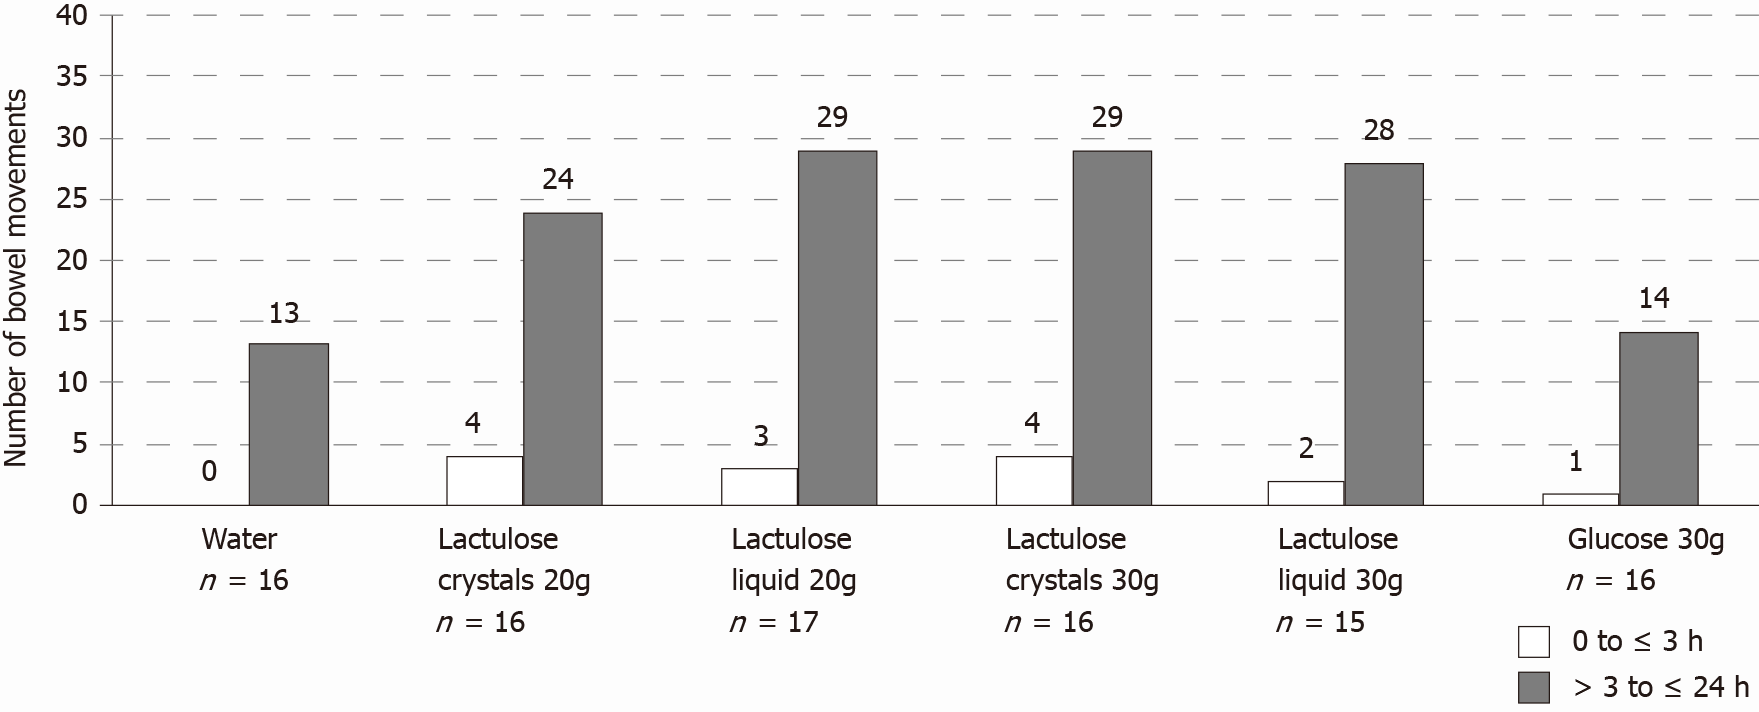
Figure 3
Cumulative numbers of bowel movements per treatment and time after oral intake of water, glucose, or lactulose for all subjects.
- Citation: Pieber TR, Svehlikova E, Mursic I, Esterl T, Wargenau M, Sartorius T, Pauly L, Schwejda-Guettes S, Neumann A, Faerber V, Stover JF, Gaigg B, Kuchinka-Koch A. Blood glucose response after oral lactulose intake in type 2 diabetic individuals. World J Diabetes 2021; 12(6): 893-907
- URL: https://www.wjgnet.com/1948-9358/full/v12/i6/893.htm
- DOI: https://dx.doi.org/10.4239/wjd.v12.i6.893


