Copyright
©The Author(s) 2021.
World J Diabetes. Feb 15, 2021; 12(2): 124-137
Published online Feb 15, 2021. doi: 10.4239/wjd.v12.i2.124
Published online Feb 15, 2021. doi: 10.4239/wjd.v12.i2.124
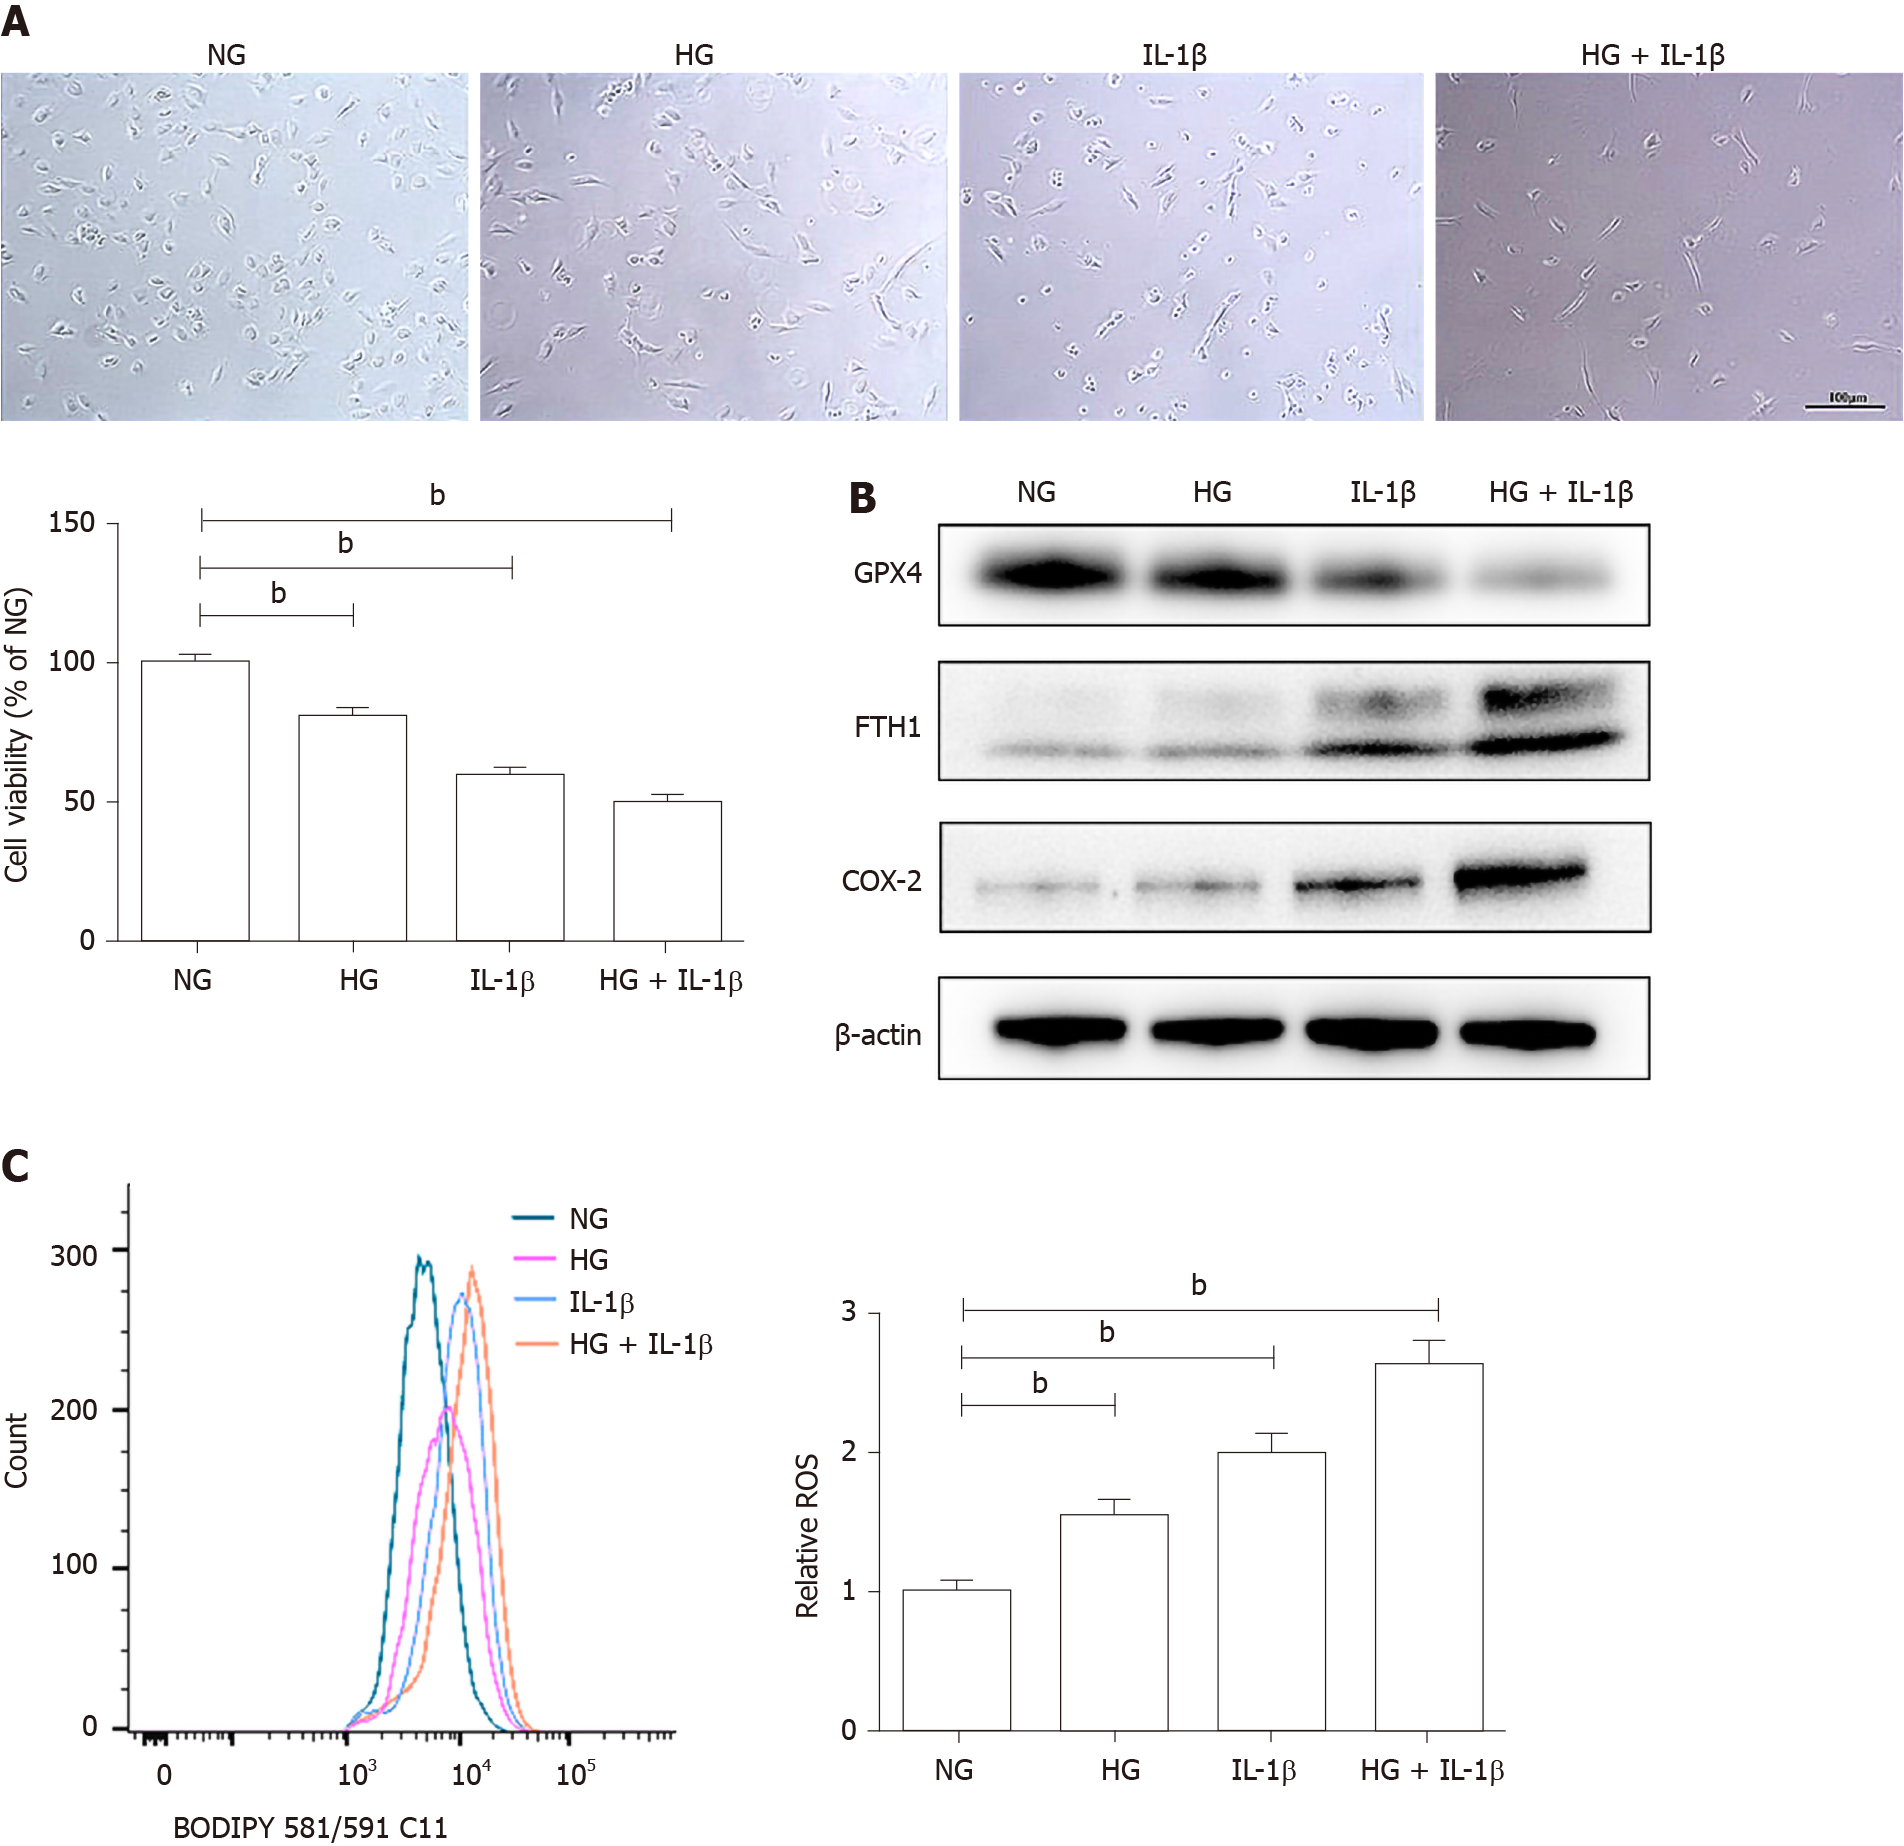
Figure 1 Effects of high glucose and interleukin-1β on ferroptosis in human umbilical vein endothelial cells.
A: Human umbilical vein endothelial cells were treated with normal glucose (5 mmol/L) or high glucose (30 mmol/L) and interleukin-1β (10 ng/mL). After treatment for 48 h, representative phase-contrast microscopy images of human umbilical vein endothelial cells were obtained and cell viability was determined using Cell Counting Kit-8. Scale bar: 100 μm; B: The protein levels of glutathione peroxidase 4, FTH1, and cyclooxygenase-2 were determined using Western blot assays. β-actin was used for normalization; C: The generation of reactive oxygen species was determined by the BODIPY™ 581/591 C11. To maintain constant isotonicity or osmolality, normal glucose (5 mmol/L) medium was supplemented with D-mannitol (25 mmol/L, final concentration) in the current study. aP < 0.05 vs the control group. bP < 0.01 vs the control group.
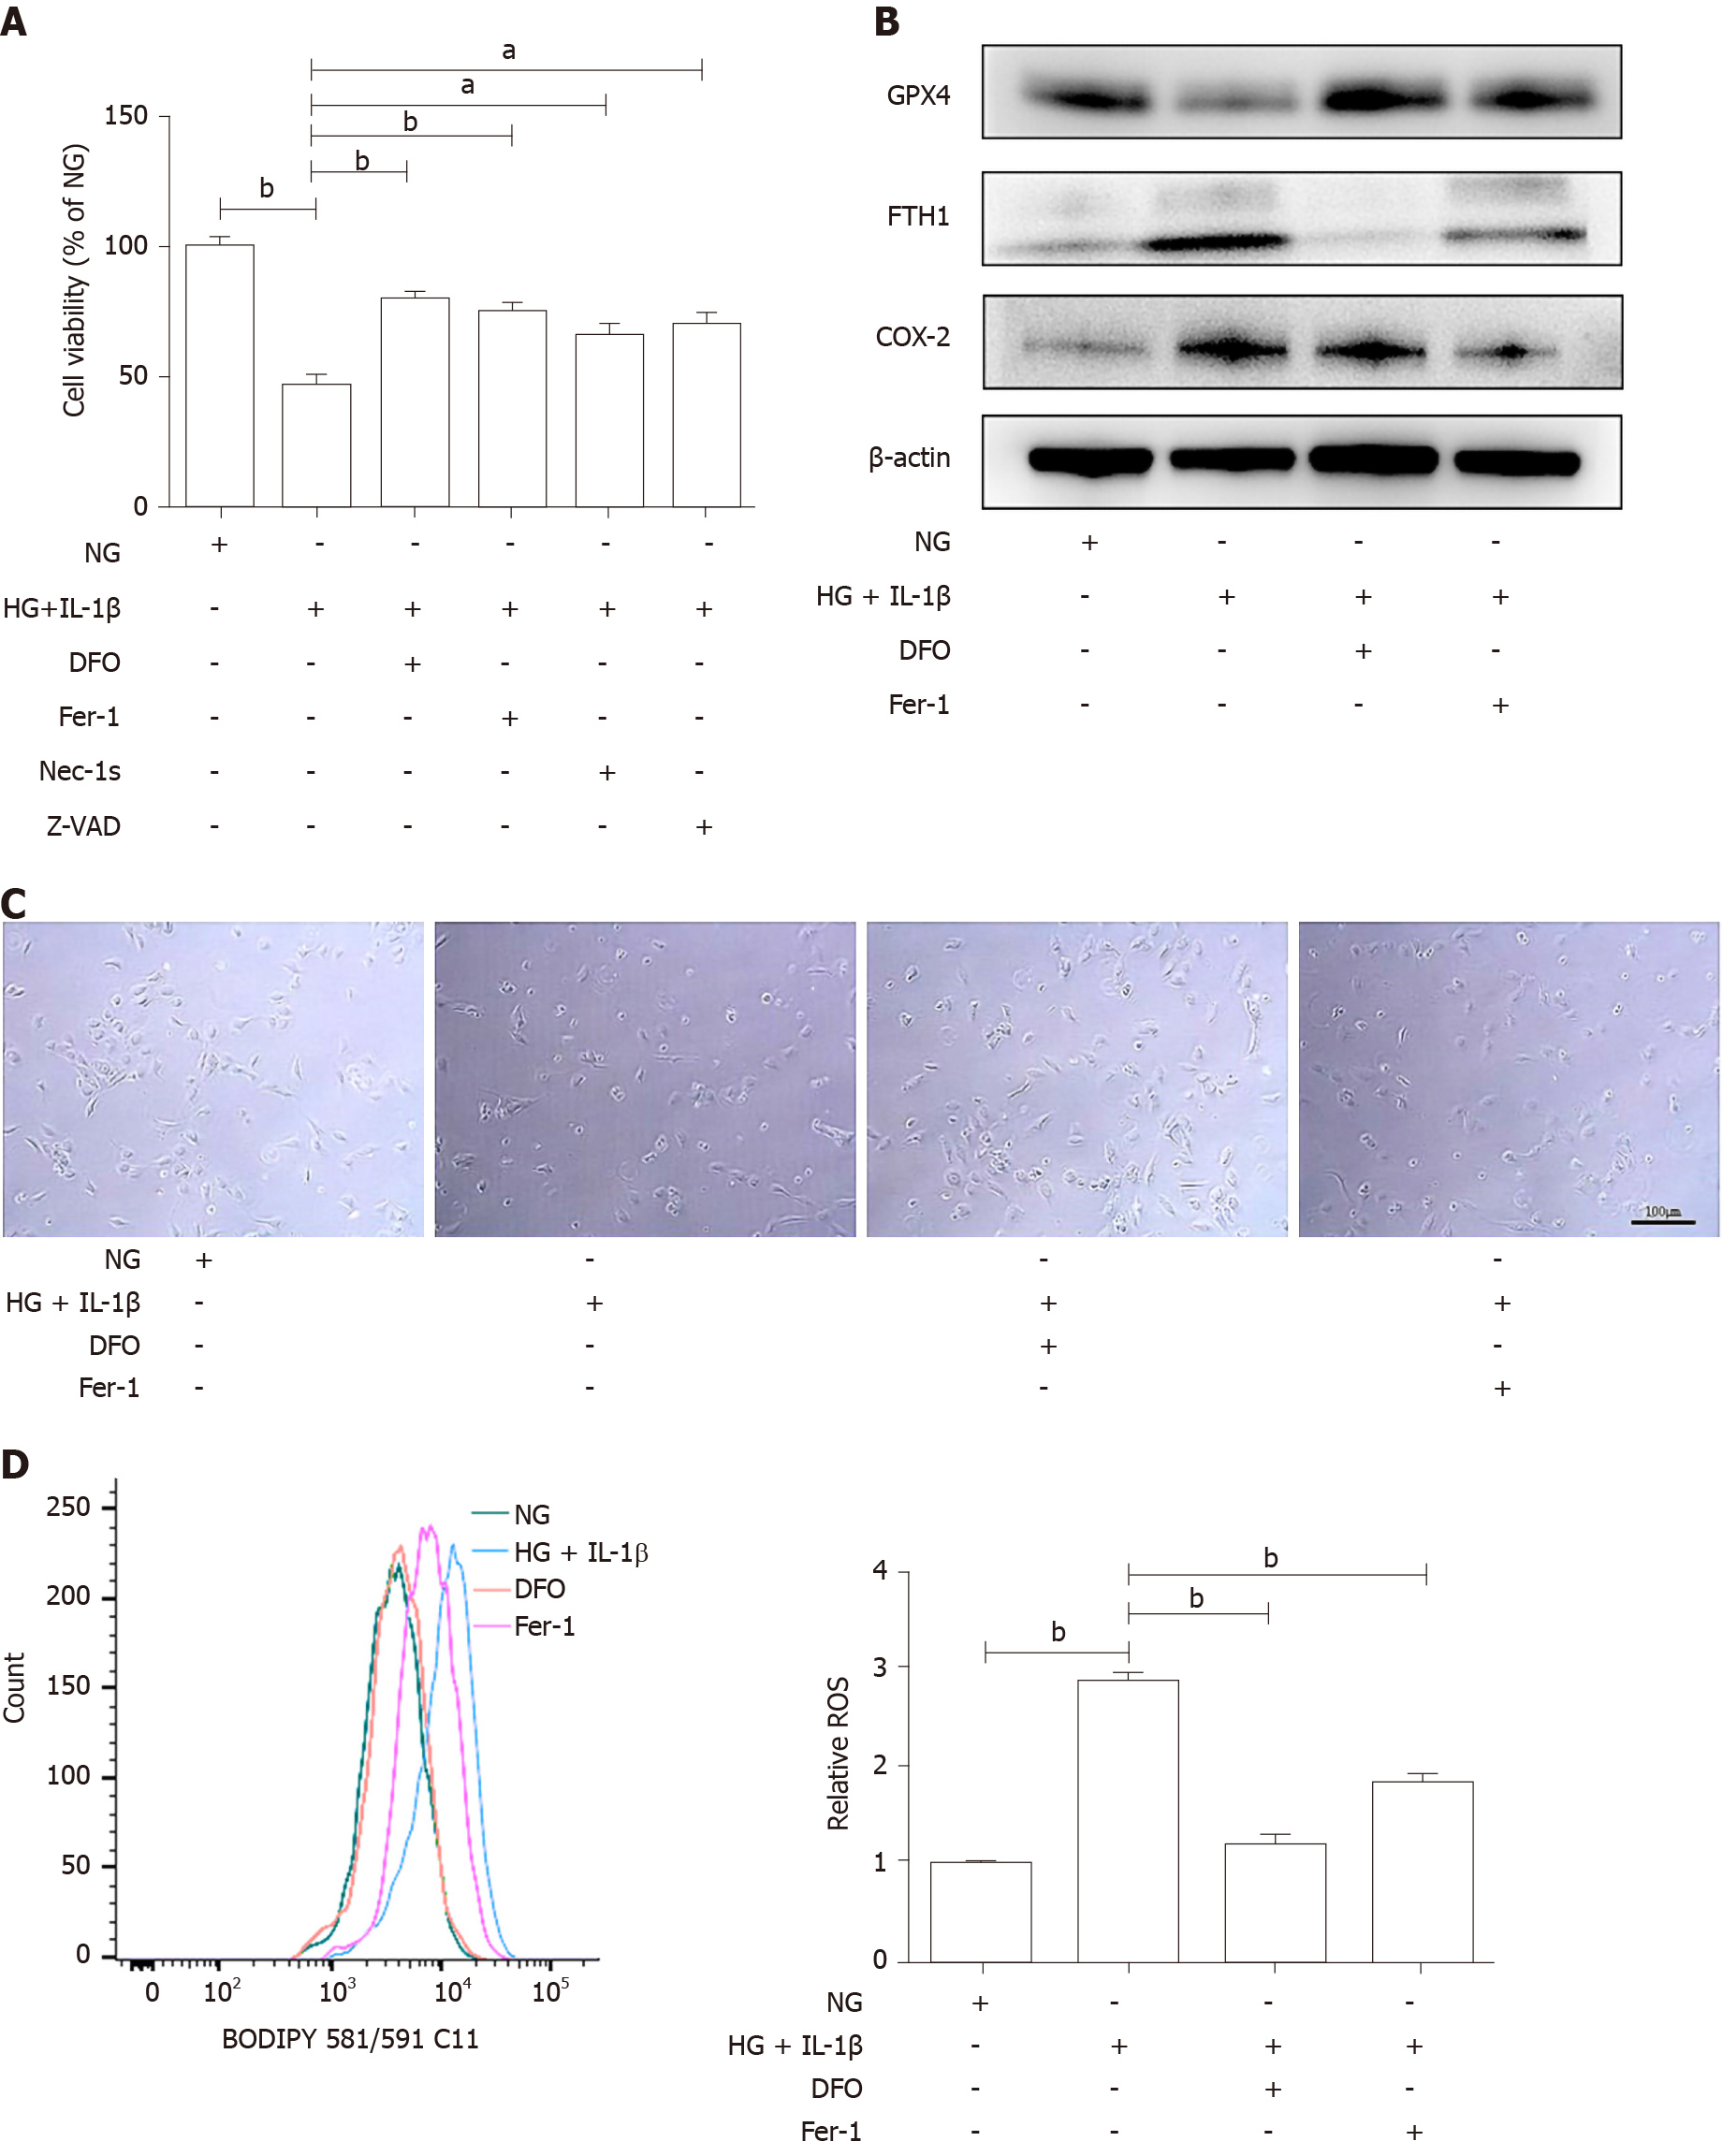
Figure 2 Ferroptosis inhibitor attenuates the ferroptosis of human umbilical vein endothelial cells induced by high glucose and interleukin-1β.
A: Human umbilical vein endothelial cells (HUVECs) were treated with NG, high glucose (30 mmol/L) and interleukin-1β (10 ng/mL), the ferroptosis inhibitor, Deferoxamine (100 μmol/L) or Ferrostatin-1 (10 μmol/L), the necroptosis inhibitor necrostatin-1s (2 μmol/L), and the apoptosis inhibitor Z-VAD-FMK (Z-VAD, 5 μmol/L). After treatment for 48 h, cell viability was determined using Cell Counting Kit-8; B: HUVECs were treated with NG, high glucose (30 mmol/L) and interleukin-1β (10 ng/mL), Deferoxamine (100 μmol/L), and ferrostatin-1 (10 μmol/L), after treatment for 48 h, representative phase-contrast microscopy images of HUVECs were obtained. Scale bar: 100 μm; C: The protein levels of glutathione peroxidase 4, FTH1, and cyclooxygenase-2 were determined using Western blot assays. β-actin was used for normalization; and D: The generation of reactive oxygen species was determined by the BODIPY™ 581/591 C11. aP < 0.05 vs the control group. bP < 0.01 vs the control group.
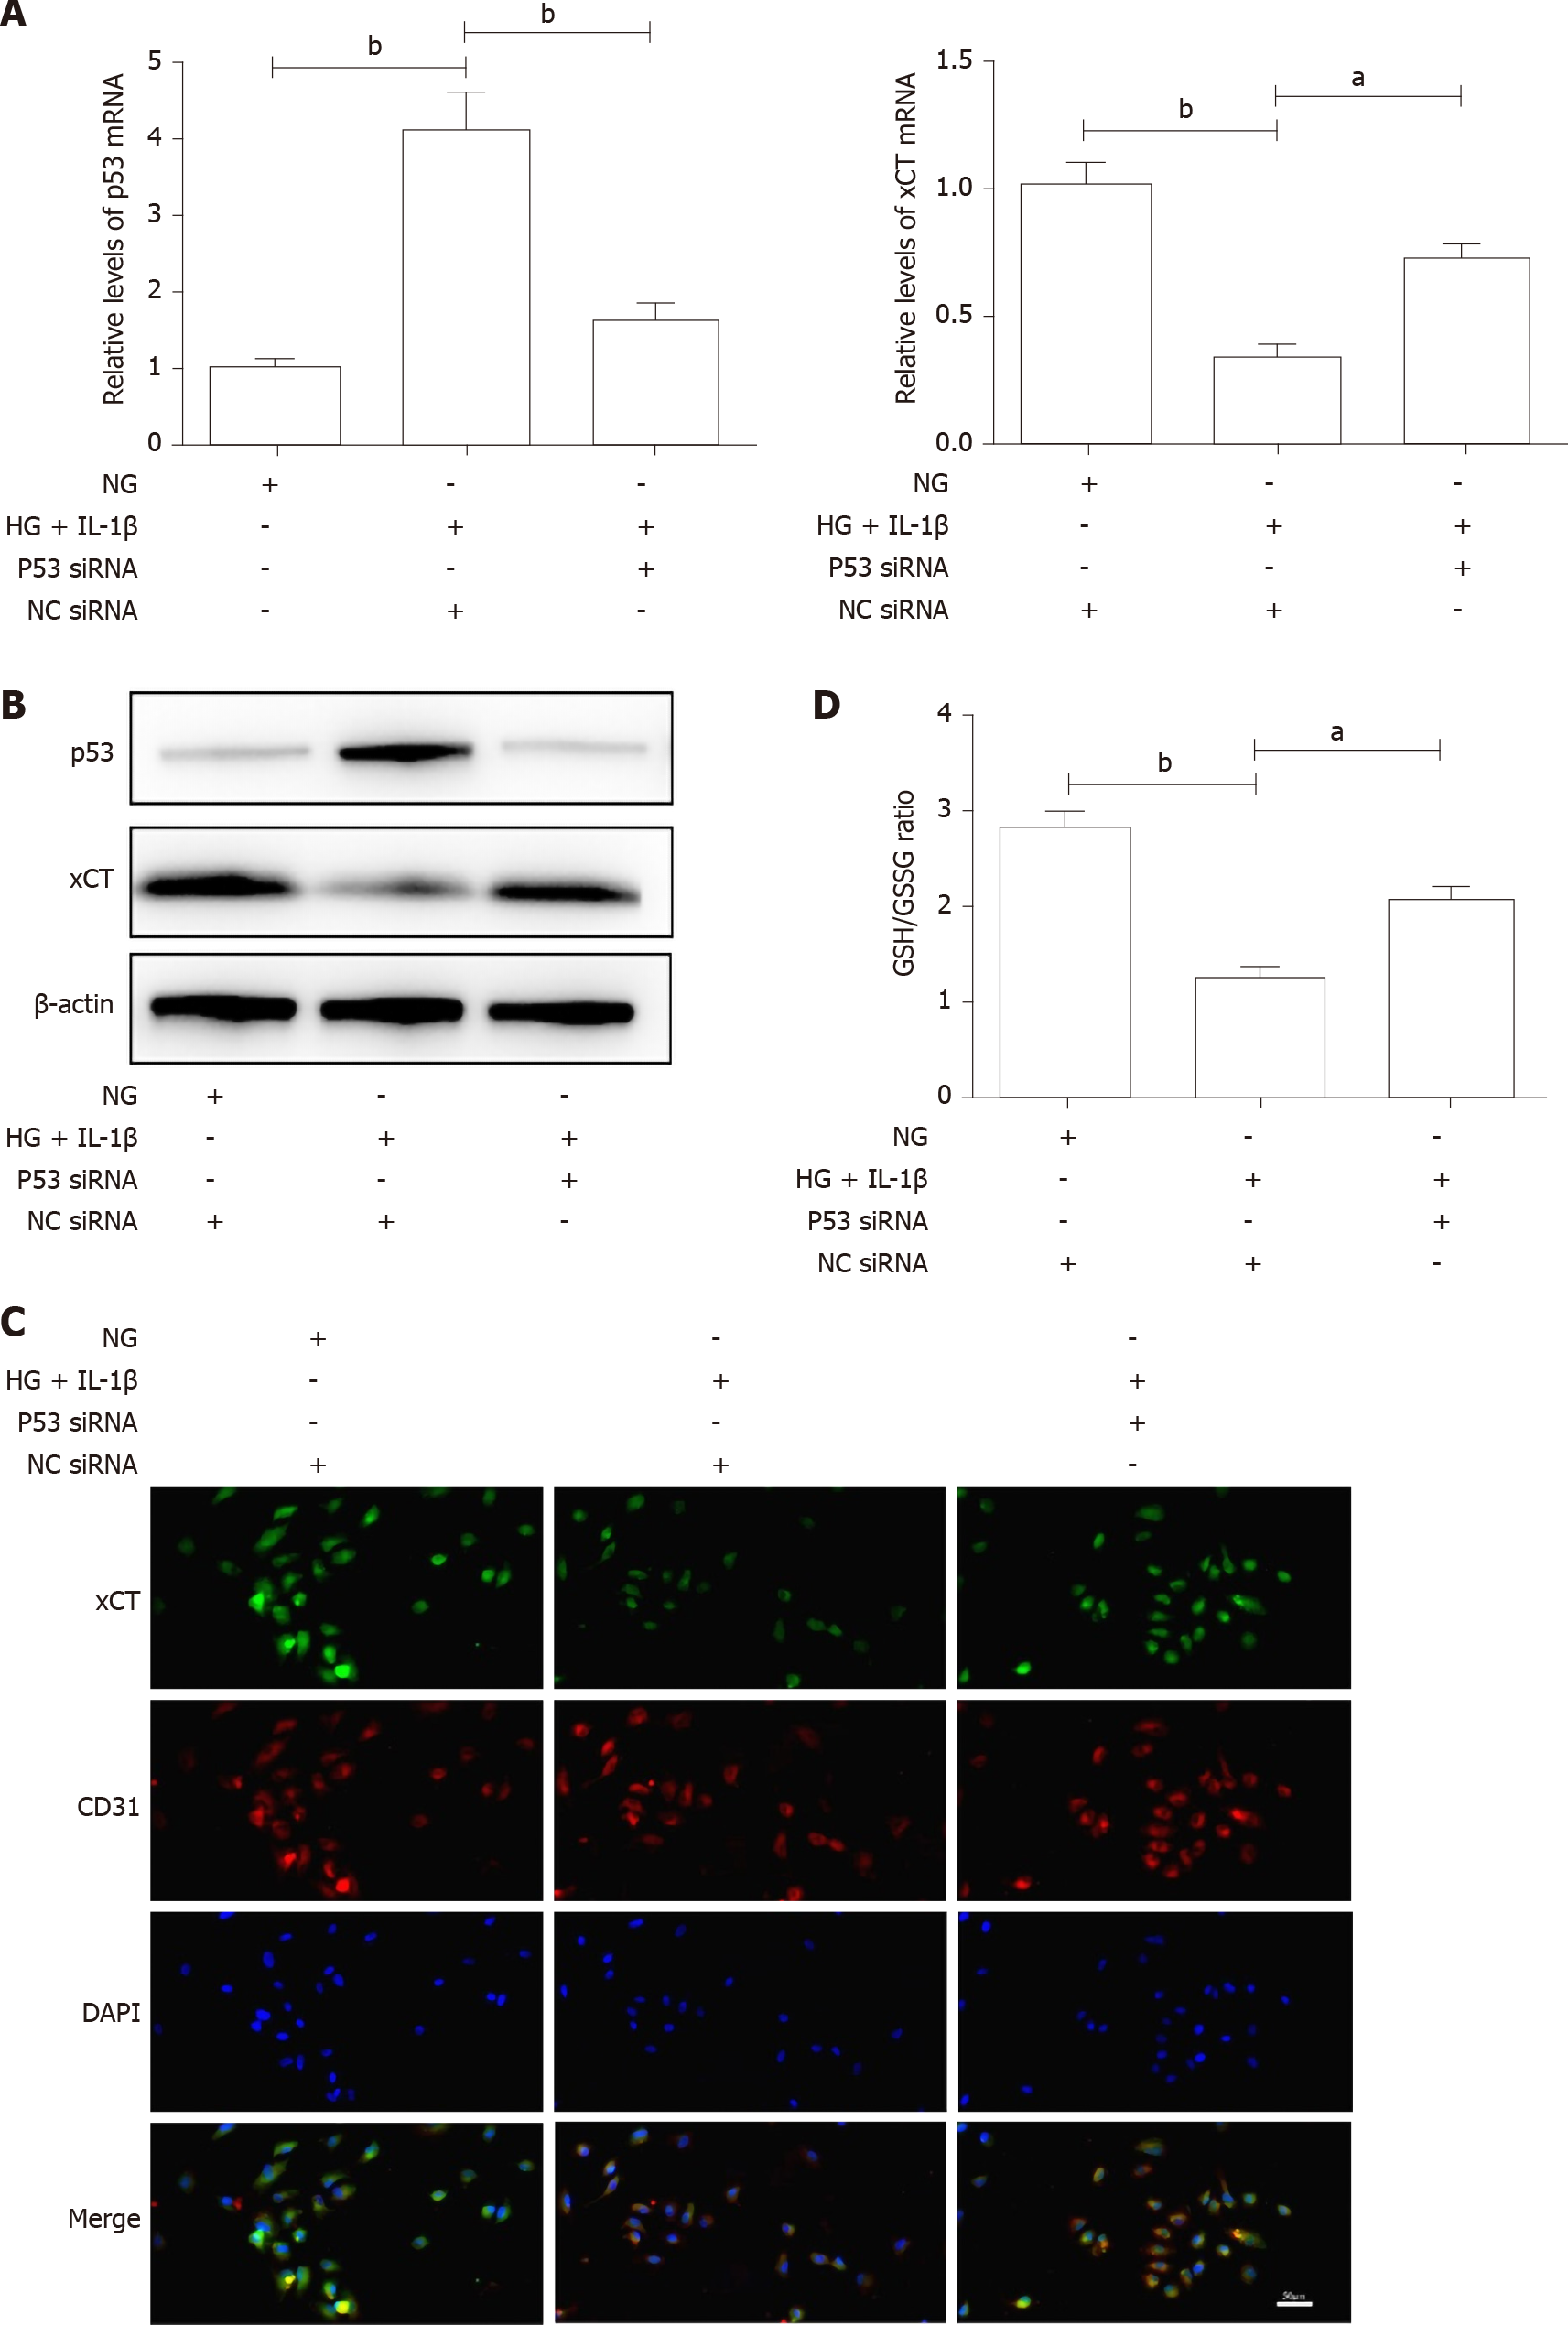
Figure 3 High glucose and interleukin-1β activate the p53-xCT (the substrate-specific subunit of system Xc-)-glutathione axis in human umbilical vein endothelial cells.
A: Human umbilical vein endothelial cells were transiently transfected with p53 small interfering ribonucleic acid or NC small interfering ribonucleic acid and then treated with NG, high glucose (30 mmol/L) and interleukin-1β (10 ng/mL). After treatment for 48 h, the messenger ribonucleic acid levels of p53 and xCT in human umbilical vein endothelial cells with different treatments were determined using real-time polymerase chain reaction analyses. β-actin was used for normalization; B: The protein levels of p53 and xCT were determined using Western blot assays. β-actin was used for normalization; C: The localization of xCT was detected by immunofluorescence. xCT is labeled green, and CD31 is labeled red. The nucleus is labeled blue. Scale bar: 50 μm; and D: The intracellular glutathione/oxidized glutathione (glutathione/oxidized glutathione) ratio was measured with the glutathione and oxidized glutathione assay Kit. aP < 0.05 vs the control group. bP < 0.01 vs the control group.
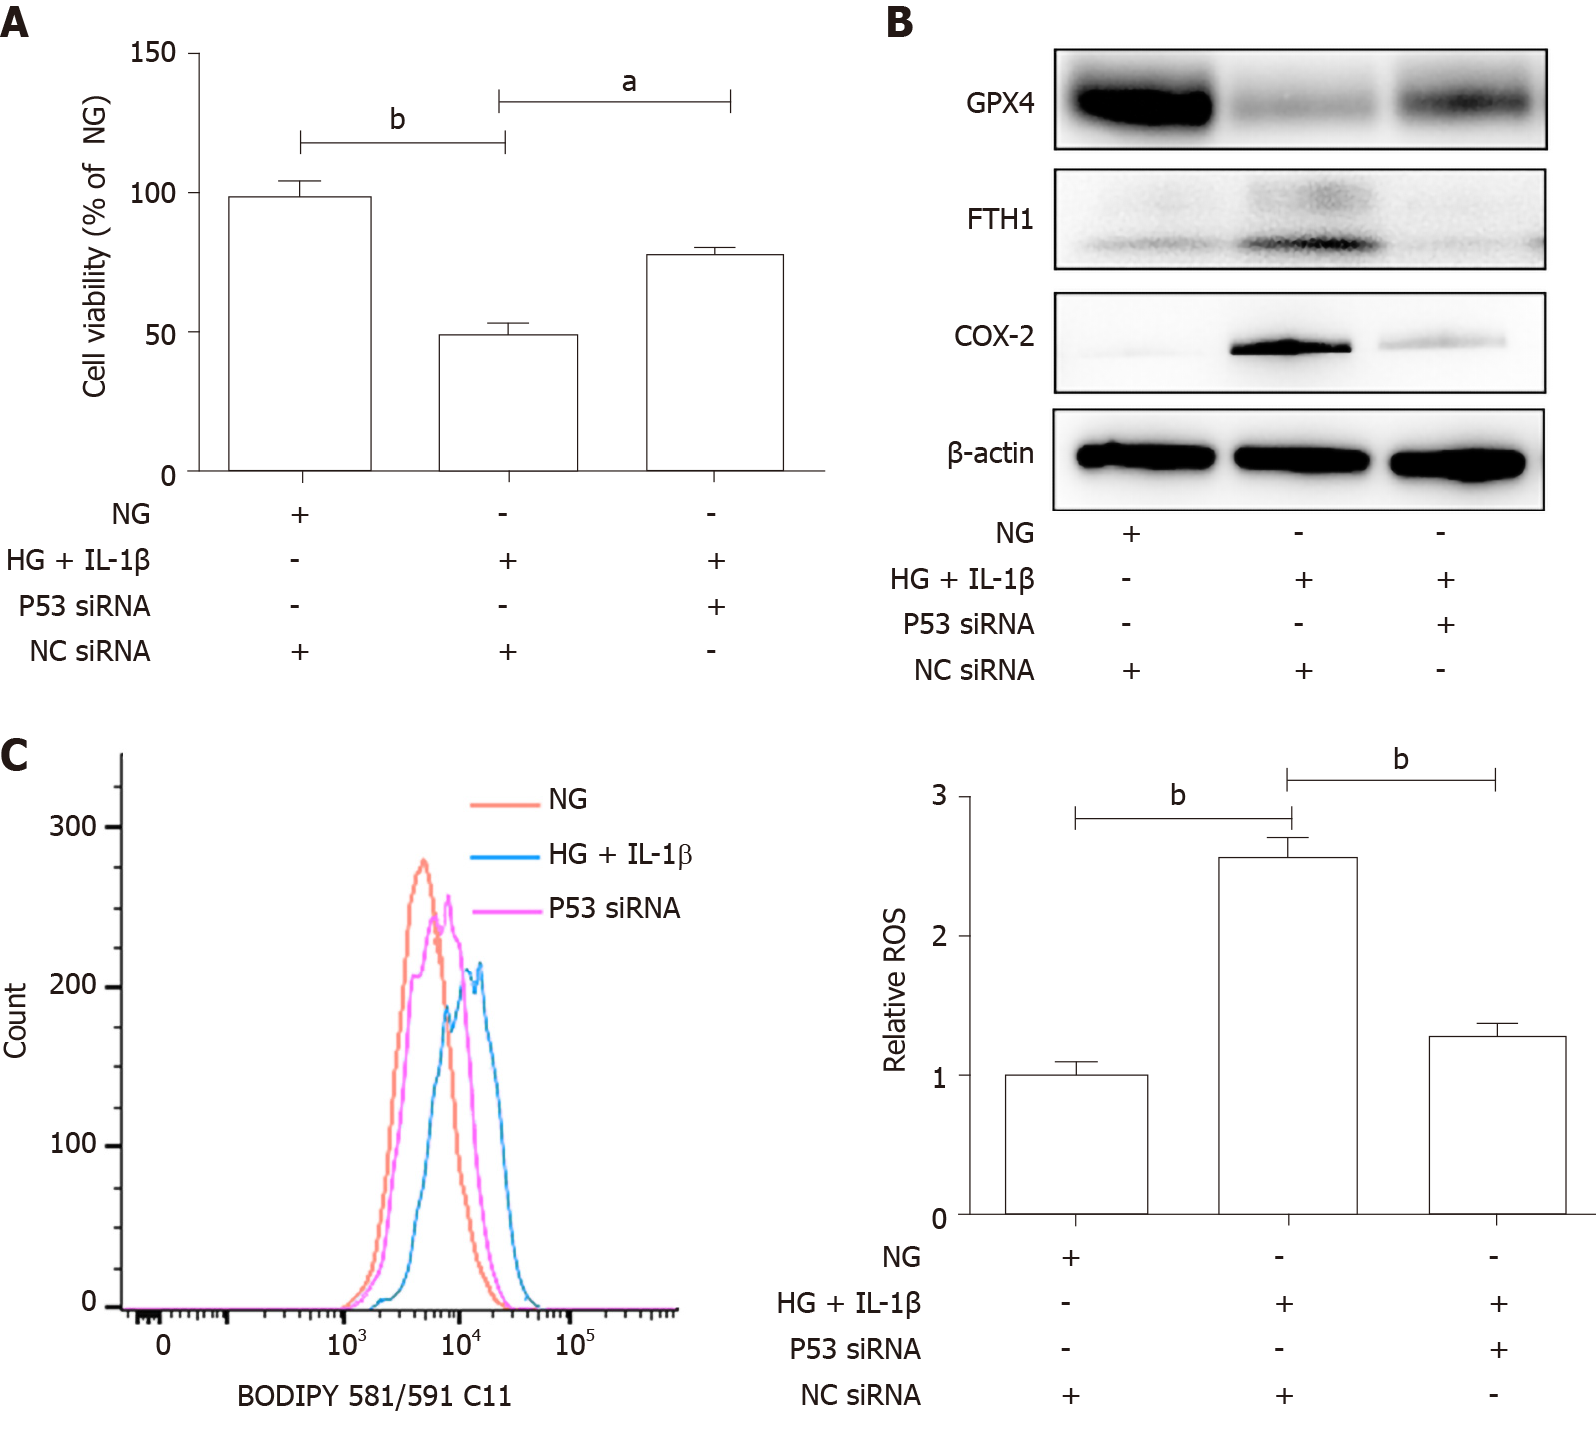
Figure 4 The p53-xCT (the substrate-specific subunit of system Xc-)-glutathione axis functions as a pivotal master in high glucose and interleukin-1β-induced ferroptosis in human umbilical vein endothelial cells.
A: Human umbilical vein endothelial cells were transiently transfected with p53 small interfering ribonucleic acid or NC small interfering ribonucleic acid and then treated with NG, high glucose (30 mmol/L) and interleukin-1β (10 ng/mL). After treatment for 48 h, representative phase-contrast microscopy images of human umbilical vein endothelial cells were obtained and cell viability was determined using Cell Counting Kit-8; B: The protein levels of glutathione peroxidase 4, FTH1, and cyclooxygenase-2 were determined using Western blot assays. β-actin was used for normalization; and C: The generation of reactive oxygen species was determined by the BODIPY™ 581/591 C11. aP < 0.05 vs the control group. bP < 0.01 vs the control group.
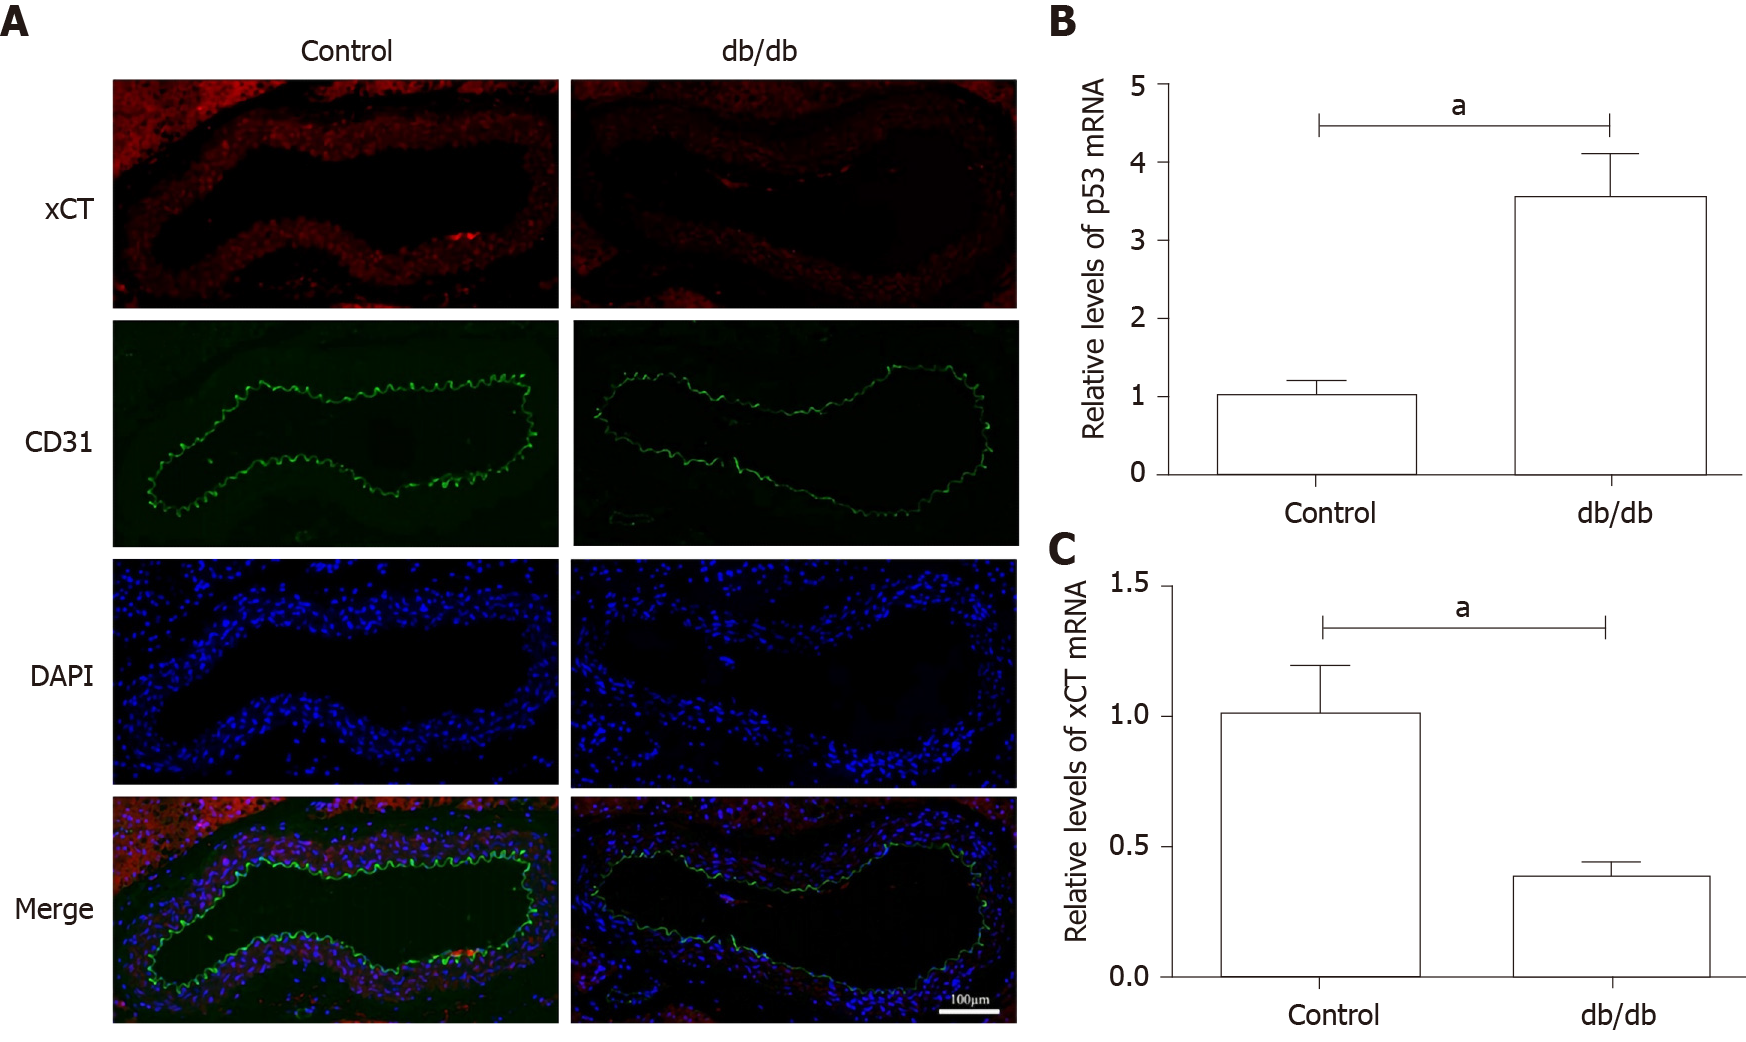
Figure 5 Detection of xCT (the substrate-specific subunit of system Xc-) and p53 expression in the aorta of db/db mice.
A: The localization of xCT was detected by immunofluorescence. xCT is labeled red, and CD31 is labeled green. The nucleus is labeled blue. Scale bar: 100 μm; B and C: The messenger ribonucleic acid levels of p53 and xCT in mice aorta were determined using real-time polymerase chain reaction analyses. β-actin was used for normalization. aP < 0.05 vs the control group. bP < 0.01 vs the control group.
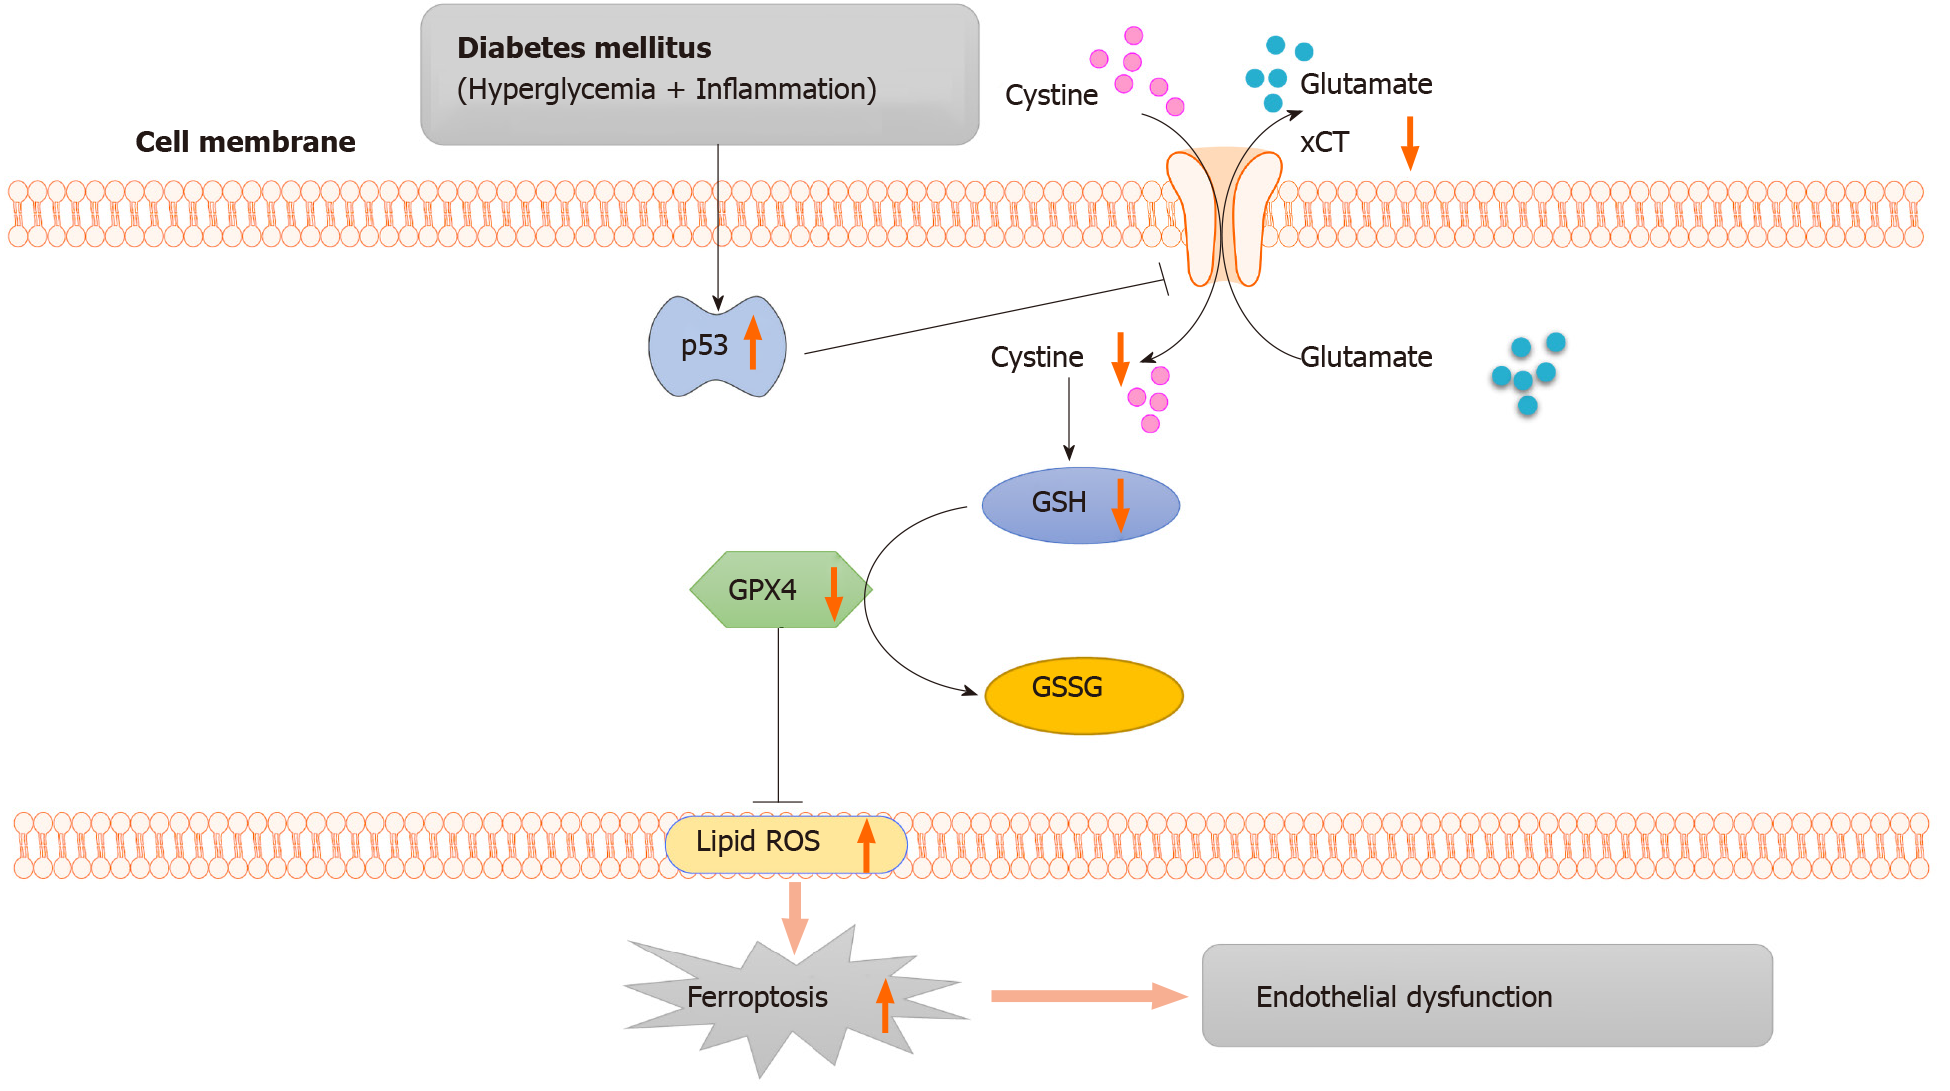
Figure 6 Working model: activation of the p53-xCT (the substrate-specific subunit of system Xc-)-glutathione axis and ferroptosis play a vital role in diabetes-induced endothelial dysfunction.
In diabetes, p53 signaling is activated, and p53 can transcriptionally suppress xCT, in endothelial cells. The downregulation of xCT inhibits cystine uptake and reduces glutathione synthesis, which is involved in triggering ferroptosis in endothelial cells and ultimately leads to endothelial dysfunction. GSH: Glutathione; GSSG: Oxidized glutathione; GPX4: Glutathione peroxidase 4; ROS: Reactive oxygen species; ECs: Endothelial cells.
- Citation: Luo EF, Li HX, Qin YH, Qiao Y, Yan GL, Yao YY, Li LQ, Hou JT, Tang CC, Wang D. Role of ferroptosis in the process of diabetes-induced endothelial dysfunction. World J Diabetes 2021; 12(2): 124-137
- URL: https://www.wjgnet.com/1948-9358/full/v12/i2/124.htm
- DOI: https://dx.doi.org/10.4239/wjd.v12.i2.124


