Copyright
©The Author(s) 2021.
World J Diabetes. Jan 15, 2021; 12(1): 19-46
Published online Jan 15, 2021. doi: 10.4239/wjd.v12.i1.19
Published online Jan 15, 2021. doi: 10.4239/wjd.v12.i1.19
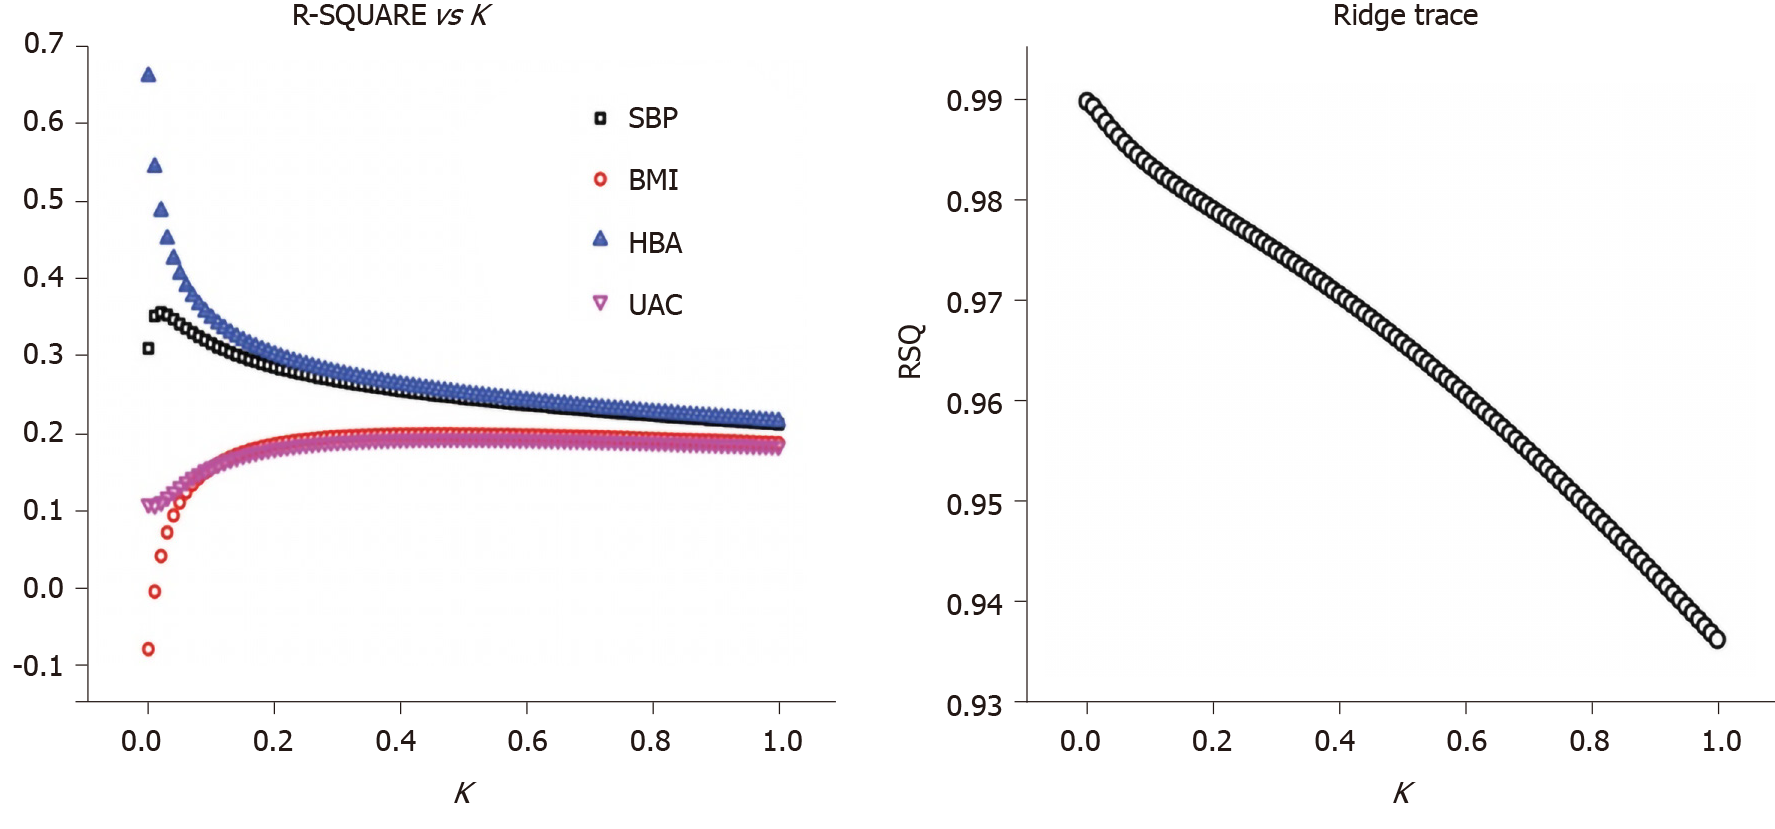
Figure 1 Relationship between the determination coefficient (R2) and K value, as shown by the ridge regression analysis.
RSQ: R-SQUARE; SBP: Systolic blood pressure; BMI: Body mass index; HBA: Glycosylated hemoglobin; UAC: Urinary albumin creatinine ratio.
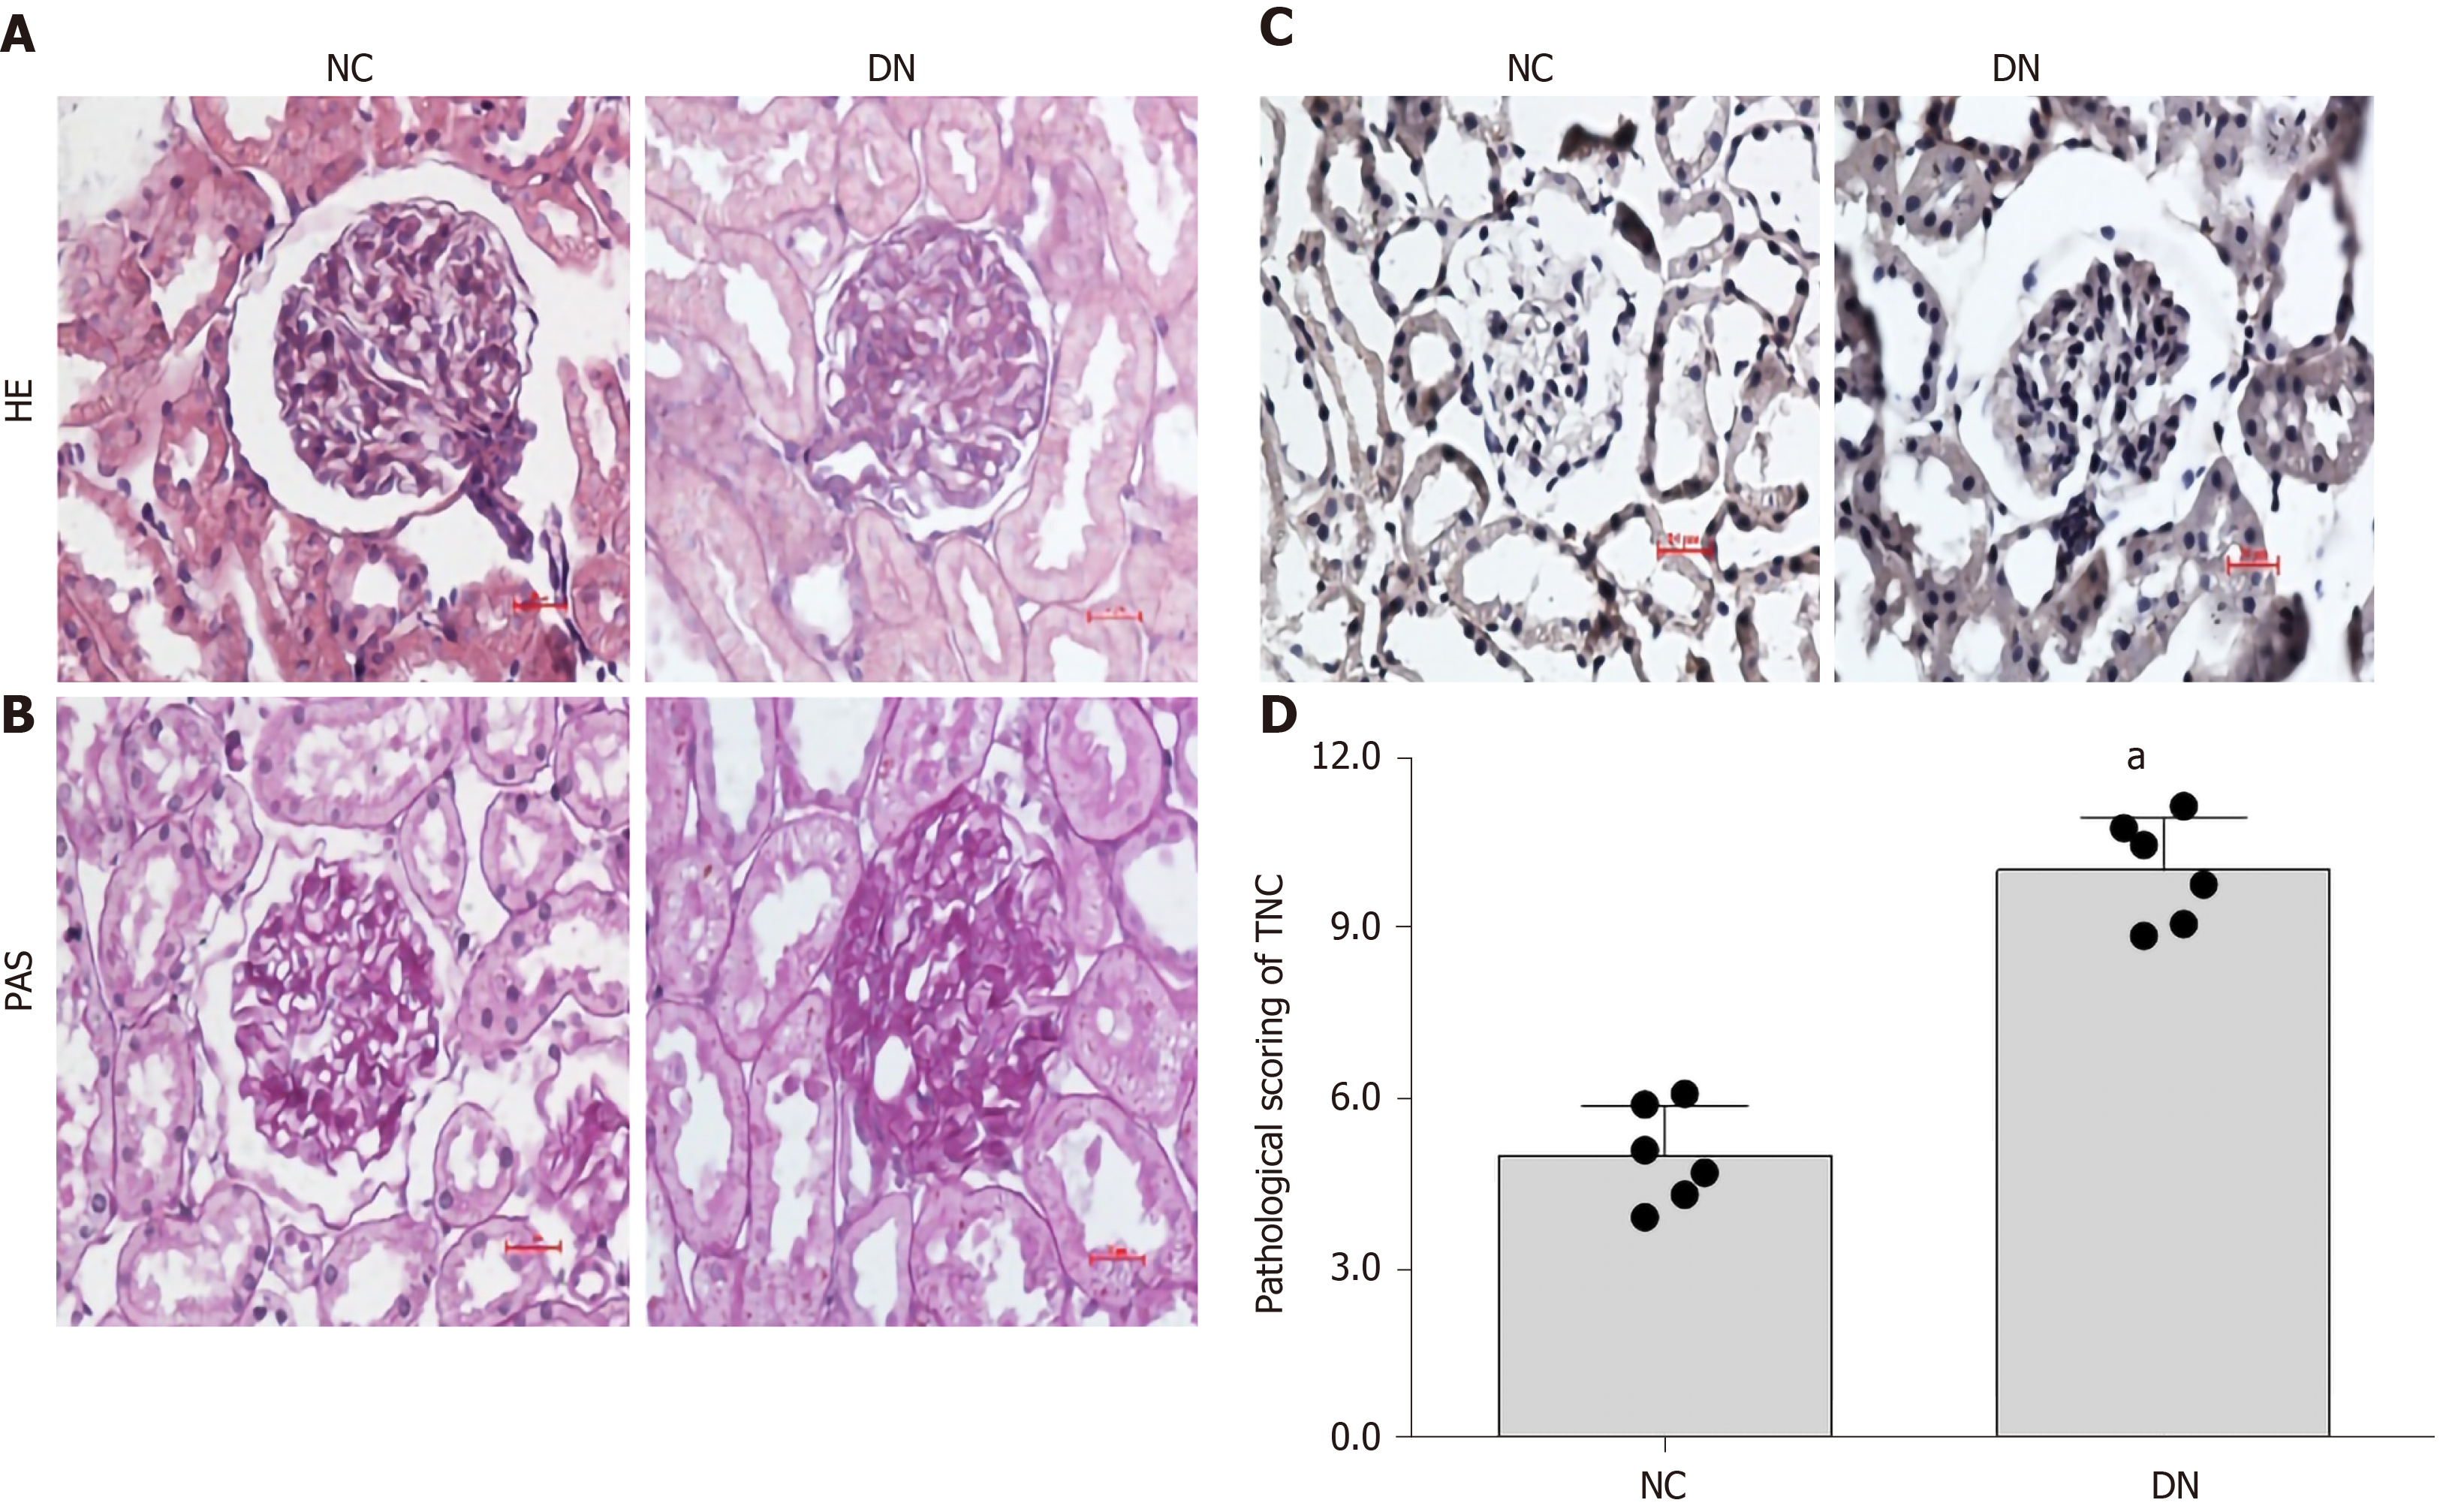
Figure 2 Histological changes and tenascin-C expression in the kidneys of diabetic rats.
A: Hematoxylin-eosin staining; B: Periodic acid-Schiff staining (400 ×); C: Immunohistochemical staining; D: Pathological scoring of tenascin-C (TNC). Scale bar: 20 μm. Representative immunohistochemical images and immunohistochemical scores for TNC in renal section are shown. aP < 0.05 compared with the NC control group. NC, n = 6, DN, n = 6. NC: Normal rat renal section; DN: Diabetic rat renal section; HE: Hematoxylin-eosin; PAS: Periodic acid-Schiff; TNC: Tenascin-C.
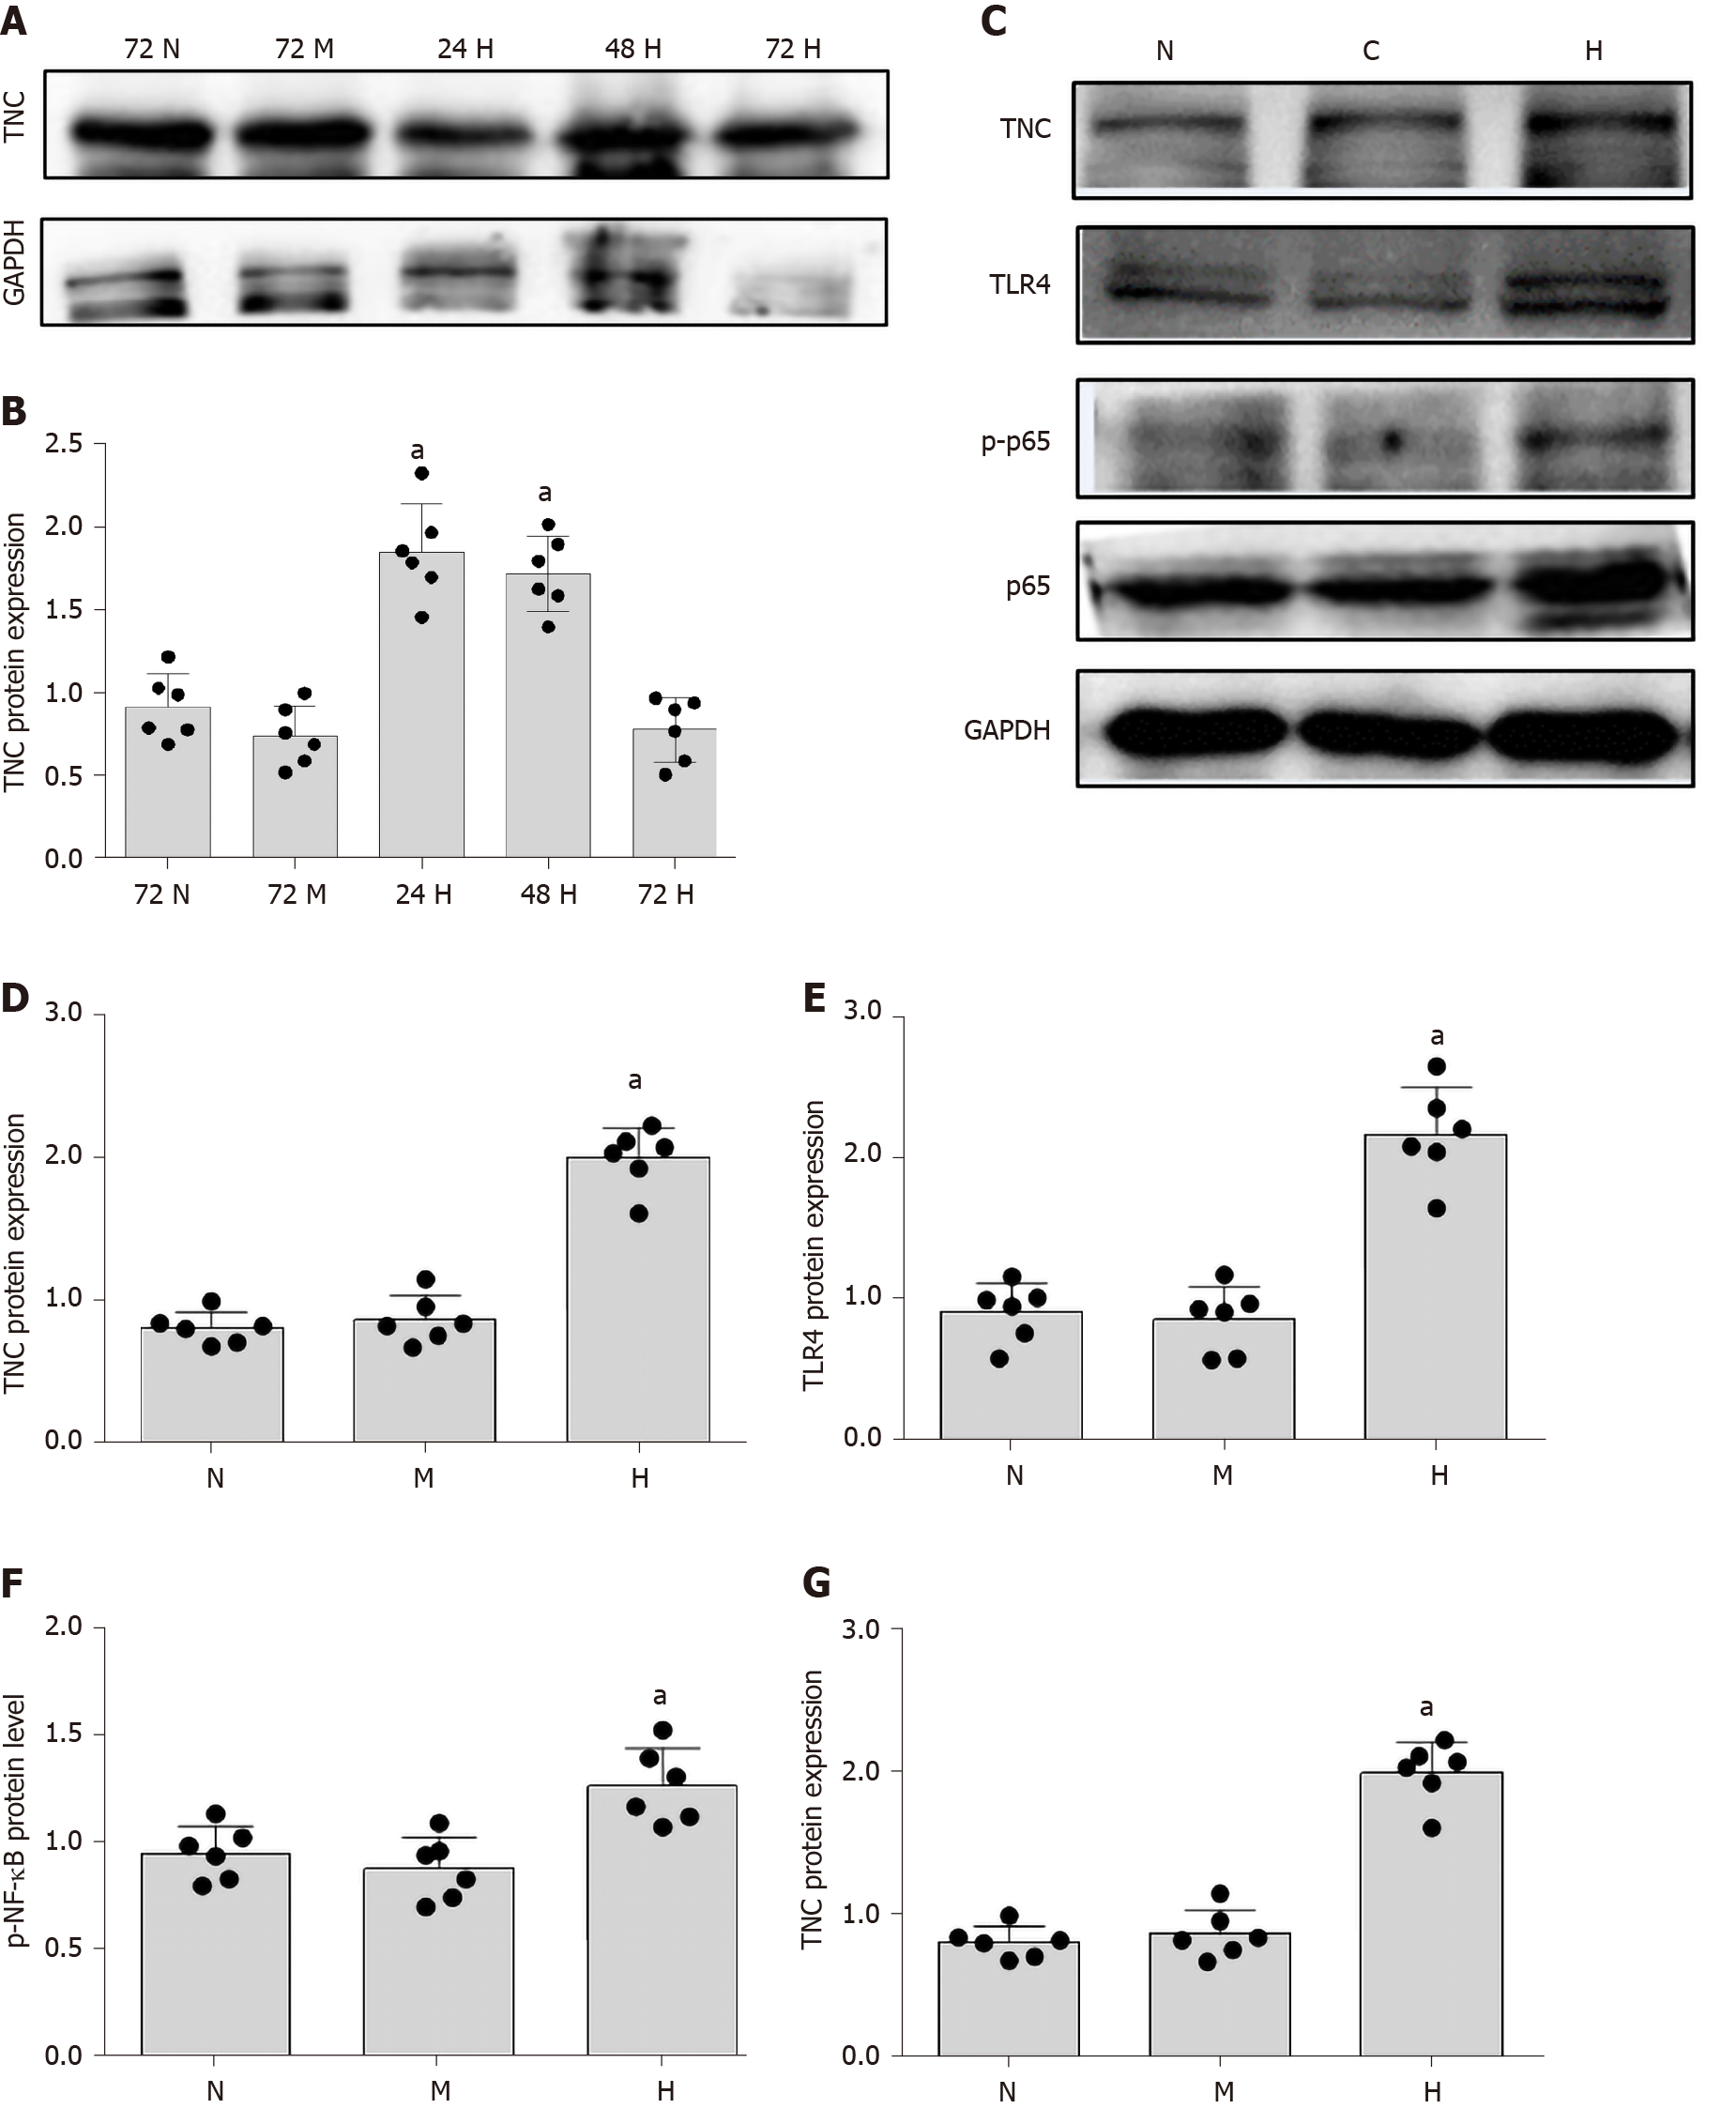
Figure 3 Changes in the levels of the tenascin-C and toll-like receptor-4 proteins and nuclear factor-κB p65 protein (Ser536) phosphorylation in cells stimulated with high glucose.
A and B: Protein bands and protein expression of tenascin-C (TNC). Rat mesangial cells (RMCs) were cultured under normal (NG, 5.5 mmol/L glucose) and hypertonic (HM, 5.5 mmol/L glucose + 24.5 mmol/L mannitol) conditions for 72 h, or high-glucose (HG, 30 mmol/L glucose) conditions for 24, 48, and 72 h. aP < 0.05 compared with the 72 h control group; C-G: Protein bands and protein expression of TNC, Toll-like receptor-4, and phosphorylated nuclear factor-κB p65 protein (Ser536). RMCs were cultured under normal (NG, 5.5 mmol/L glucose), hypertonic (HM, 5.5 mmol/L glucose + 24.5 mmol/L mannitol), and high-glucose (HG, 30 mmol/L glucose) conditions for 24 h. aP < 0.05 compared with the N control group. Protein levels were detected using Western blot. The results are presented as the mean ± SD of six independent experiments after normalization to GAPDH levels. TNC: Tenascin-C; TLR4: Toll-like receptor-4; p-NF-κB p65: Phosphorylated nuclear factor-κB p65 protein (Ser536); N: Normal glucose; M: Hypertonic; H: High-glucose.
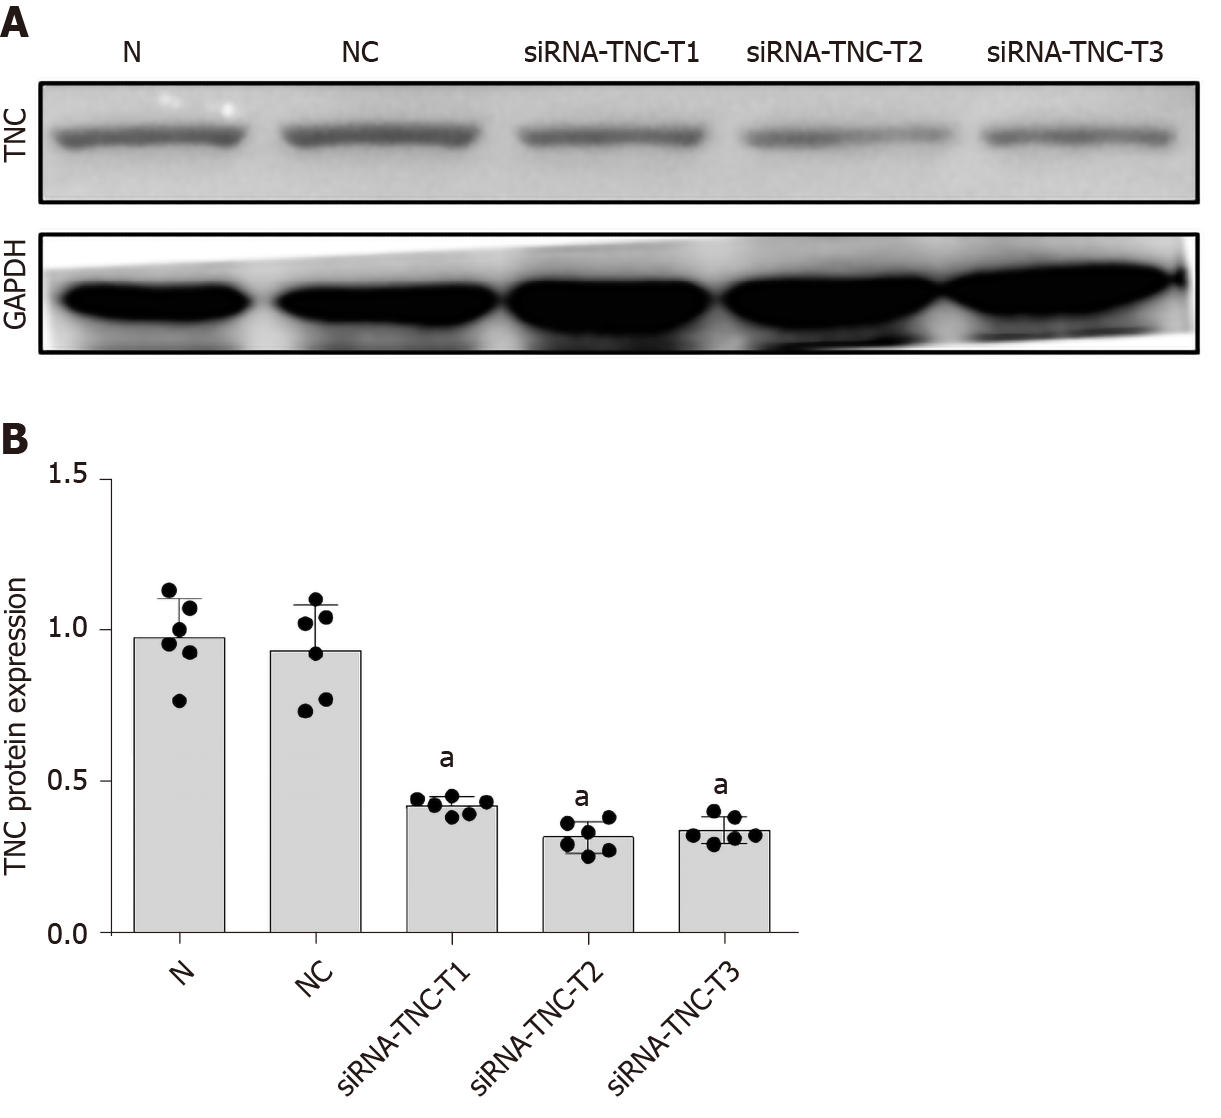
Figure 4 Screening siRNAs to silence the expression of tenascin-C protein.
A: Protein bands; B: Protein expression of tenascin-C (TNC). Rat mesangial cells (RMCs) were transfected with siRNA-TNC-T1, siRNA-TNC-T2, siRNA-TNC-T3, and siRNA-NC. RMCs were cultured in normal glucose (NG, 5.5 mmol/L glucose) medium for 24 h. aP < 0.05 compared with untransfected RMCs cultured with normal glucose concentrations. The level of the tenascin-C protein was detected using Western blot. The results are presented as the mean ± SD of six independent experiments after normalization to GAPDH levels. TNC: Tenascin-C; NC: Negative control; N: Normal glucose.
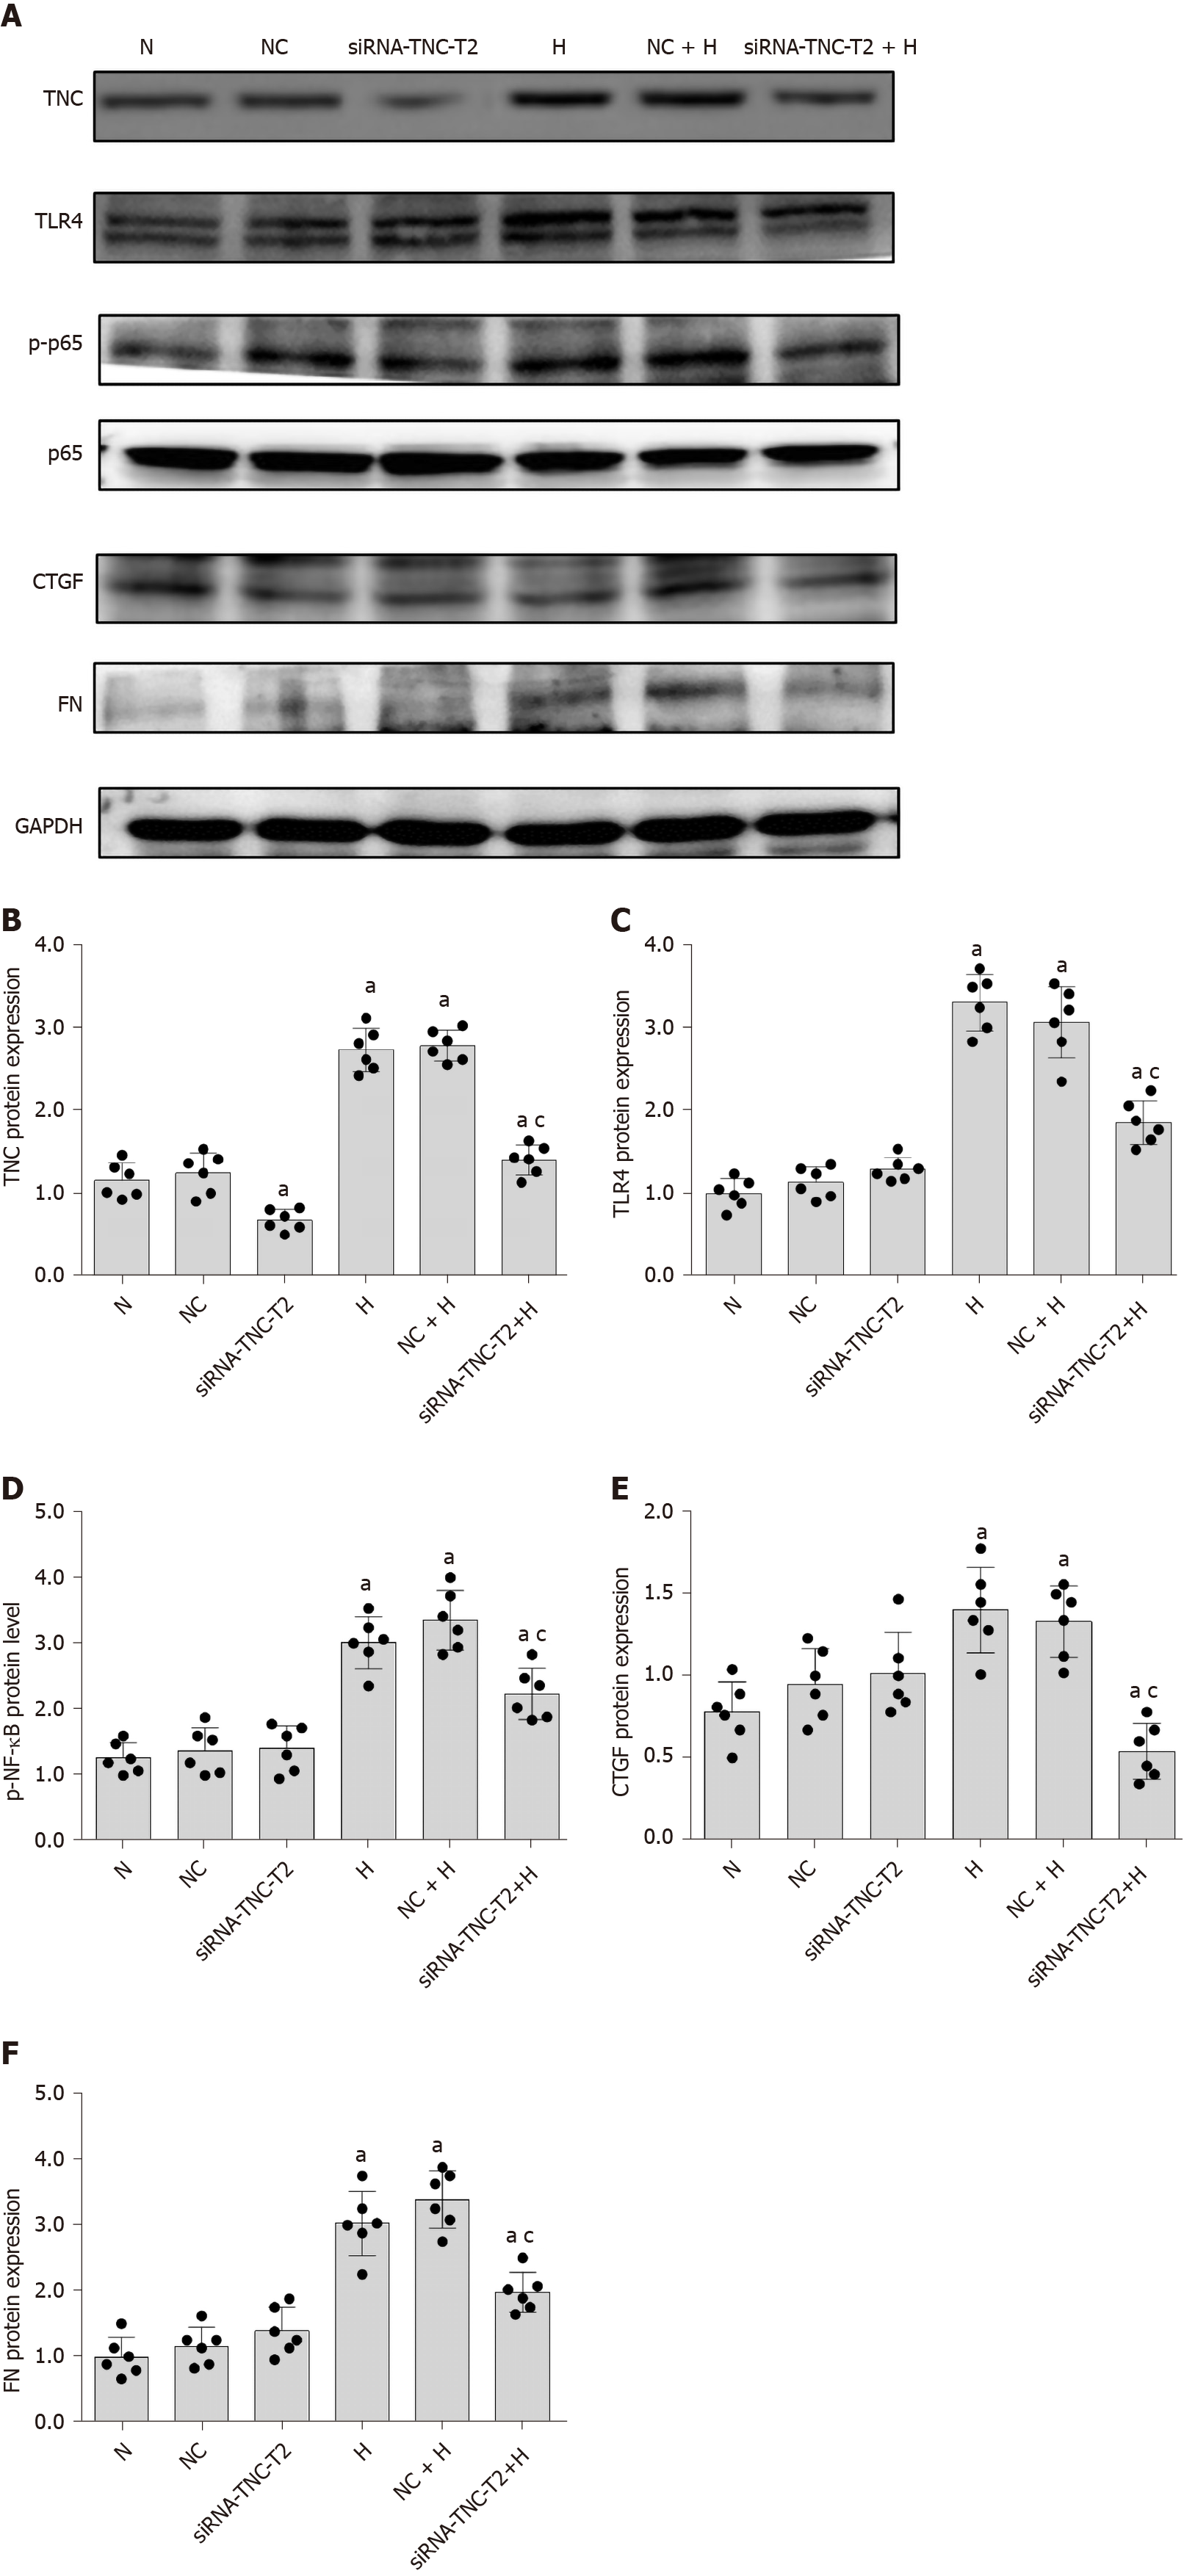
Figure 5 Silencing of tenascin-C protein expression inhibits the expression of Toll-like receptor-4 and fibrosis factors (connective tissue growth factor and fibronectin), as well as the phosphorylation of p65.
A: Protein bands; B-F: Protein expression of tenascin-C (TNC), Toll-like receptor-4 (TLR4), phosphorylated nuclear factor-κB p65 (Ser536) (p-NF-κB p65), connective tissue growth factor (CTGF), and fibronectin (FN). Rat mesangial cells (RMCs) were transfected with siRNA-TNC-T2 for 6 h, and the media were then replaced with normal-glucose (NG, 5.5 mmol/L glucose) or high-glucose (HG, 30 mmol/L glucose) medium for 24 h (N, 5.5 mmol/L glucose). RMCs were transfected with siRNA-TNC-T2 and siRNA-NC for 6 h, and the media were then replaced with normal-glucose (NG, 5.5 mmol/L glucose) or high-glucose (HG, 30 mmol/L glucose) medium for 24 h. aP < 0.05 compared with RMCs cultured with normal glucose concentrations; cP < 0.05 compared with RMCs cultured with high glucose concentrations. TNC, TLR4, p-NF-κB p65, NF-κB p65, CTGF, and FN levels were all detected using Western blot. The results are presented as the mean ± SD of six independent experiments after normalization to GAPDH levels. TNC: Tenascin-C; TLR4: Toll-like receptor-4; p-p65: Phosphorylated nuclear factor-κB p65 (Ser536); p65: Nuclear factor-κB p65; CTGF: Connective tissue growth factor; FN: Fibronectin; N: Normal control; NC: Negative control; H: High glucose.
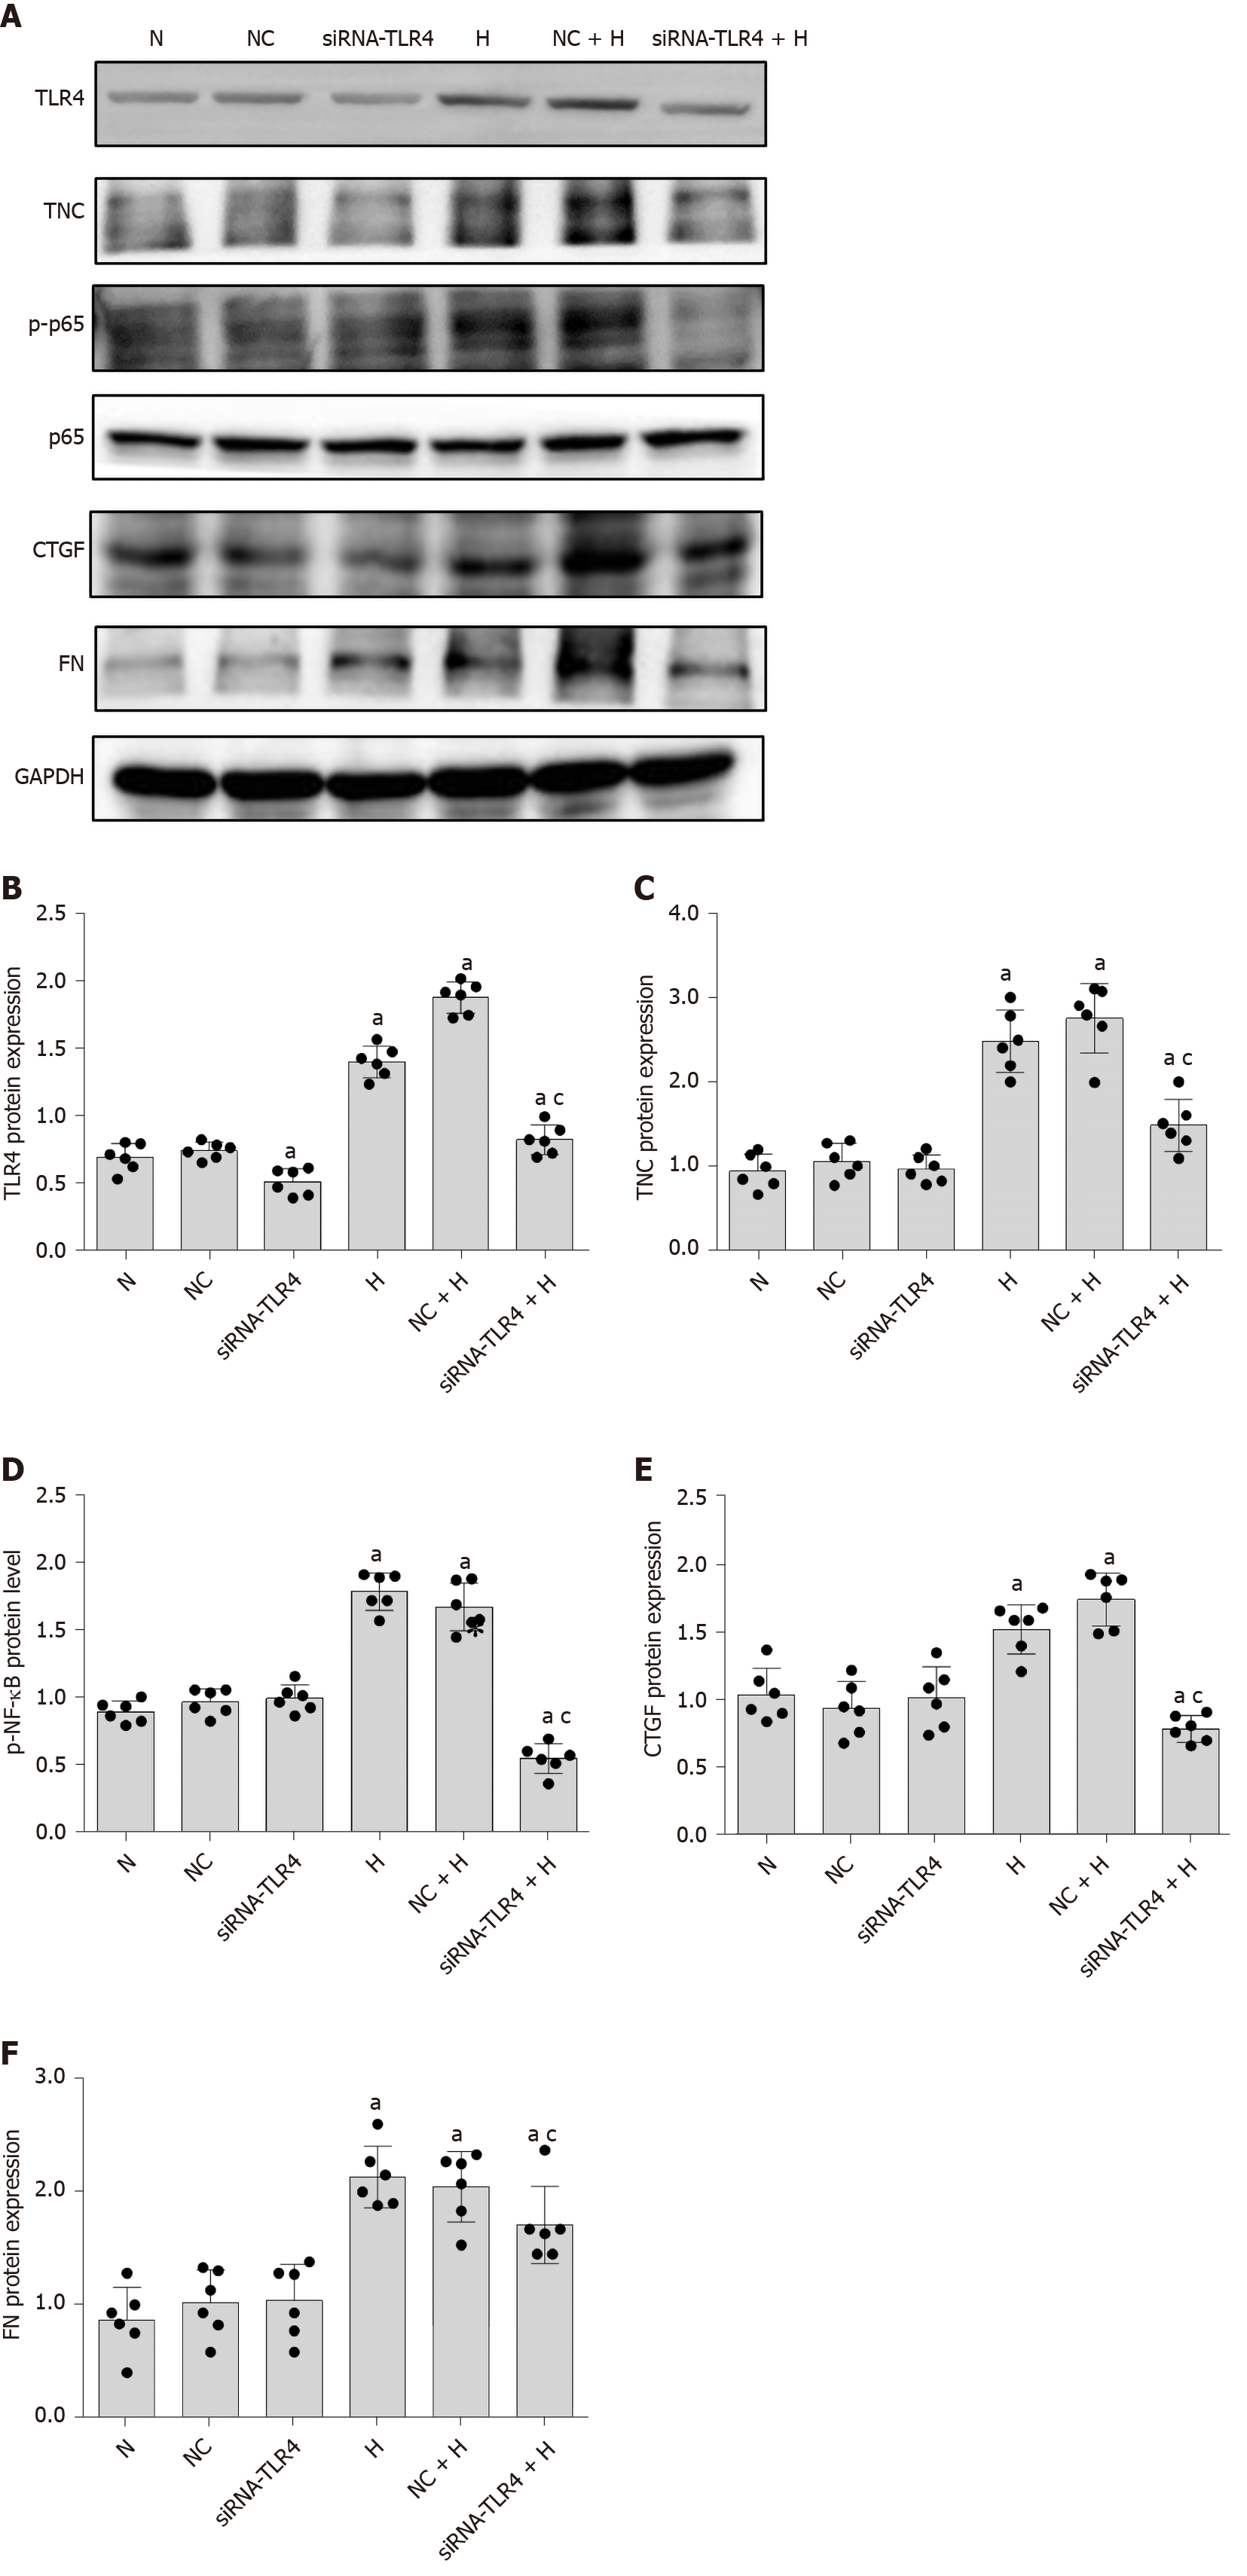
Figure 6 Silencing Toll-like receptor-4 protein expression inhibits the expression of tenascin-C and fibrosis factors (connective tissue growth factor and fibronectin), as well as nuclear factor-κB p65 phosphorylation.
A: Protein bands; B-F: Protein expression of tenascin-C (TNC), Toll-like receptor-4 (TLR4), phosphorylated nuclear factor-κB p65 (Ser536) (p-NF-κB p65), connective tissue growth factor (CTGF), and fibronectin (FN). Rat mesangial cells (RMCs) were transfected with siRNA-TLR4 for 6 h, and the media were then replaced with normal-glucose (NG, 5.5 mmol/L glucose) or high-glucose (HG, 30 mmol/L glucose) medium for 24 h (NG, 5.5 mmol/L glucose), (HG, 30 mmol/L glucose). RMCs were transfected with siRNA-TLR4 and siRNA-NC for 6 h, and the media were then replaced with normal-glucose (NG, 5.5 mmol/L glucose) or high-glucose (HG, 30 mmol/L glucose) medium for 24 h. aP < 0.05 compared with RMCs cultured with normal glucose concentrations; cP < 0.05 compared with RMCs cultured with high glucose concentrations. TNC, TLR4, p-NF-κB p65, NF-κB p65, CTGF, and FN levels were detected using Western blot. The results are presented as the mean ± SD of six independent experiments after normalization to GAPDH levels. TNC: Tenascin-C; TLR4: Toll-like receptor-4; p-p65: Phosphorylated nuclear factor-κB p65 (Ser536); p65: Nuclear factor-κB p65; CTGF: Connective tissue growth factor; FN: Fibronectin; N: Normal control; NC: Negative control; H: High glucose.
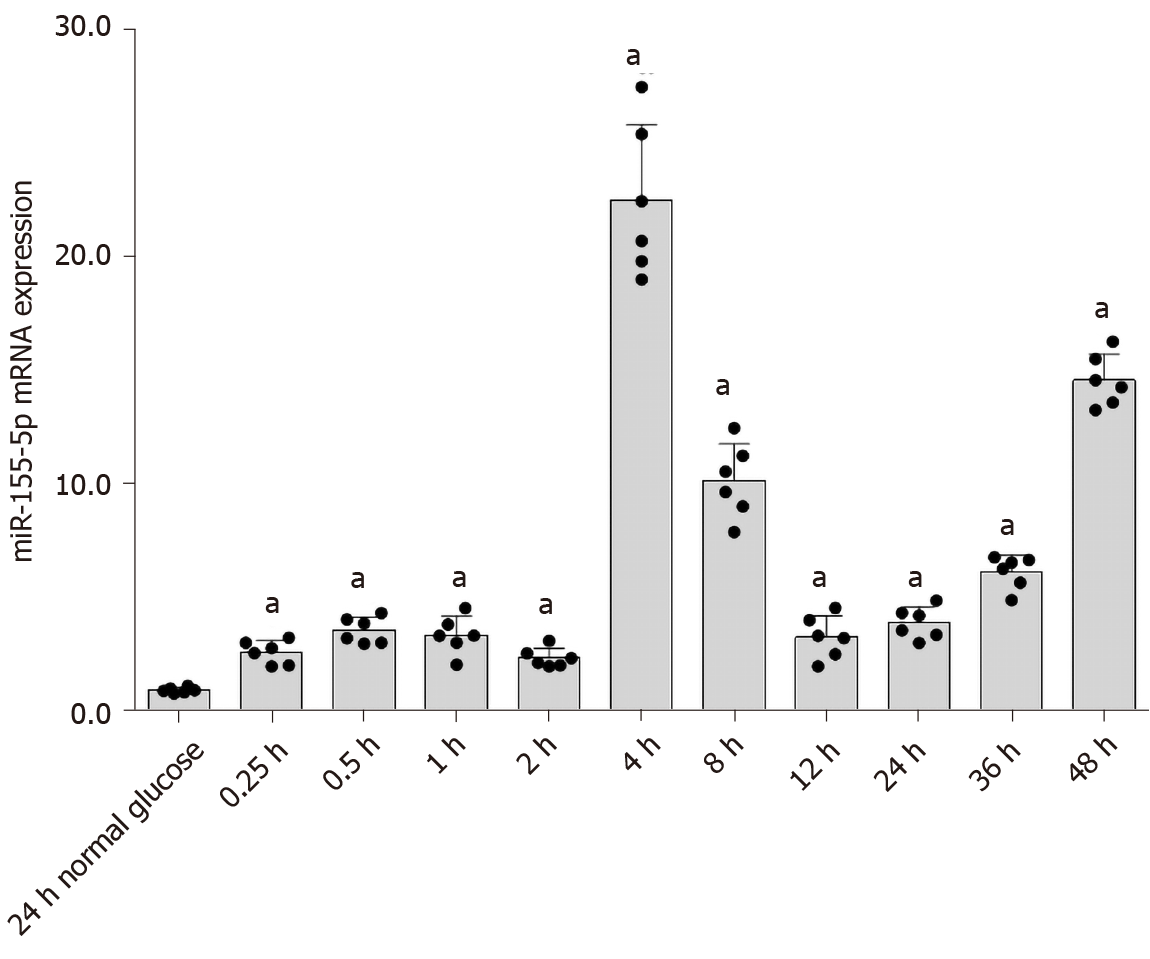
Figure 7 Expression of miR-155-5p induced by high glucose treatment for different durations.
Rat mesangial cells (RMCs) cultured under normal-glucose (NG, 5.5 mmol/L glucose) and high-glucose (HG, 30 mmol/L glucose) conditions were treated with high glucose concentrations for 0.25, 0.5, 1, 2, 4, 8, 12, 24, 36, and 48 h. The expression of miR-155-5p increased beginning at 0.25 h and peaked after 4 h. aP < 0.05 compared with RMCs cultured with normal glucose concentrations. The expression of miR-155-5p was quantified using real-time polymerase chain reaction. The results were normalized to the expression of the U6 mRNA and are presented as the mean ± SD of six independent experiments.
Figure 8 Silencing of Toll-like receptor-4 expression inhibits miR-155-5p expression.
Rat mesangial cells (RMCs) were transfected with siRNA-TLR4 to silence Toll-like receptor-4 (TLR4) expression and siRNA-NC for 6 h, and the media were then replaced with normal-glucose (NG, 5.5 mmol/L glucose) or high-glucose (HG, 30 mmol/L glucose) medium for 24 h. aP < 0.05 compared with RMCs cultured with normal glucose concentrations; cP < 0.05 compared with RMCs cultured with high glucose concentrations. The expression of miR-155-5p was quantified using real-time polymerase chain reaction. The results were normalized to the expression of the U6 mRNA and are presented as the mean ± SD of six independent experiments. TLR4: Toll-like receptor-4; N: Normal control; NC: Negative control; H: High-glucose.
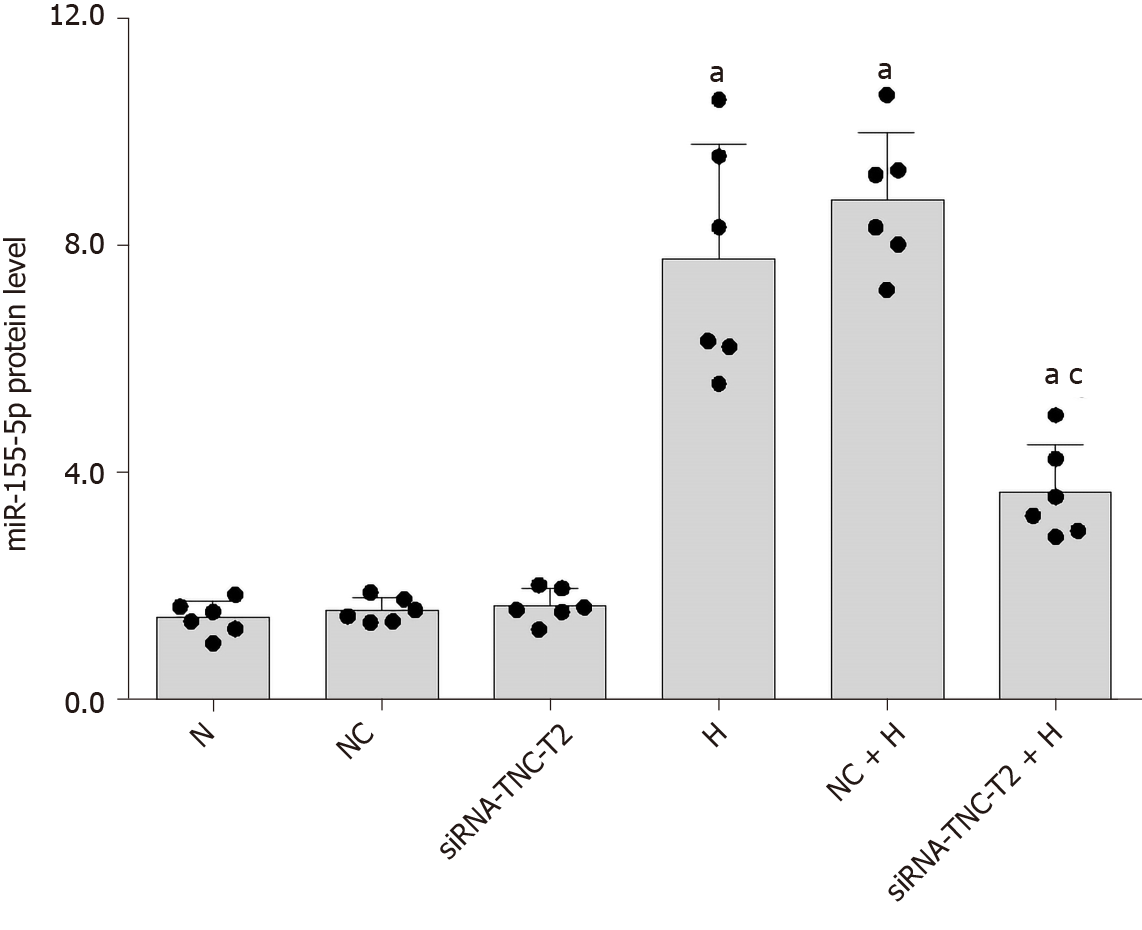
Figure 9 Silencing of tenascin-C expression inhibits miR-155-5p expression.
Rat mesangial cells (RMCs) were transfected with siRNA-TNC-T2 and siRNA-NC for 6 h, and the media were then replaced with normal-glucose (NG, 5.5 mmol/L glucose) or high-glucose (HG, 30 mmol/L glucose) medium for 24 h. aP < 0.05 compared with RMCs cultured with normal glucose concentrations; cP < 0.05 compared with RMCs cultured with high glucose concentrations. The expression of miR-155-5p was quantified using real-time polymerase chain reaction. The results were normalized to the expression of the U6 mRNA and are presented as the mean ± SD of six independent experiments. N: Normal control; NC: Negative control; H: High-glucose.
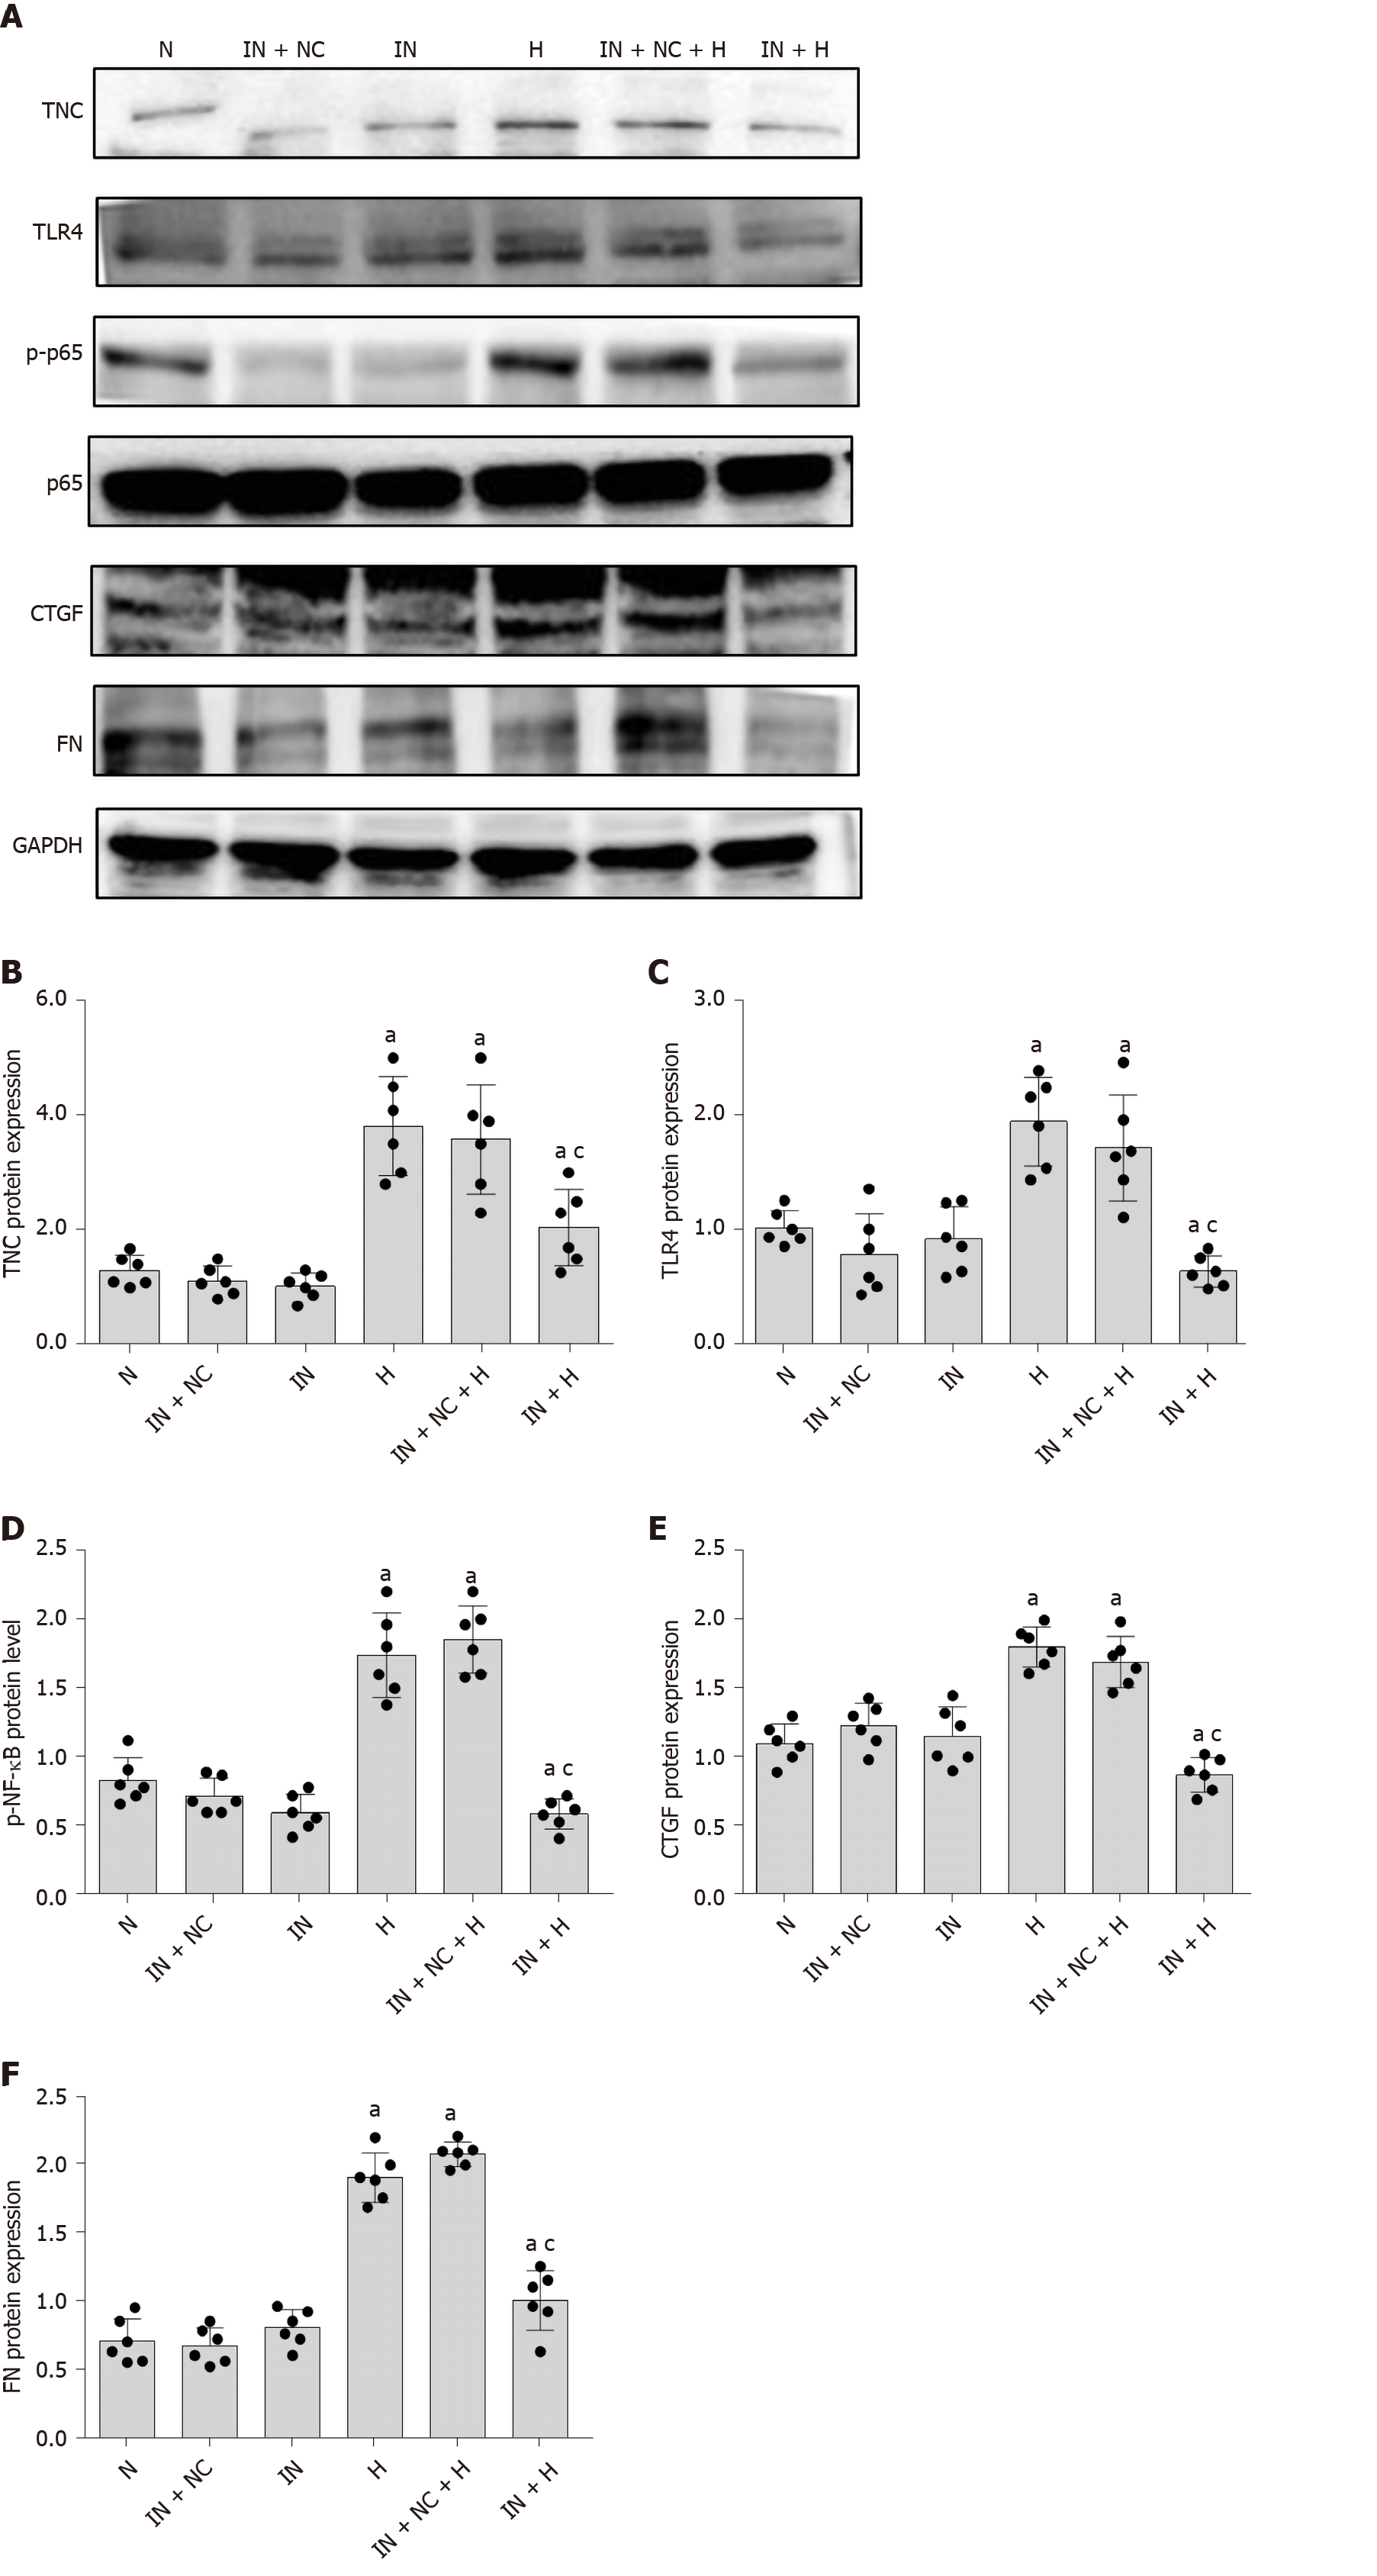
Figure 10 Inhibition of miR-155-5p expression.
A: Protein bands; B-F: Protein expression of tenascin-C (TNC), Toll-like receptor-4 (TLR4), phosphorylated nuclear factor-κB p65 (Ser536) (p-NF-κB p65), connective tissue growth factor (CTGF), and fibronectin (FN). Rat mesangial cells (RMCs) were transfected with a miR-155-5p inhibitor to inhibit the expression of miR-155-5p (IN) or non-specific inhibitor (IN-NC) for 6 h and further cultured with normal glucose or high glucose concentrations for 24 h. The inhibition of miR-155-5p reduced the levels of TNC, TLR4, fibrosis factors (CTGF and FN), and p-NF-κB p65. RMCs were transfected with siRNA-IN to inhibit miR-155-5p and siRNA-NC for 6 h, and the media were then replaced with normal-glucose (NG, 5.5 mmol/L glucose) or high-glucose (HG, 30 mmol/L glucose) medium for 24 h. aP < 0.05 compared with RMCs cultured with normal glucose concentrations; cP < 0.05 compared with RMCs cultured with high glucose concentrations. TNC, TLR4, p-NF-κB p65, NF-κB p65, CTGF, and FN levels were all detected using Western blot. The results are presented as the mean ± SD of six independent experiments after normalization to GAPDH levels. TNC: Tenascin-C; TLR4: Toll-like receptor-4; p-NF-κB p65: Phosphorylated nuclear factor-κB p65 (Ser536); NF-κB p65: Nuclear factor-κB p65; CTGF: Connective tissue growth factor; FN; Fibronectin; N: Normal control; NC: Negative control; H: High-glucose.
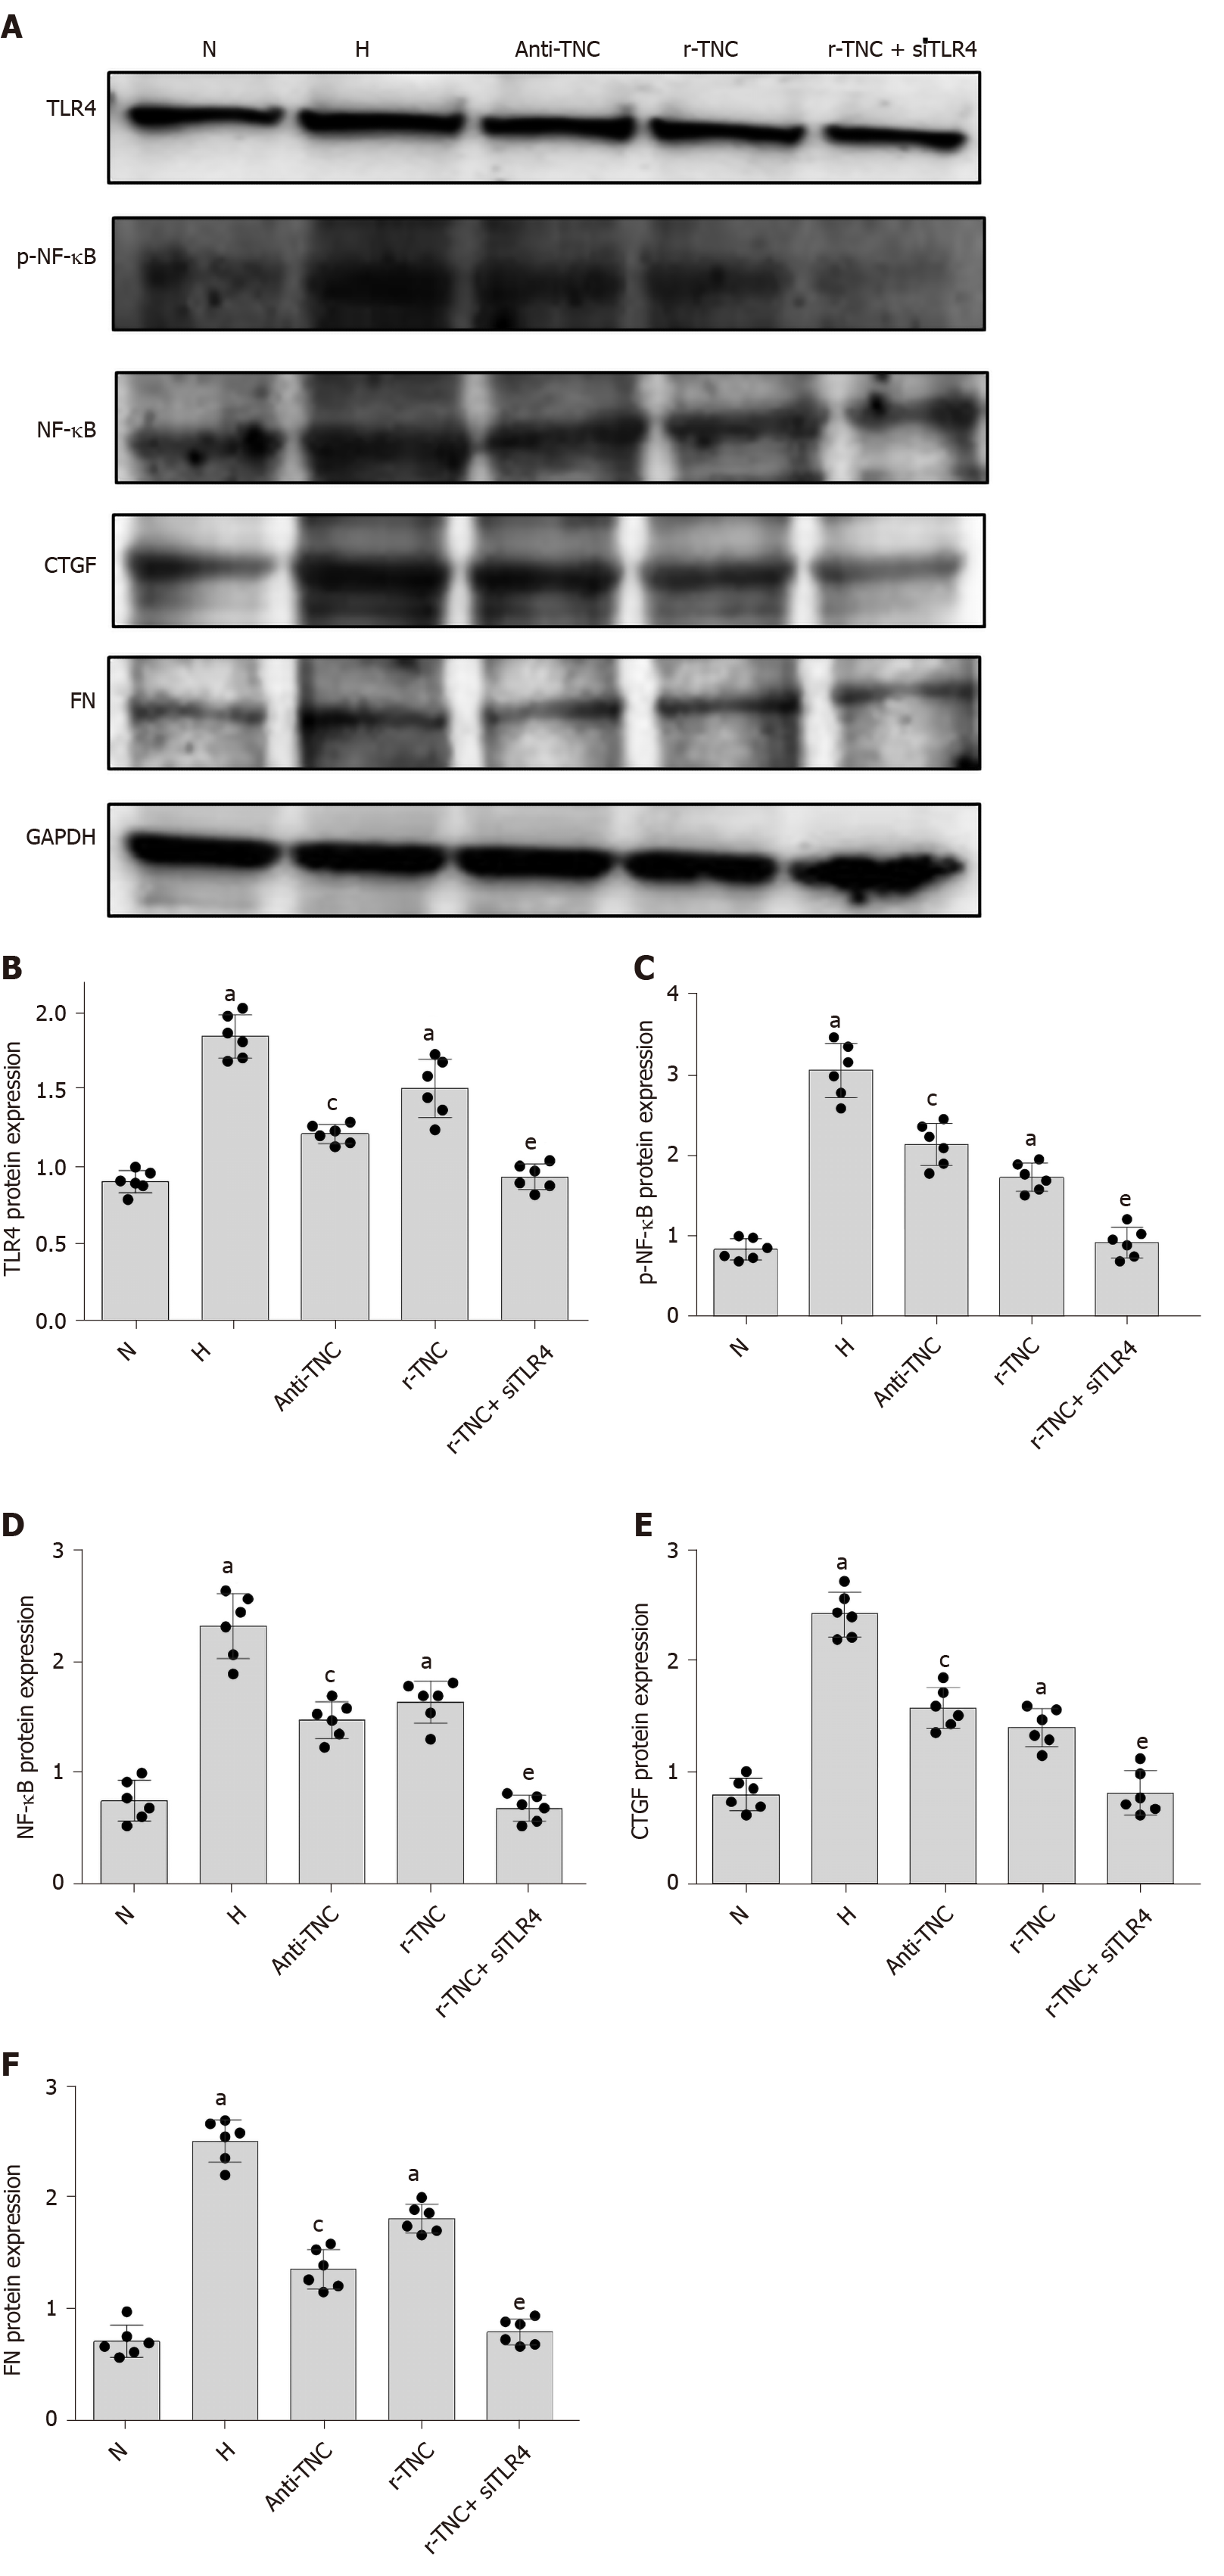
Figure 11 Signaling pathway experiment.
A: Protein bands; B-F: Protein expression of Toll-like receptor-4 (TLR4), phosphorylated nuclear factor-κB p65 (Ser536) (p-NF-κB p65), connective tissue growth factor (CTGF), and fibronectin (FN). Rat mesangial cells (RMCs) were treated with TNC inhibitory antibody or TNC recombinant protein with or without transfected with siRNA-TLR4. RMCs cultured with normal glucose concentrations (N, 5.5 mmol/L glucose) or high-glucose (H, 30 mmol/L glucose) medium for 24 h, RMCs were pretreated with 0.5 mg/mL TNC blocking peptide and cultured with high-glucose (Anti-TNC, 30 mmol/L glucose), RMCs were treated with 2.5 ug/mL recombinant TNC (r-TNC), RMCs were transfected with siRNA-TLR4 to silence TLR4 expression for 6 h, and the media were then replaced with normal-glucose (NG, 5.5 mmol/L glucose) and treated with 2.5 ug/mL r-TNC(r-TNC+siTLR4). All RMCs were treated for 24 h and collected for subsequent experiments. aP < 0.05 compared with RMCs cultured with normal glucose concentrations; cP < 0.05 compared with RMCs cultured with high glucose concentrations; eP < 0.05 compared with RMCs treated with r-TNC. TLR4, p-NF-κB p65, NF-κB p65, connective tissue growth factor, and fibronectin levels were all detected using Western blot. The results are presented as the mean ± SD of six independent experiments after normalization to GAPDH levels. TLR4: Toll-like receptor-4; p-NF-κB p65: Phosphorylated nuclear factor-κB p65 (Ser536); NF-κB p65: Nuclear factor-κB p65; CTGF: Connective tissue growth factor; FN: Fibronectin; N: Normal control; H: High-glucose.
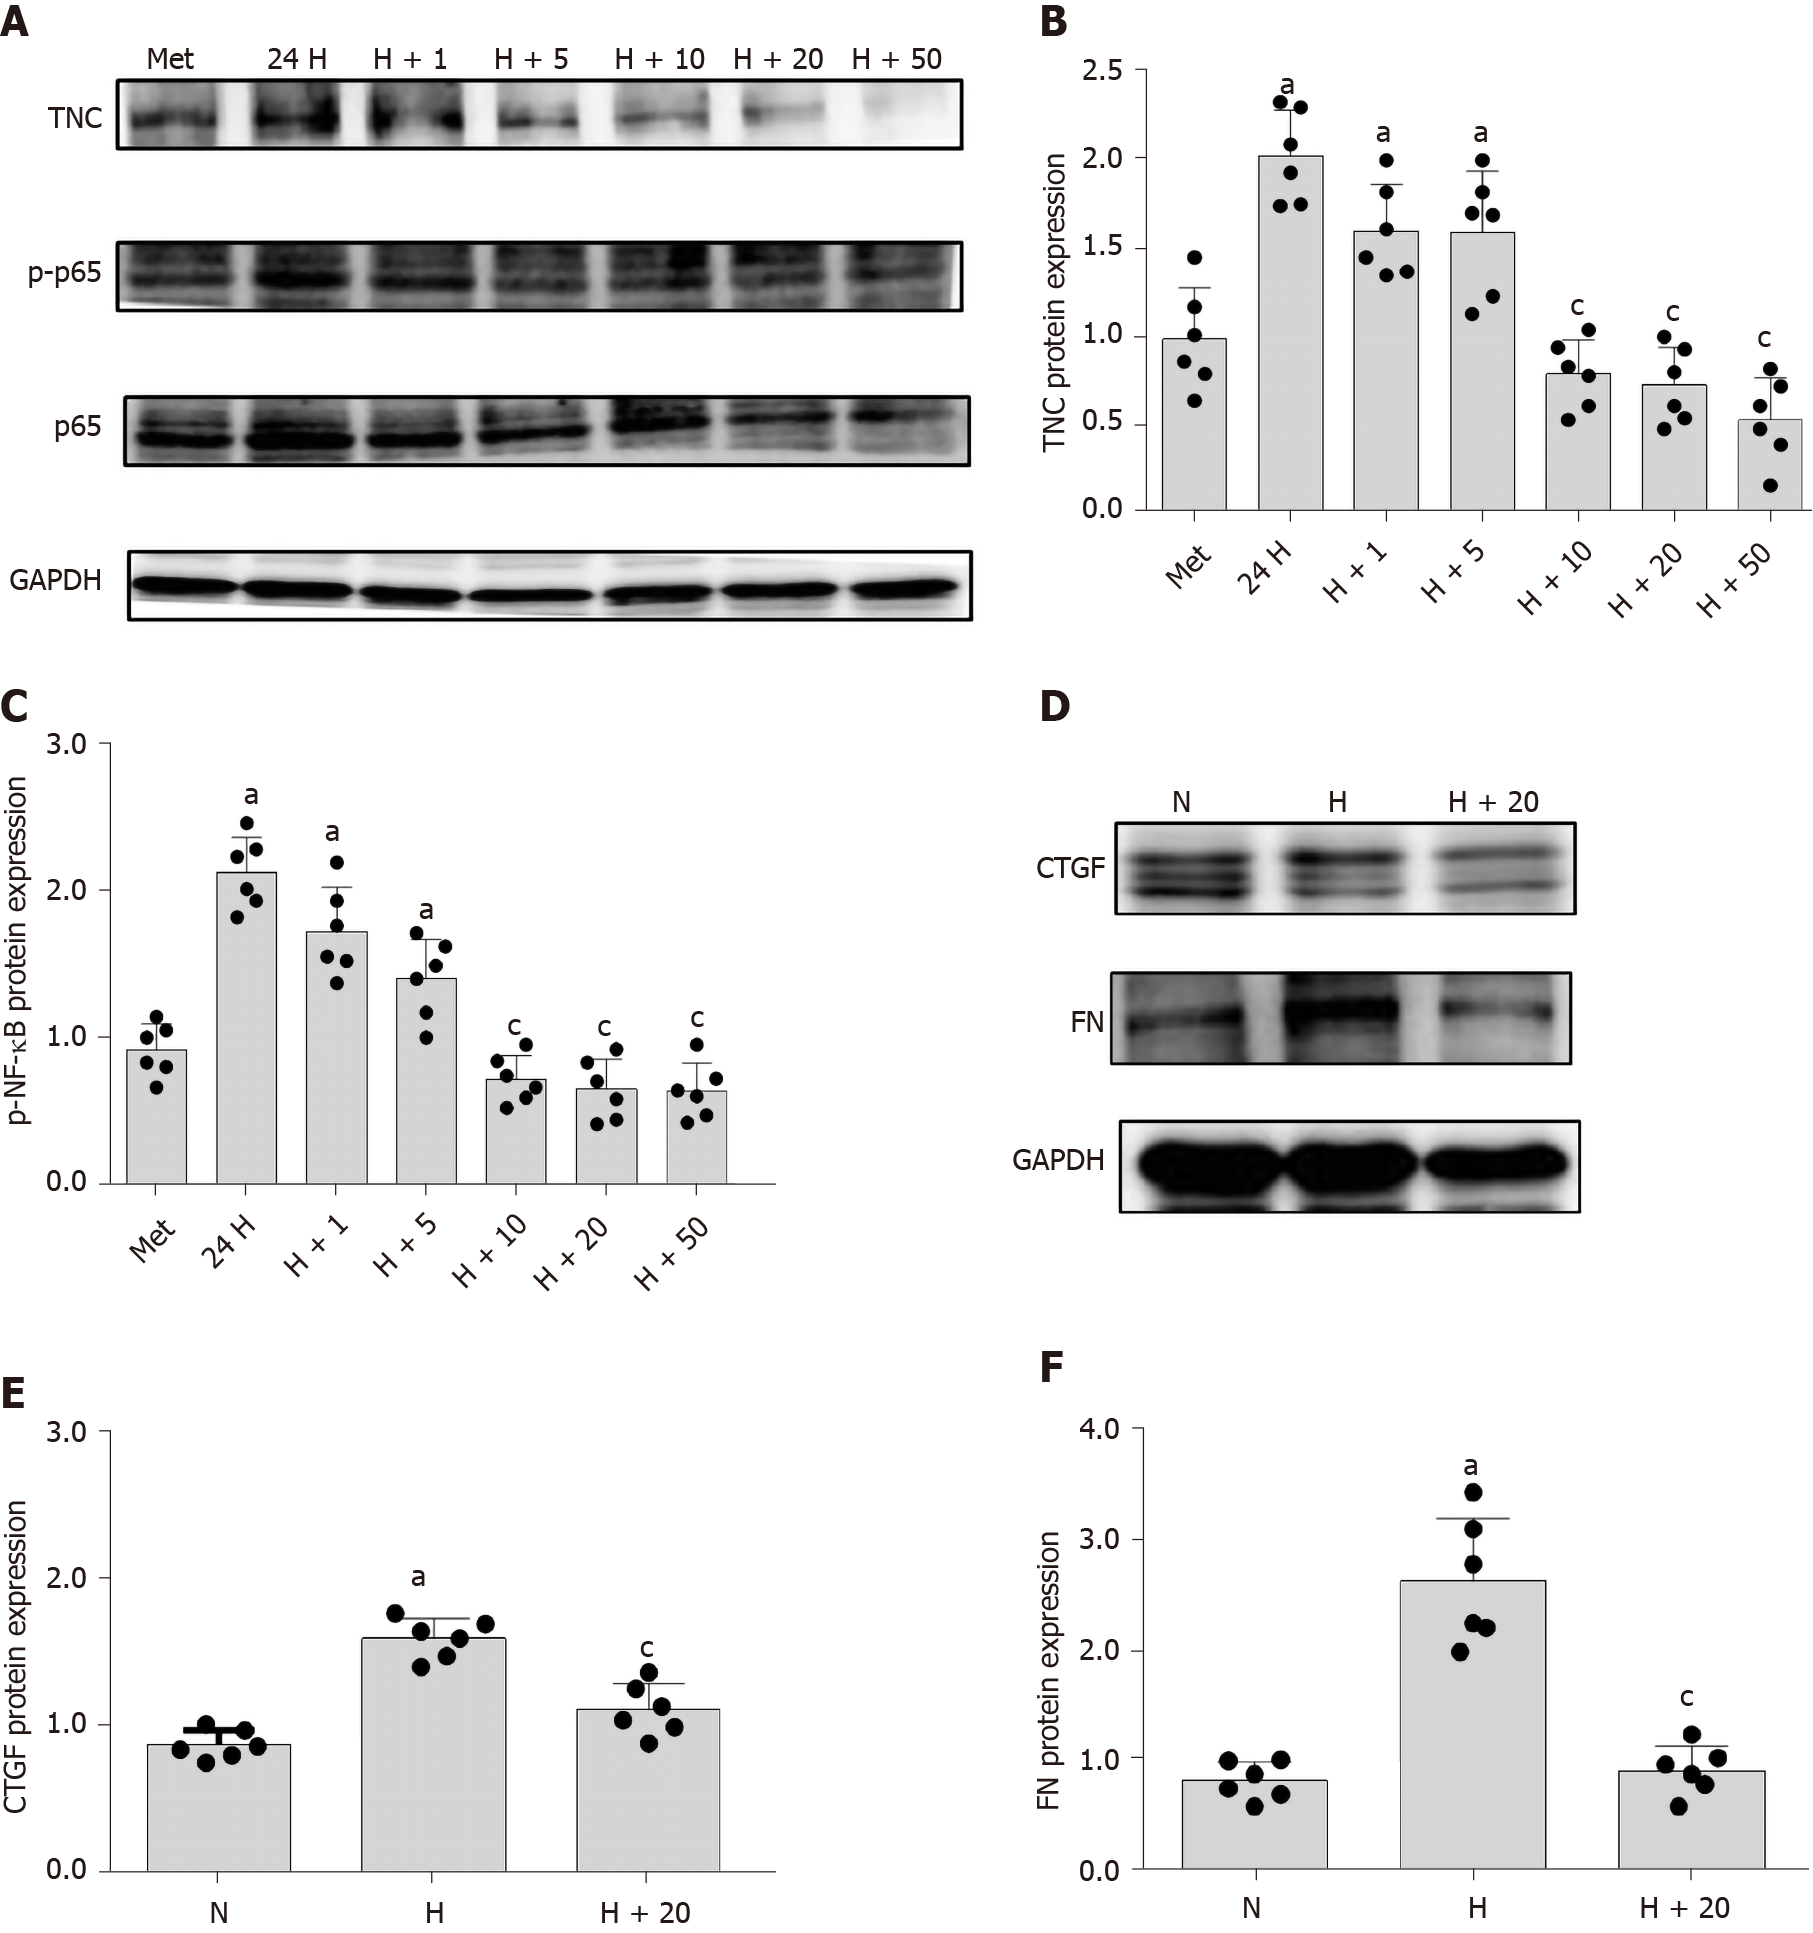
Figure 12 Inhibitory effects of metformin on rat mesangial cells.
A-C: Protein bands and protein expression of tenascin-C (TNC) and phosphorylated nuclear factor-κB p65 (Ser536) (p-NF-κB p65). The MET (5.5 mmol/L glucose + 10 μmol/L metformin), 24H (30 mmol/L glucose), H+1 (30 mmol/L glucose + 1 μmol/L metformin), H+5 (30 mmol/L glucose + 5 μmol/L metformin), H+10 (30 mmol/L glucose + 10 μmol/L metformin), H+20 (30 mmol/L glucose + 20 μmol/L metformin), and H+50 (30 mmol/L glucose + 50 μmol/L metformin) groups were cultured with the appropriate medium for 24 h. aP < 0.05 compared with rat mesangial cells (RMCs) cultured with normal glucose concentrations; cP < 0.05 compared with RMCs cultured with high glucose concentrations; D-F: Protein bands and protein expression of connective tissue growth factor (CTGF) and fibronectin (FN). RMCs were divided into normal-glucose (NG, 5.5 mmol/L glucose), high-glucose (HG, 30 mmol/L glucose), and H+20 (30 mmol/L glucose + 20 μmol/L metformin) groups and cultured with the appropriate medium for 24 h. aP < 0.05 compared with RMCs cultured with normal glucose concentrations; cP < 0.05 compared with RMCs cultured with high glucose concentrations. TNC, p-NF-κB p65, and NF-κB p65 levels were detected using Western blot. The results are presented as the mean ± SD of six independent experiments after normalization to GAPDH levels. TNC: Tenascin-C; p-NF-κB p65: Phosphorylated nuclear factor-κB p65 (Ser536); NF-κB p65: Nuclear factor-κB p65; CTGF: Connective tissue growth factor; FN: Fibronectin; N: Normal control; H: High-glucose.
- Citation: Zhou Y, Ma XY, Han JY, Yang M, Lv C, Shao Y, Wang YL, Kang JY, Wang QY. Metformin regulates inflammation and fibrosis in diabetic kidney disease through TNC/TLR4/NF-κB/miR-155-5p inflammatory loop. World J Diabetes 2021; 12(1): 19-46
- URL: https://www.wjgnet.com/1948-9358/full/v12/i1/19.htm
- DOI: https://dx.doi.org/10.4239/wjd.v12.i1.19


