Copyright
©The Author(s) 2020.
World J Diabetes. May 15, 2020; 11(5): 202-212
Published online May 15, 2020. doi: 10.4239/wjd.v11.i5.202
Published online May 15, 2020. doi: 10.4239/wjd.v11.i5.202
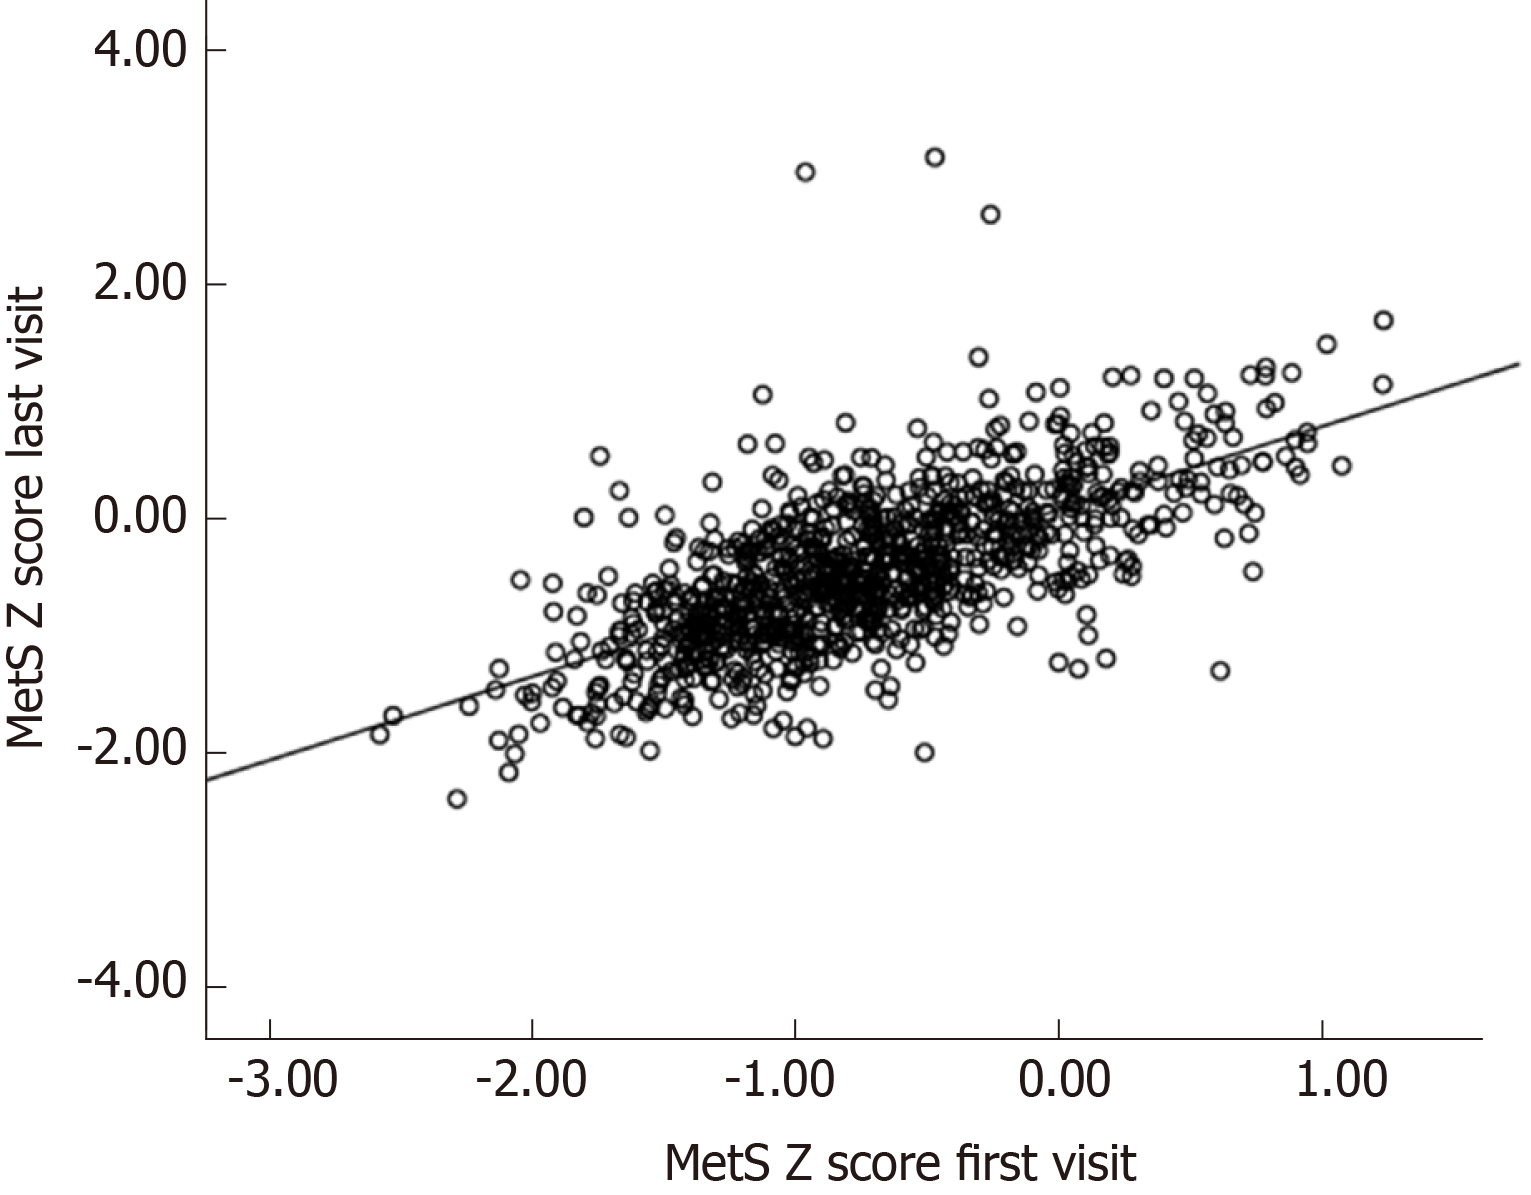
Figure 1 Correlation of metabolic syndrome severity scores within individuals over time.
Metabolic syndrome severity Z-scores on the x-axis in first visit (2003-2005) and on the y-axis during last visit (2018). Pearson’s r = 0.67 (P < 0.001).
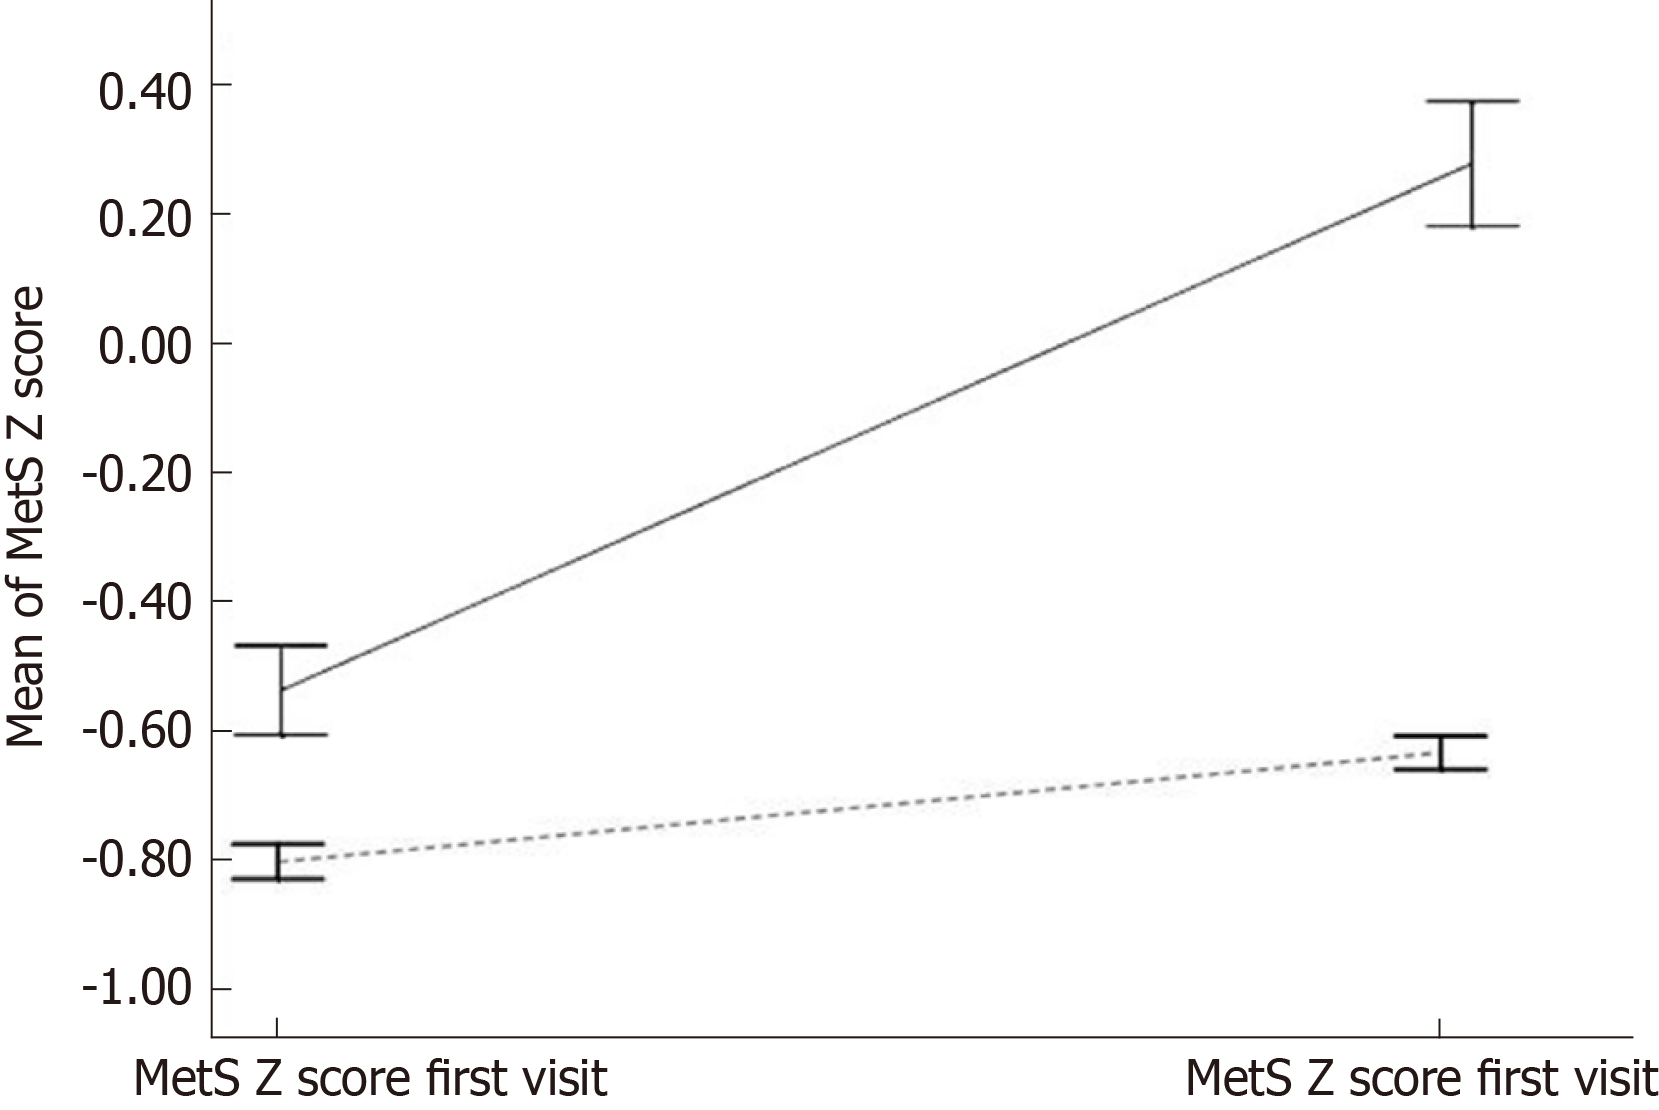
Figure 2 Mean metabolic syndrome severity scores within individuals by later diabetes status.
Metabolic syndrome Z-score (mean, 95% confidence interval) by disease status for diabetes. Scores shown are those obtained during first and last visits among individuals who remained disease-free (dotted line, n = 564), those with incident disease between two visits (continuous line, n = 70). Comparison with disease-free group: P < 0.05 for first visit, P < 0.01 for last visit.
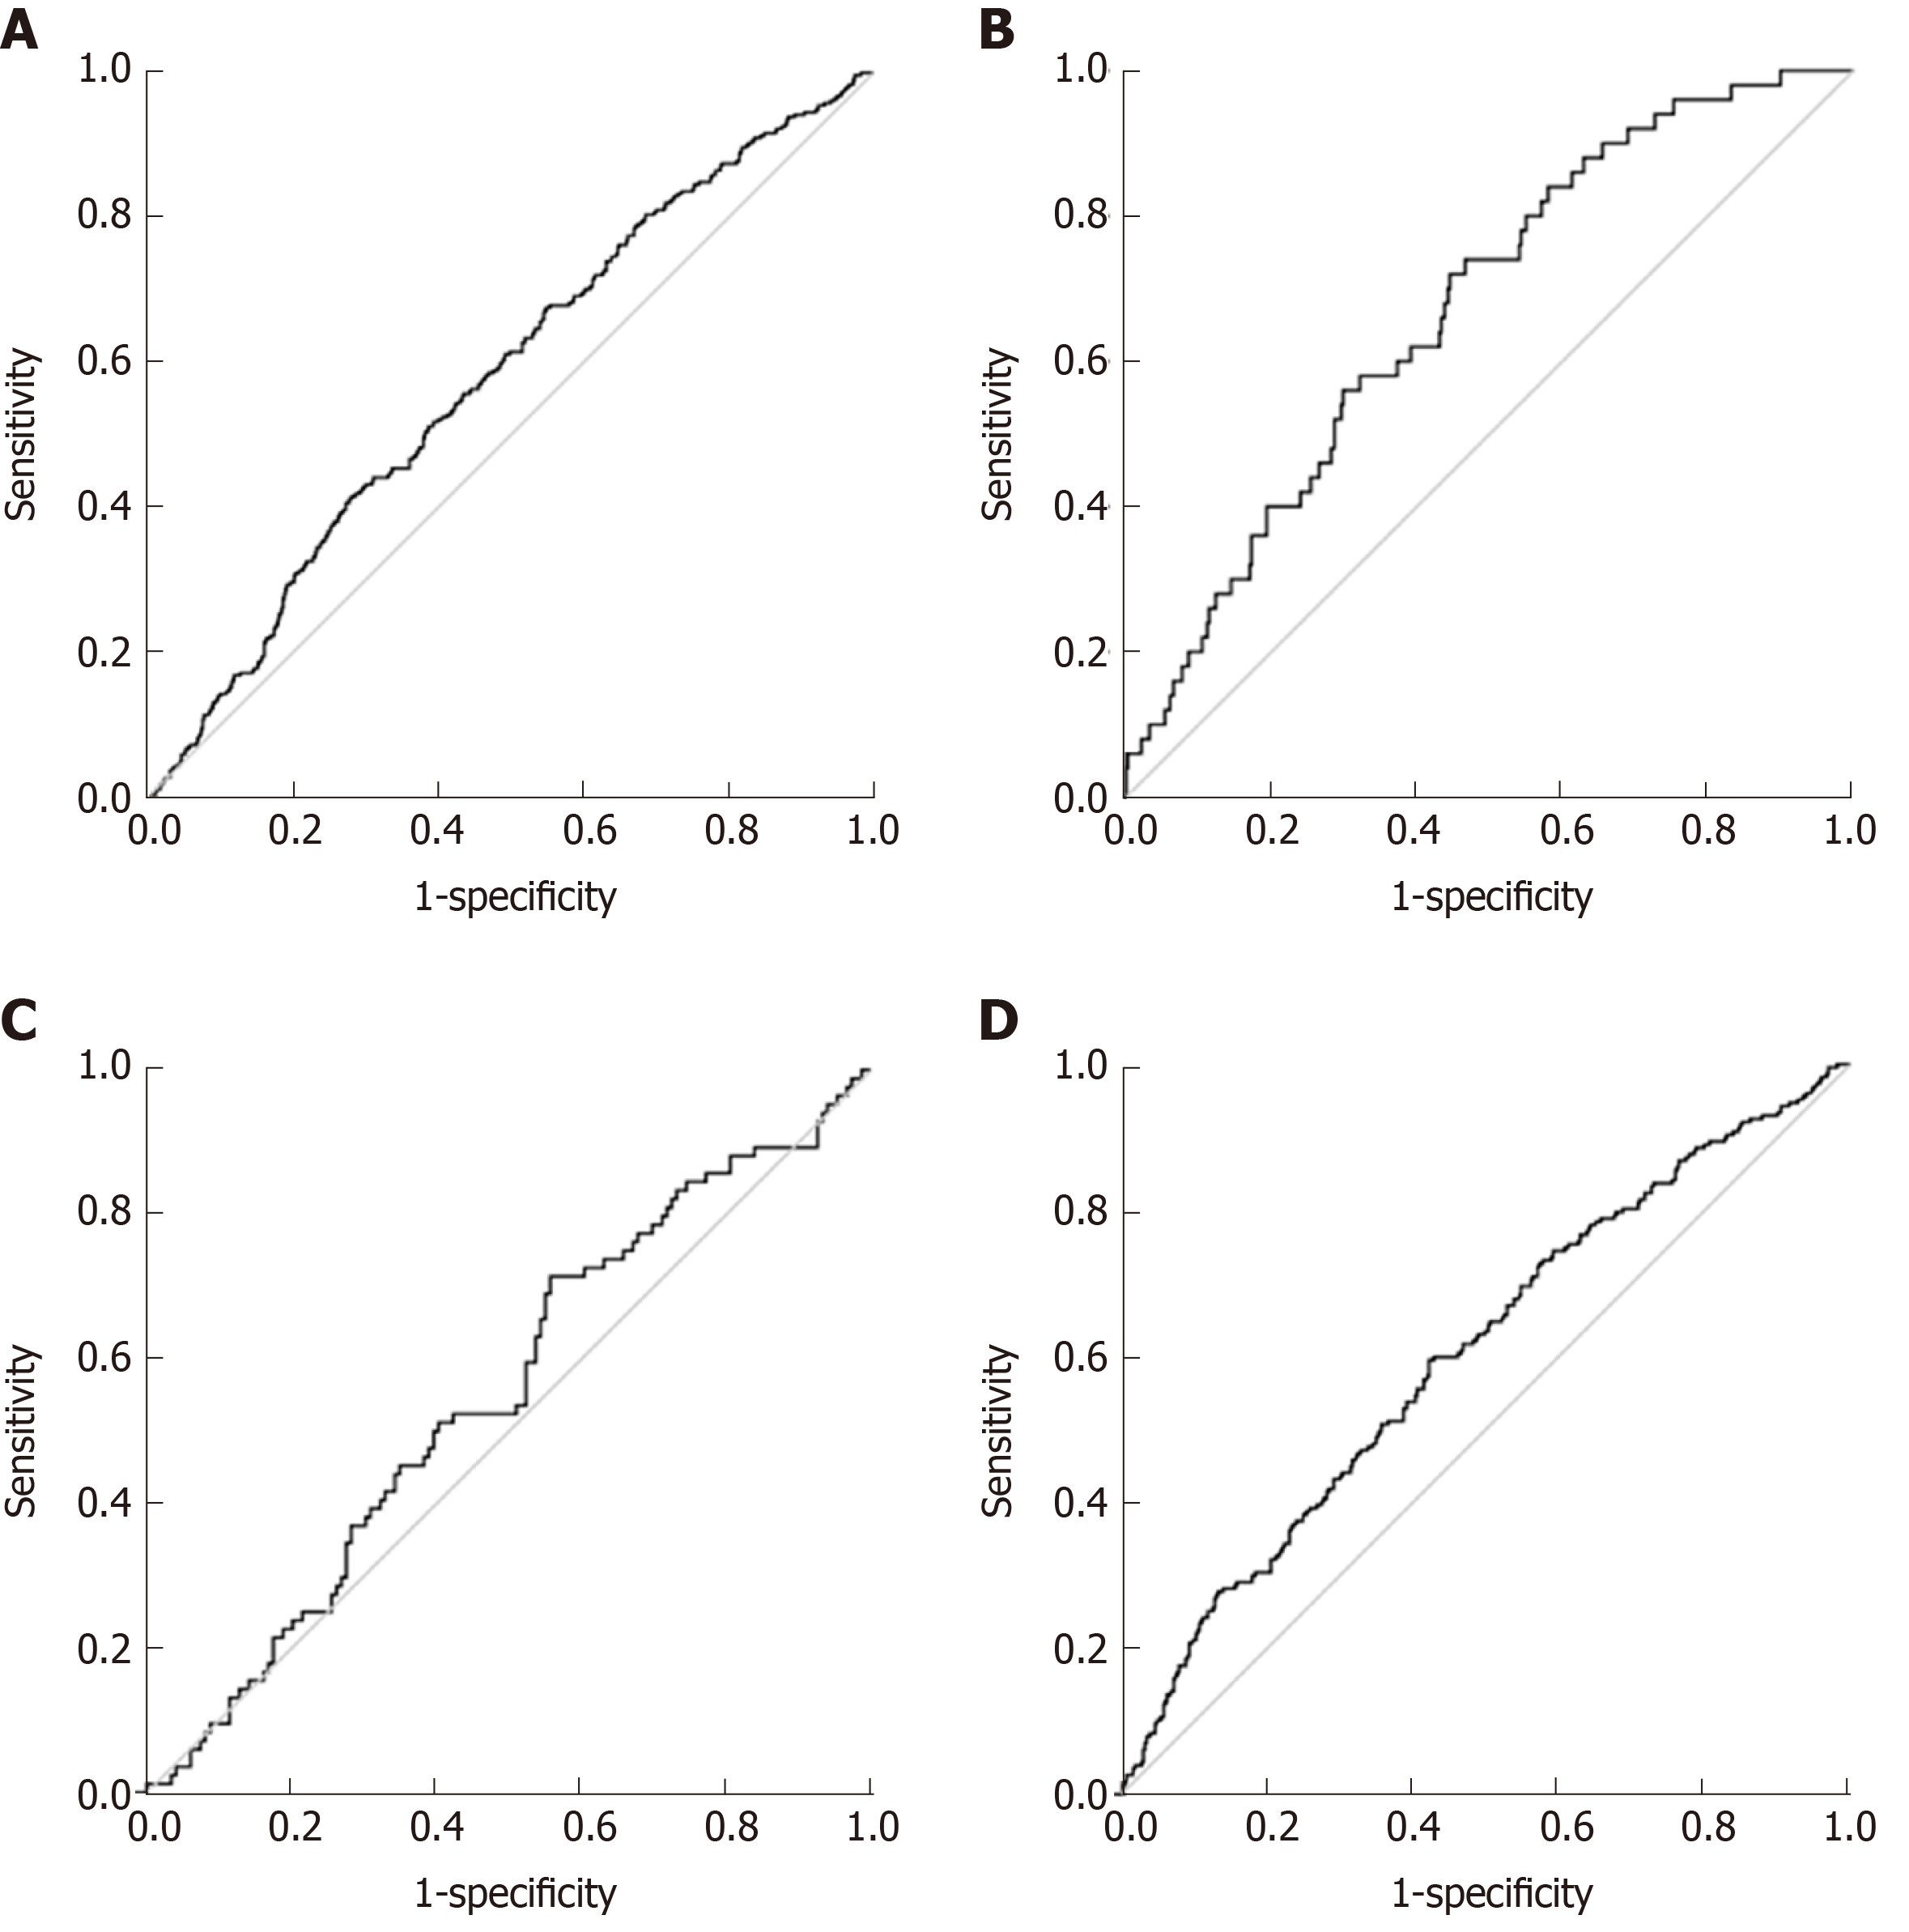
Figure 3 Receiver operating characteristic curves of metabolic syndrome Z-score.
A and B: Predicting future incidence of diabetes (A: Male; B: Female); C and D: Predicting future incidence of prediabetes (C: Male; D: Female).
- Citation: Meamar R, Amini M, Aminorroaya A, Nasri M, Abyar M, Feizi A. Severity of the metabolic syndrome as a predictor of prediabetes and type 2 diabetes in first degree relatives of type 2 diabetic patients: A 15-year prospective cohort study. World J Diabetes 2020; 11(5): 202-212
- URL: https://www.wjgnet.com/1948-9358/full/v11/i5/202.htm
- DOI: https://dx.doi.org/10.4239/wjd.v11.i5.202


