©The Author(s) 2020.
World J Diabetes. Oct 15, 2020; 11(10): 468-480
Published online Oct 15, 2020. doi: 10.4239/wjd.v11.i10.468
Published online Oct 15, 2020. doi: 10.4239/wjd.v11.i10.468
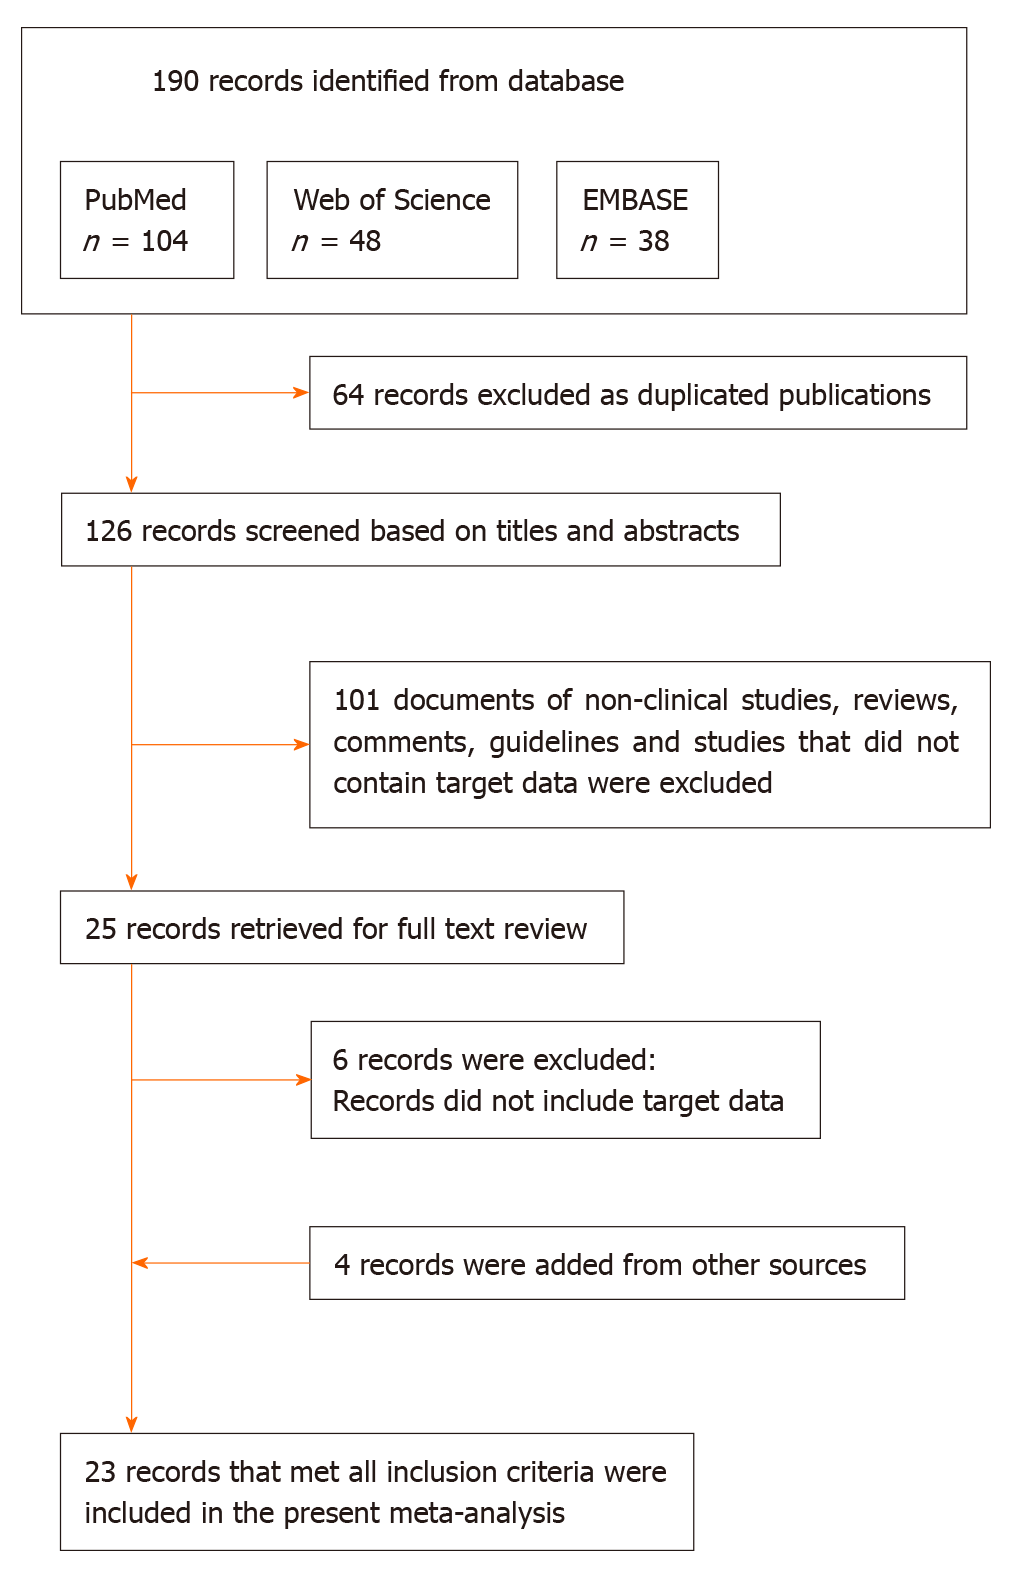
Figure 1 Flow diagram of the study selection process.
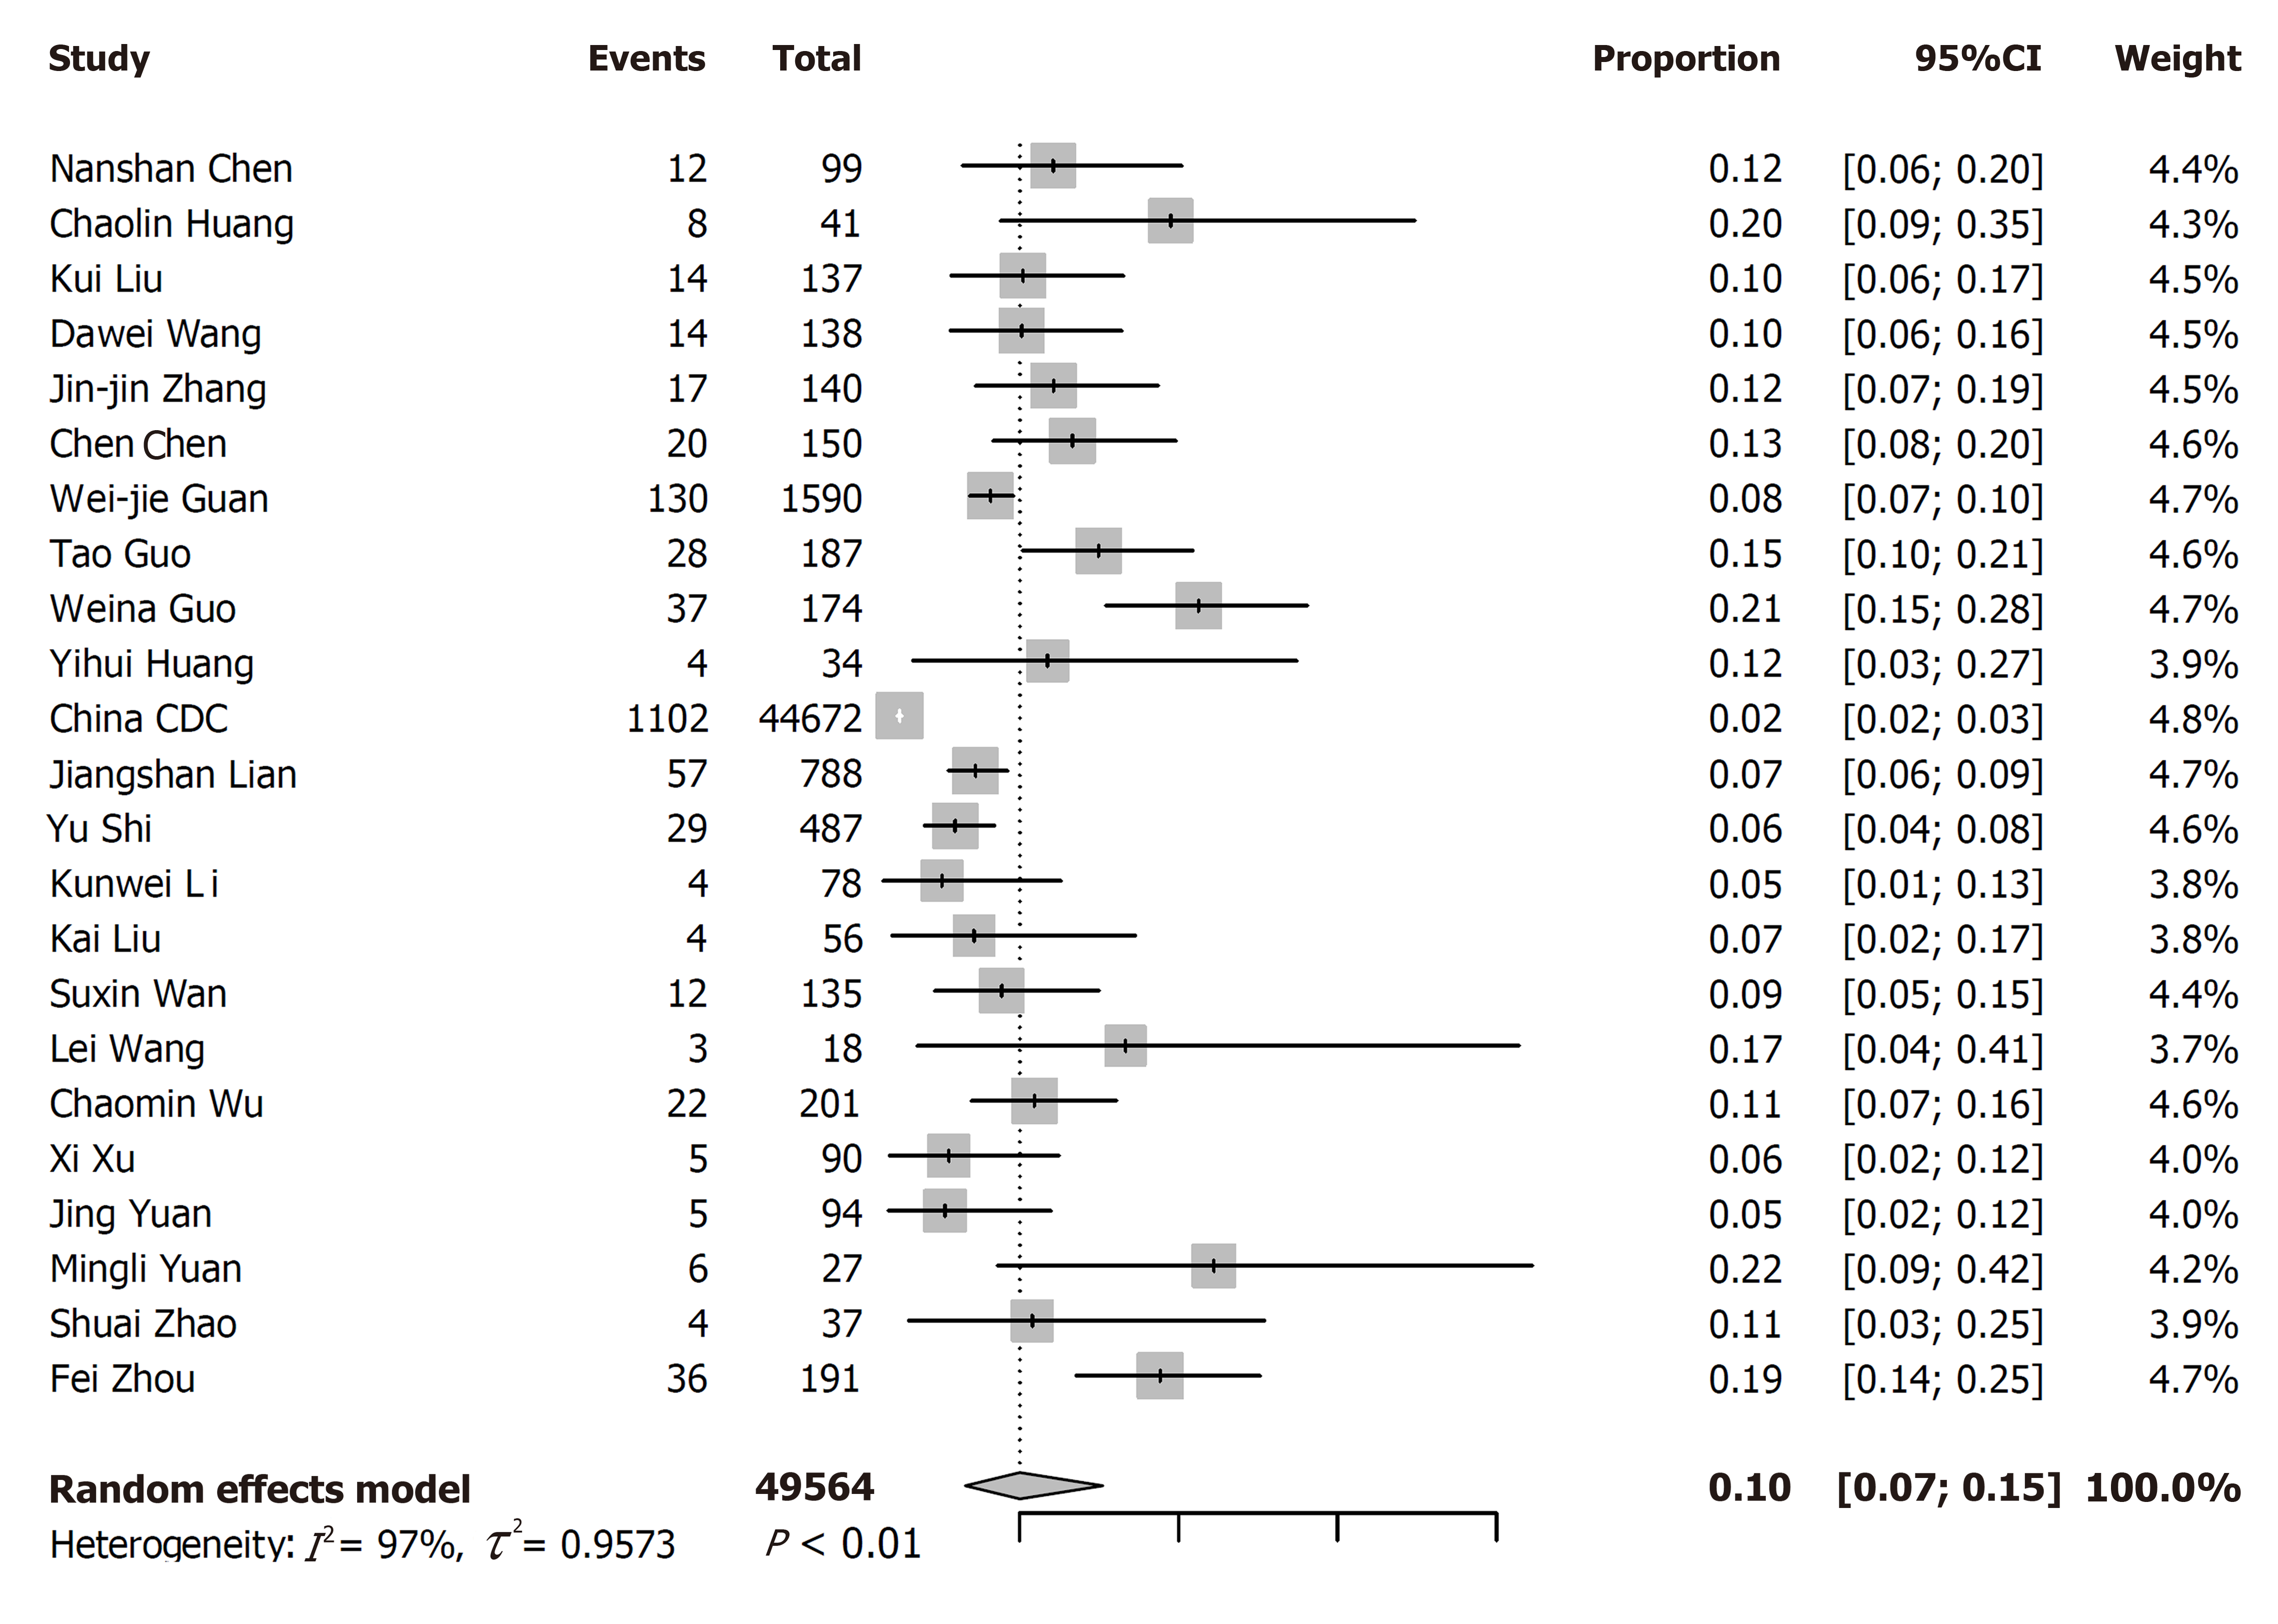
Figure 2 Meta-analysis for the prevalence of diabetes in coronavirus disease 2019 cases in China.
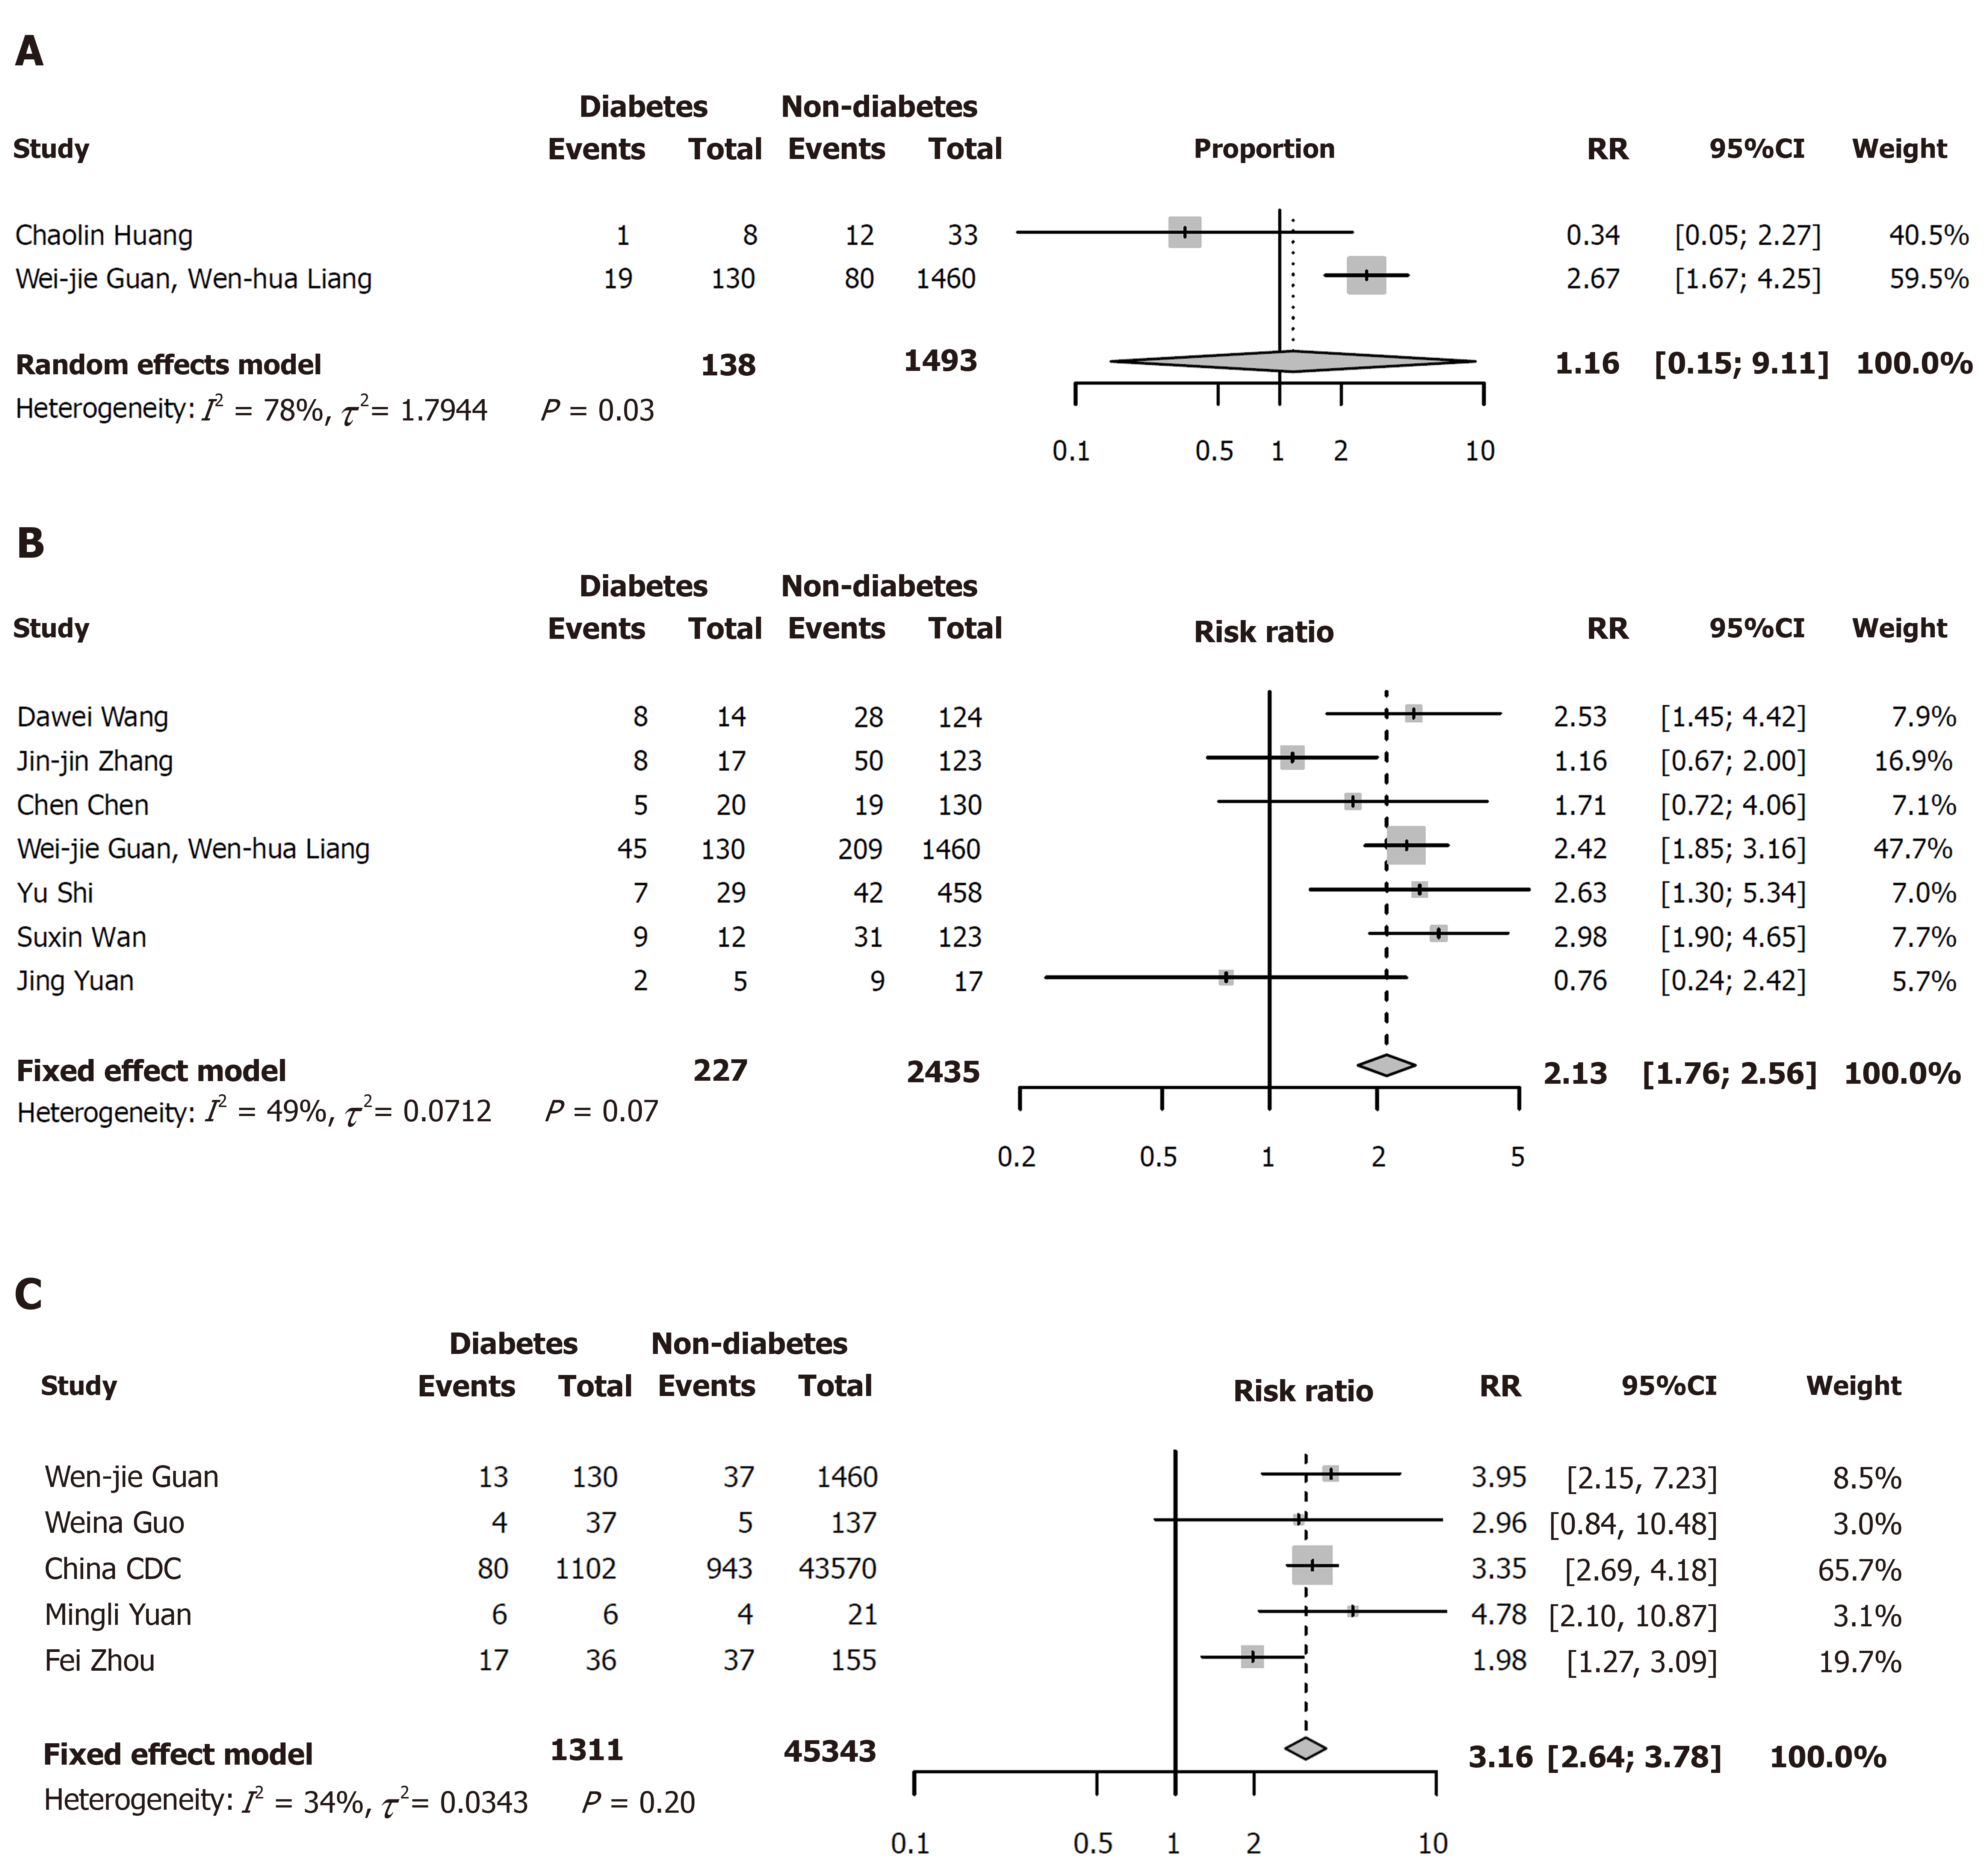
Figure 3 Forest plots for impact of diabetes on clinical outcomes.
A: Intensive care unit vs non-intensive care unit; B: Severe vs non-severe; C: Death vs survival. RR: Risk ratio; CI: Confidence interval.
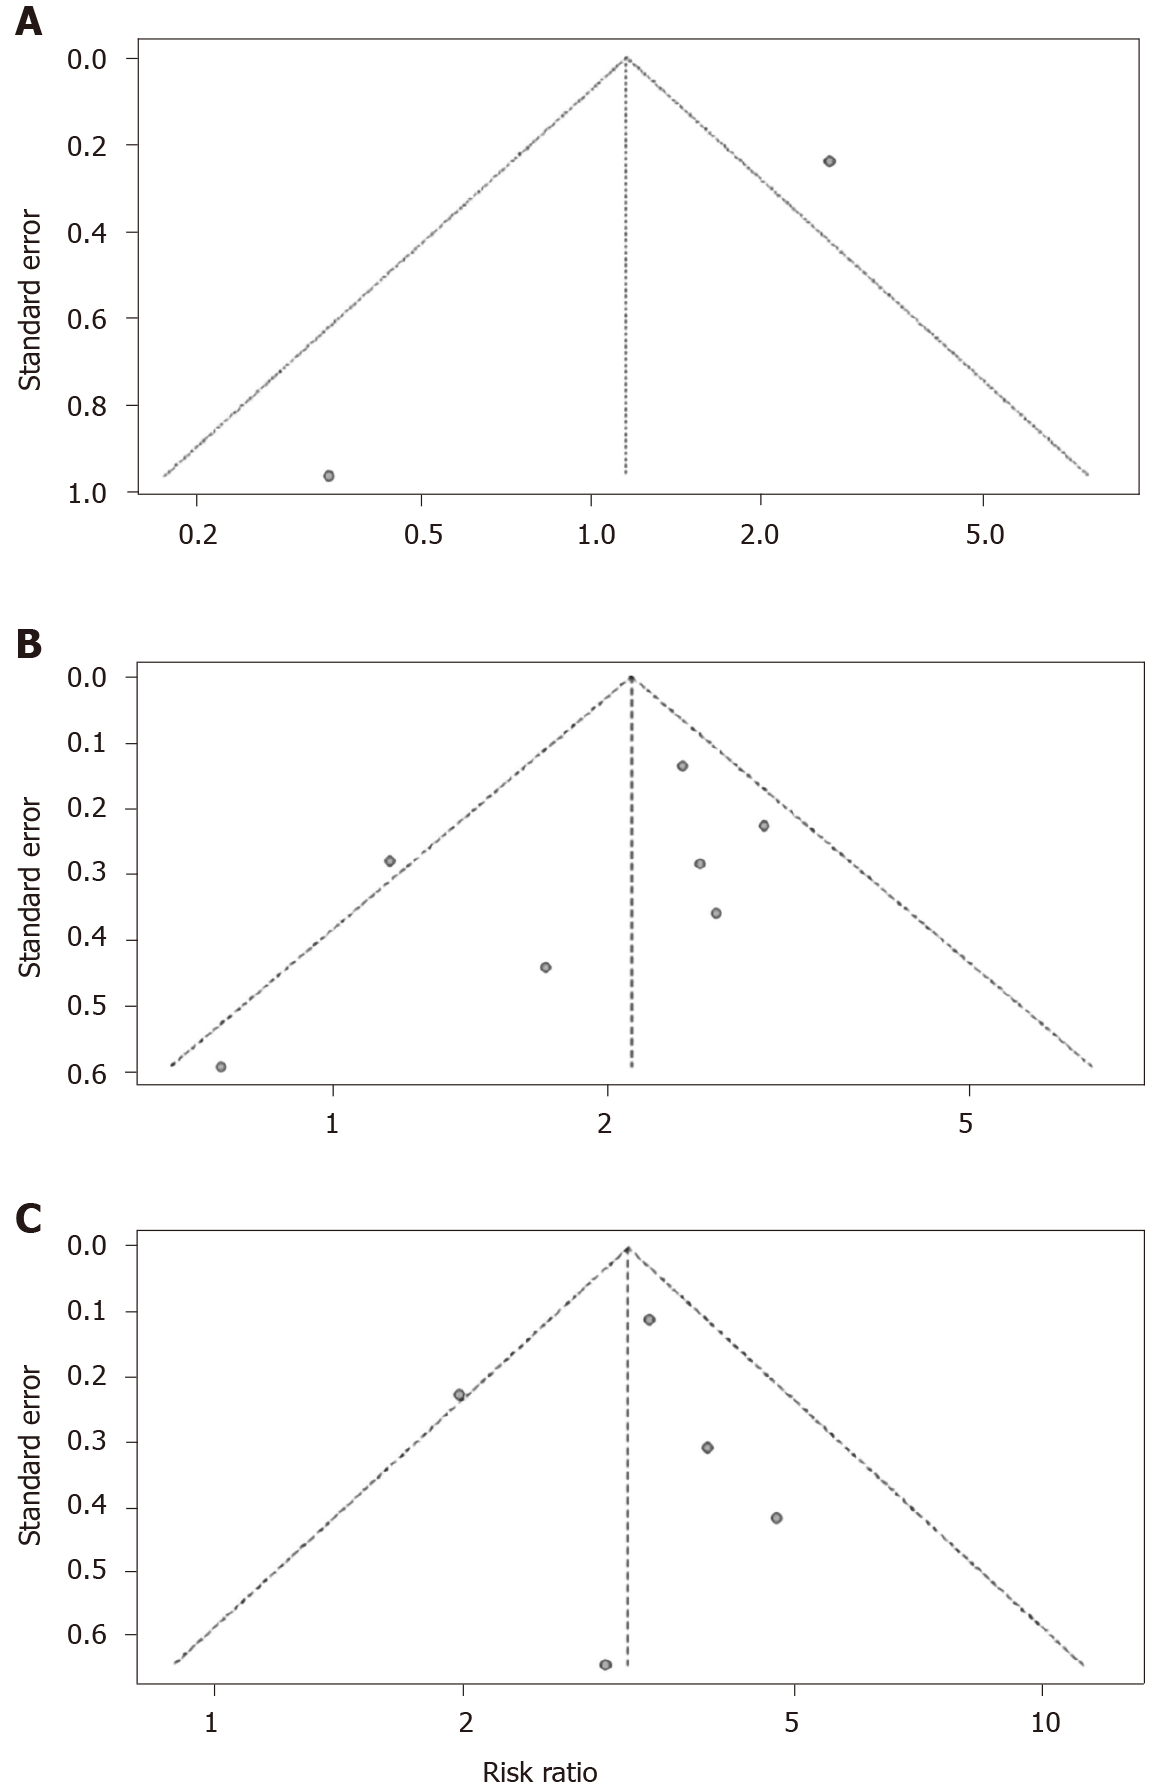
Figure 4 Funnel plots for impact of diabetes on clinical outcomes.
A: Intensive care unit vs non-intensive care unit; B: Severe vs non-severe; and C: Death vs survival.
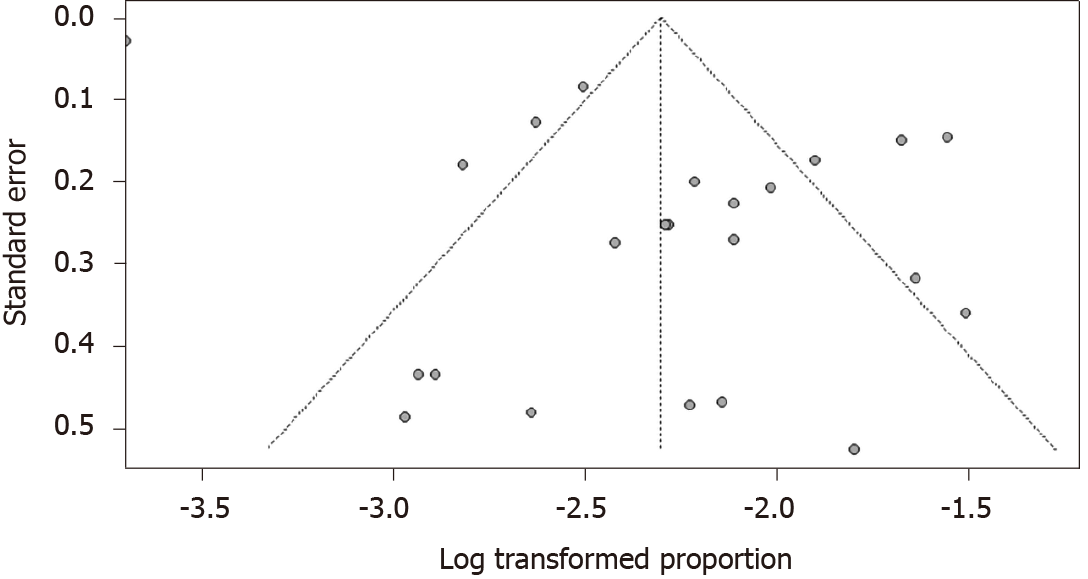
Figure 5 Funnel plot for the prevalence of diabetes in coronavirus disease 2019 cases.
- Citation: Du M, Lin YX, Yan WX, Tao LY, Liu M, Liu J. Prevalence and impact of diabetes in patients with COVID-19 in China. World J Diabetes 2020; 11(10): 468-480
- URL: https://www.wjgnet.com/1948-9358/full/v11/i10/468.htm
- DOI: https://dx.doi.org/10.4239/wjd.v11.i10.468


