Copyright
©The Author(s) 2019.
World J Diabetes. Jun 15, 2019; 10(6): 350-361
Published online Jun 15, 2019. doi: 10.4239/wjd.v10.i6.350
Published online Jun 15, 2019. doi: 10.4239/wjd.v10.i6.350
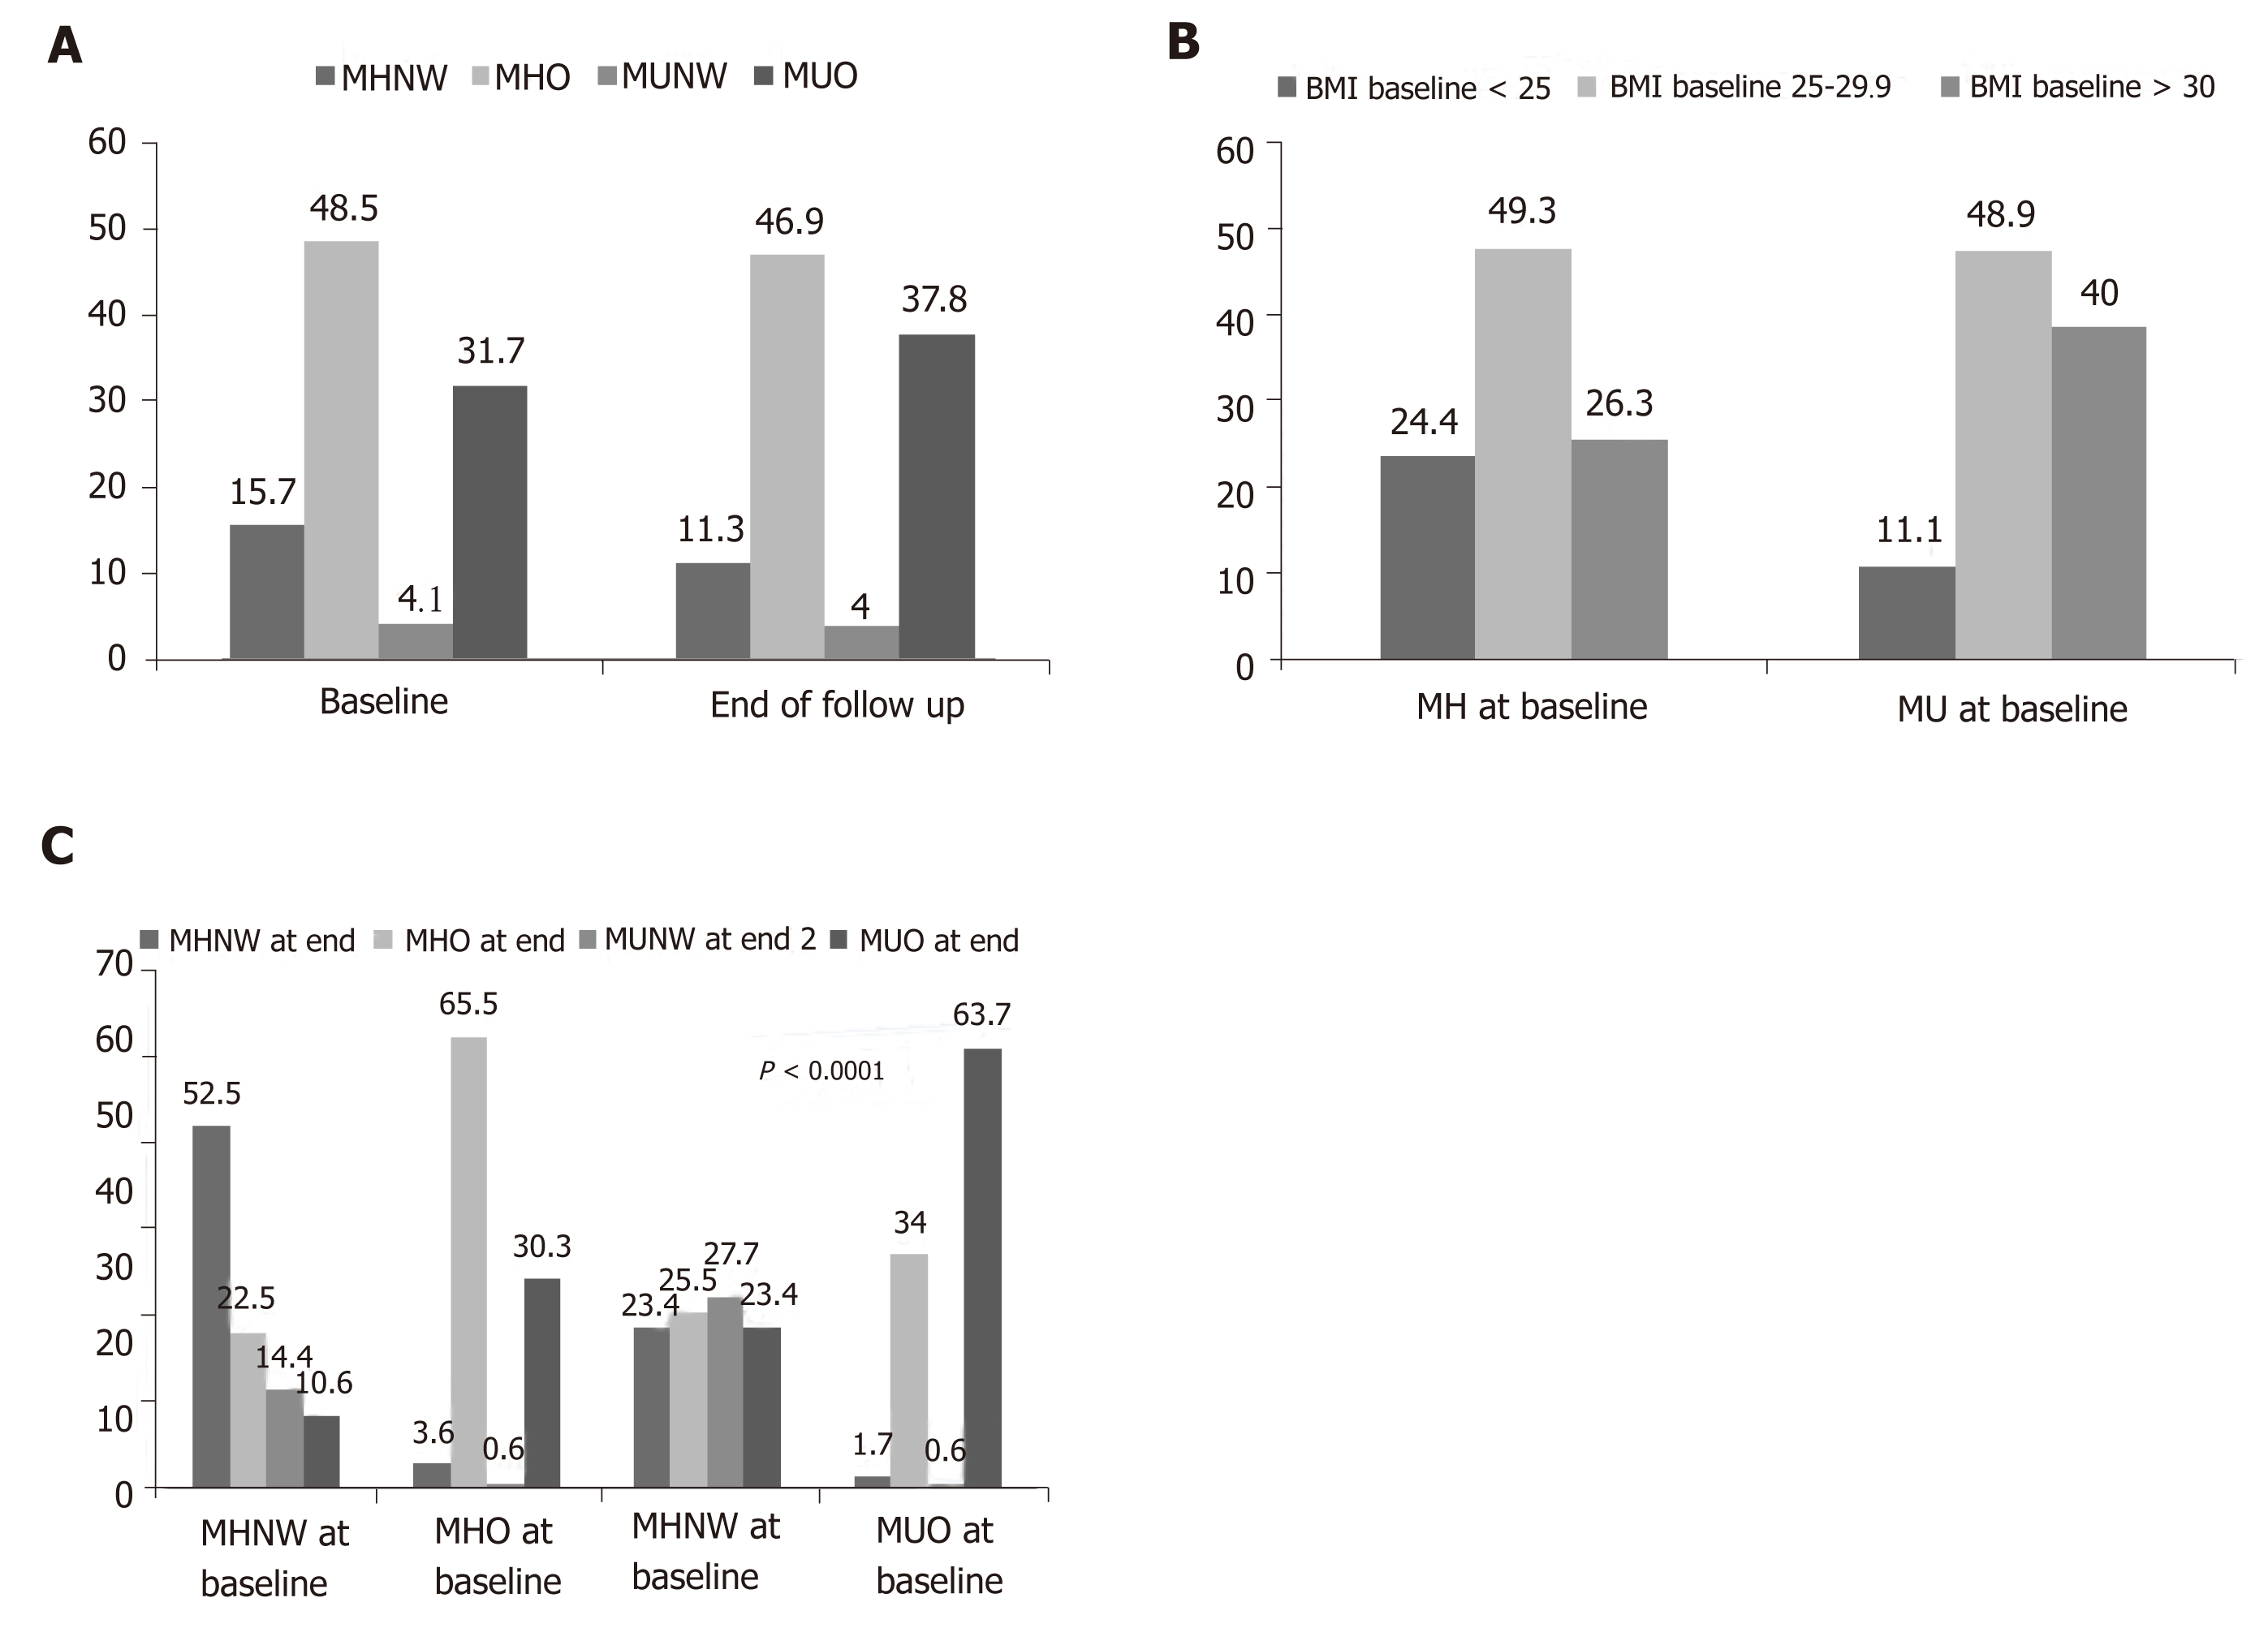
Figure 1 Prevalence of metabolic/obesity phenotypes at baseline and end of study (A), body mass index status at baseline and end of study based on baseline metabolic status (B), and prevalence of different metabolic/obesity phenotypes at the end of study based on baseline metabolic/obesity phenotype (C).
MHNW: Metabolically healthy normal weight; MHO: Metabolically obese; MUNW: Metabolically unhealthy normal weight; MUO: Metabolically unhealthy obese; MH: Metabolically healthy; MU: Metabolically unhealthy.
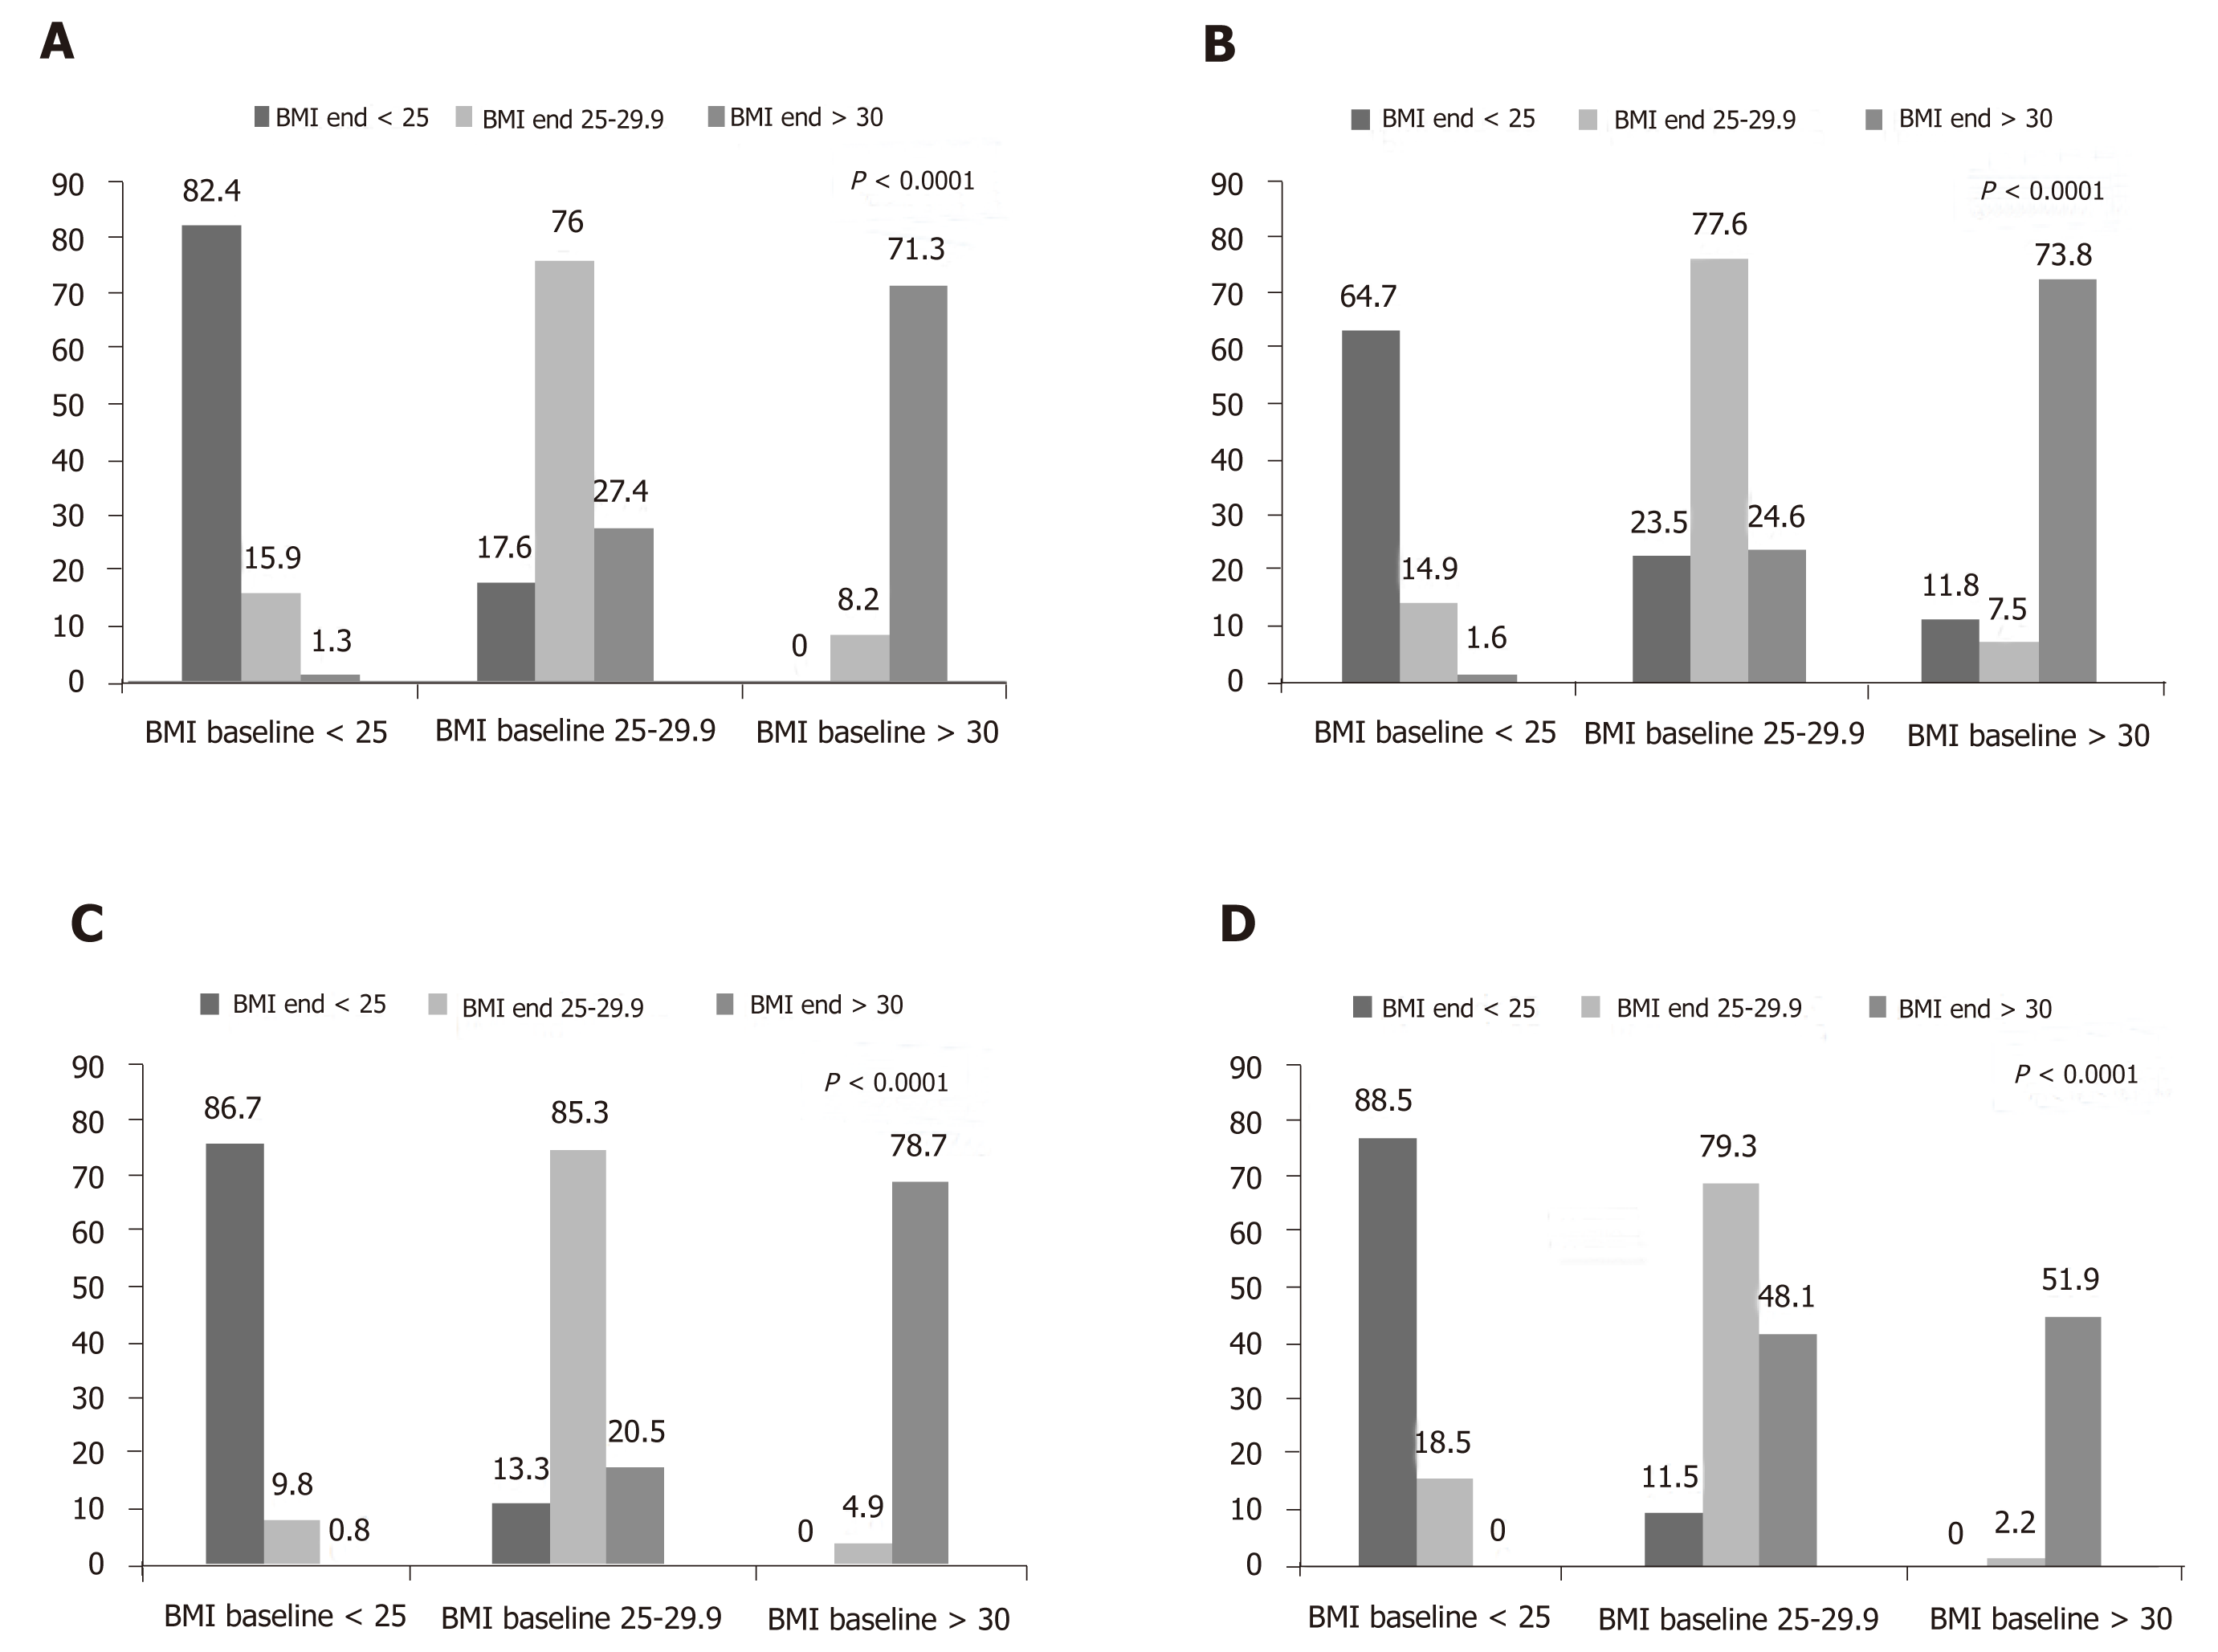
Figure 2 Changing in the prevalence of overweight and obesity based on metabolic health change during the follow-up.
A: Metabolically healthy at both baseline and end; B: Metabolically healthy at baseline and metabolically unhealthy at the end; C: Metabolically unhealthy at baseline and metabolically healthy at the end; and D: Metabolically unhealthy at both baseline and end. BMI: Body mass index.
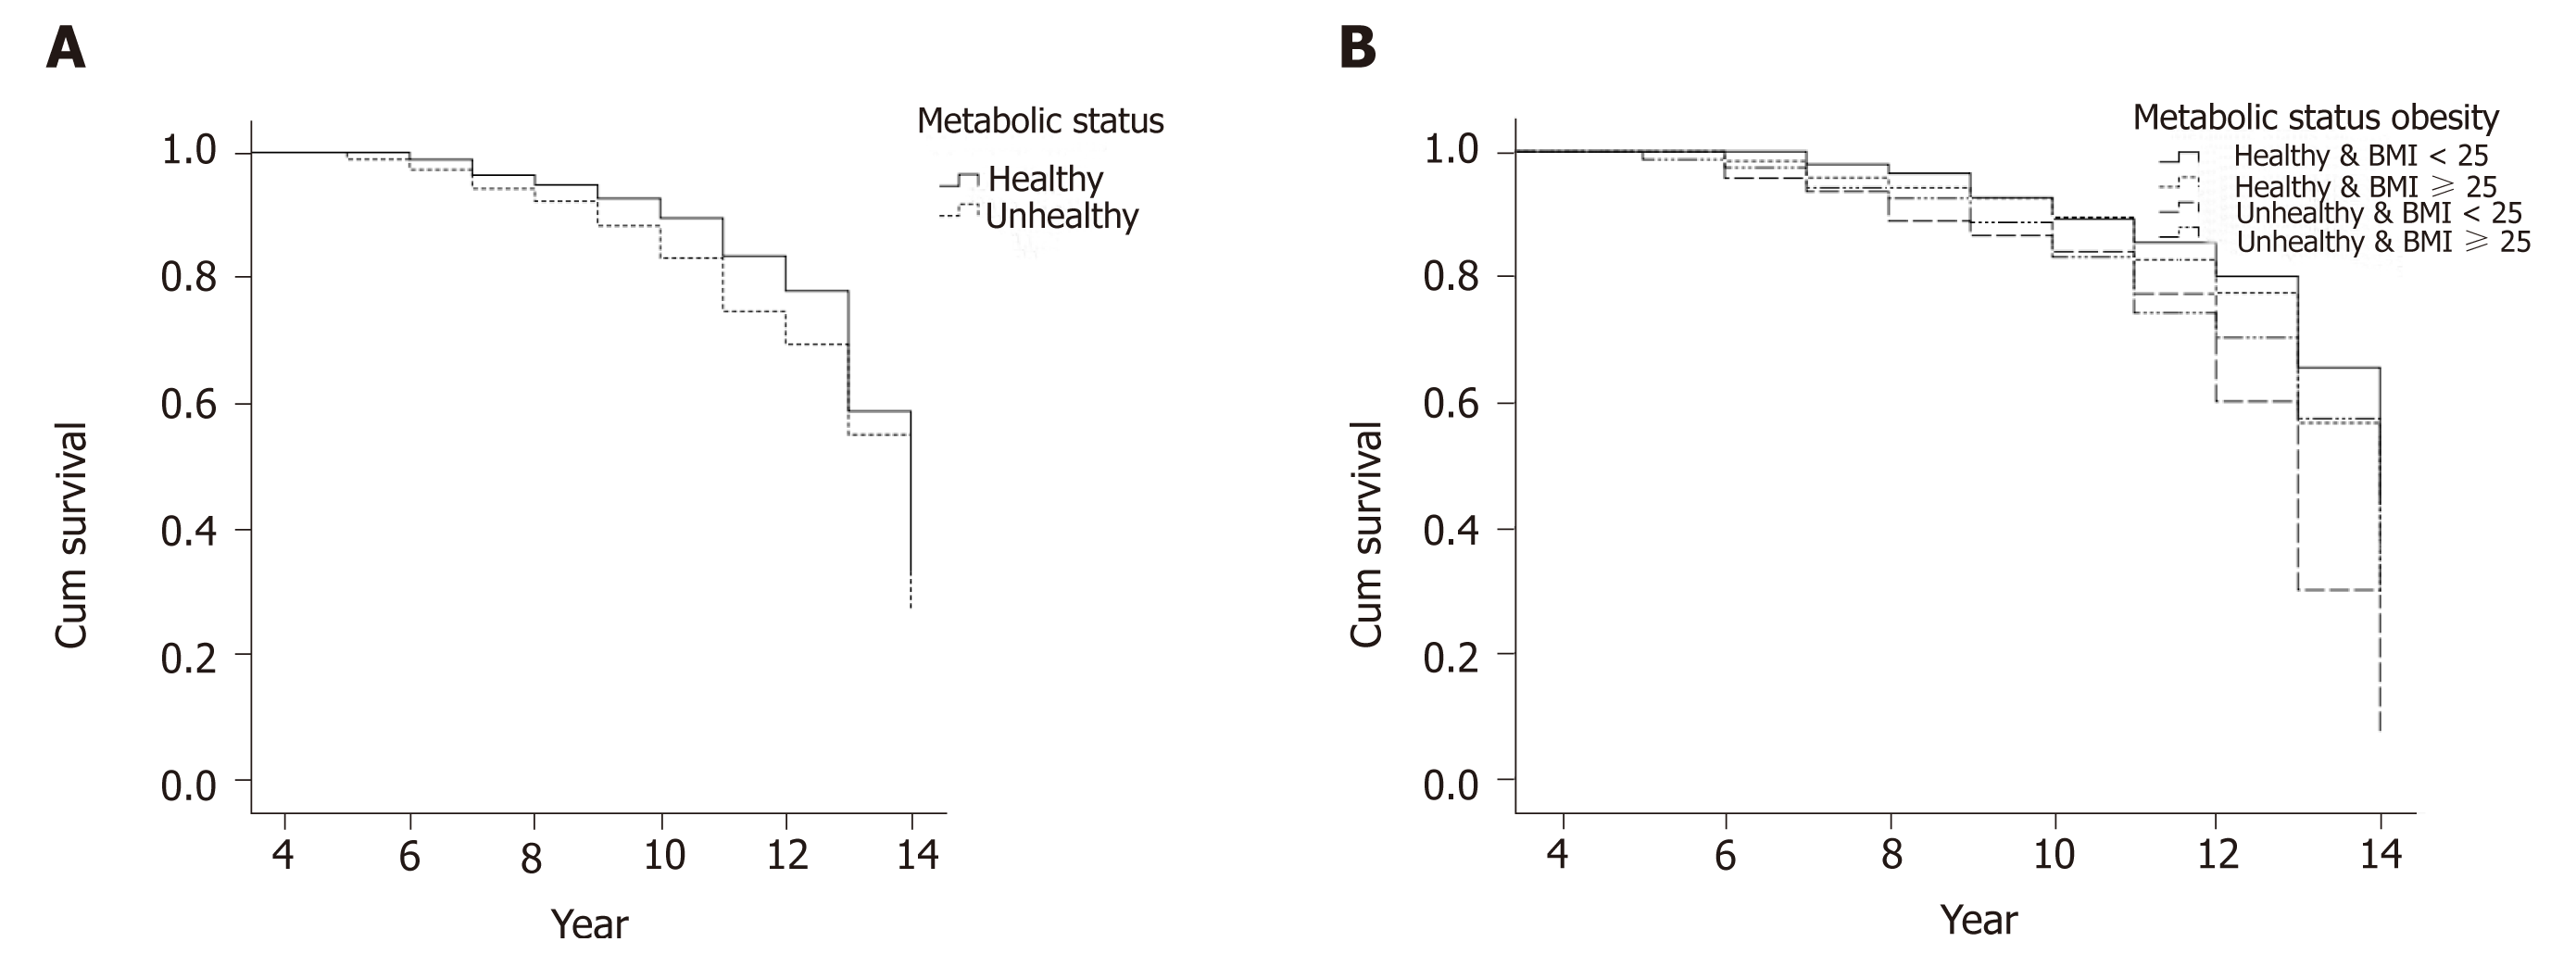
Figure 3 Kaplan-Meier curves.
A: Kaplan-Meier curves comparing the estimated event-rate probability in metabolic healthy and unhealthy patients for prediabetes incidence; B: Kaplan-Meier curves comparing the estimated event-rate probability in metabolically healthy normal weight, metabolically unhealthy normal weight, metabolically unhealthy obese and metabolically unhealthy obese groups for prediabetes incidence. BMI: Body mass index.
- Citation: Haghighatdoost F, Amini M, Aminorroaya A, Abyar M, Feizi A. Different metabolic/obesity phenotypes are differentially associated with development of prediabetes in adults: Results from a 14-year cohort study. World J Diabetes 2019; 10(6): 350-361
- URL: https://www.wjgnet.com/1948-9358/full/v10/i6/350.htm
- DOI: https://dx.doi.org/10.4239/wjd.v10.i6.350


