INTRODUCTION
Liver cancer continues to be a public health problem that threatens the health of people worldwide[1]. Although many advances have been made in the treatment of liver cancer, Despite many advances in the treatment of liver cancer, expectations for an improved prognosis are not yet satisfactory. At the same time, the incidence and mortality rates of liver cancer continue to rise rapidly due to the lack of timely diagnosis and treatment of liver cancer and an ageing population[2]. Data speculate that nearly one million of the world’s population will be affected by liver cancer each year until 2025. Most of the occurrence of liver cancer can be attributed to chronic infection with hepatitis B virus/hepatitis C virus (HBV/HCV)[2]. Hepatocellular carcinoma (HCC) is the most common type of liver cancer, which accounts for approximately 90% of the total number of liver cancer cases[3]. HBV infection has now been shown to be the most significant risk factor for HCC, compared to the lower risk of HCV. Even so, patients with cirrhosis who are free of HCV infection are still the main group of people who develop HCC, and non-alcoholic steatohepatitis is also emerging as a trigger for increased HCC incidence[4]. Early and accurate diagnosis and prevention of liver cancer is more effective than treatment of liver cancer[5].
The global pandemic of coronavirus disease 2019 (COVID-19) in 2019 poses a huge crisis challenge for society in general and healthcare systems in particular[6]. As of 8 June 2023, the cumulative number of COVID-19 cases worldwide has reached 767750853, with a cumulative death toll of 6941095 (https://covid19.who.int/). It is therefore particularly important to explore the mechanisms underlying the occurrence of COVID-19 and to find novel and effective treatments. The main causative agent of COVID-19 is a single-stranded RNA virus called severe acute respiratory syndrome coronavirus-2 (SARS-CoV-2)[7]. These viruses are infectious in humans and can be widely transmitted by invading the body through the movement of respiratory material from close contact, which in turn causes a variety of clinical symptoms[8]. Current clinical reports suggest that the occurrence of COVID-19 can affect the function of multiple organs and systems, manifested by respiratory symptoms such as fever, cough, and sputum, as well as non-respiratory symptoms such as fatigue, headache, and myalgia[9-11]. The clinical features of the disease are age-specific, with older people over 65 years of age with other co-morbidities often having severe respiratory symptoms requiring hospitalization, while younger people and children have mild non-pneumonia or pneumonia symptoms and pregnant women are less likely to have the disease[12,13]. Liver damage from COVID-19 has also been reported, with abnormal changes in indicators of liver damage such as aspartate aminotransferase, alanine aminotransferase, alkaline phosphatase and bilirubin in patients with COVID-19[14,15].
Patients with cancer, who are immunosuppressed or in an immunocompromised state due to the need to undergo chemotherapy or undergo surgery, are considered to be a group vulnerable and capable of developing severe COVID-19. Mortality rates are higher in patients with COVID-19 cancer than in non-cancer patients and are correlated with age and severity of co-morbidities[16]. The development of most liver cancers is usually closely associated with HBV infection and cirrhosis, suggesting that the risk of developing severe COVID-19 is substantially higher when the body’s immunity is compromised[17]. By looking at the available clinical data, it was found that COVID-19 may exacerbate the development of primary liver disease, which in turn may influence the progression of liver cancer and the management of interventions[18]. A report from China showed that 7% of HCC patients included in 28 cancer patients infected with COVID-19 were observed to have adverse outcomes during 14 d of anticancer treatment, although this report had too few study subjects with liver cancer[19]. Zhang et al[19] reported a multicenter study including 670 liver cancer patients with exposure to SARS-CoV-2 of 293 and 377 not exposed to SARS-CoV-2. Of these patients, 13.1% changed their treatment strategy, patients in 2020 had a significant delay in treatment of > 1 mo compared to the previous year (P < 0.001), and approximately 7.1% of patients with liver cancer were diagnosed with active COVID-19 infection. In addition, a study of 42 patients with liver cancer reported a delay in treatment of no less than 2 mo in 26% of patients with liver cancer during the COVID-19 period[20].
In conclusion, there are multiple uncertainties regarding the relationship between COVID-19 and liver cancer. COVID-19 appears to influence the outcome of patients with liver cancer, but can COVID-19 advance the progression of liver cancer? Can liver cancer exacerbate the serious risk of COVID-19? These remain open questions for us. To further explore the mechanistic link between COVID-19 and liver cancer, we conducted this dual disease combination analysis of COVID-19 and liver cancer, aiming to explore common targets and acting signaling pathways that can affect both diseases and give new meaning to their treatment.
MATERIALS AND METHODS
Datasets preparation
The NCBI Gene Expression Omnibus is a public repository of high-throughput experimental data related to a variety of diseases and is publicly available free of charge. GSE180226 dataset contains 20 COVID-19 samples and 3 non-COVID-19 samples and is based on Agilent-014850 whole human genome microarray chip sequencing technology. The GSE87630 dataset and the GSE113996 dataset are both liver cancer mRNA expression sequencing datasets. The GSE87630 dataset contains 64 HCC samples and 30 normal liver tissue samples using high-throughput sequencing technology based on the Illumina HumanHT-12 V3.0 expression beadchip platform. The GSE113996 dataset shows the expression profiles of 20 pairs of liver cancer and adjacent normal tissues based on the GeneChip® PrimeView™ human gene expression array platform.
Identification of differentially expressed genes shared by COVID-19 and liver cancer
Perl, a feature-rich computer programming language, is a free and efficient scripting language program, and RStudio, an integrated development environment for the R language, features easy programming and powerful matrix operations that integrate many powerful programming tools into an intuitive, easy-to-learn interface. In this study, we used Perl and RStudio to identify differentially expressed genes (DEGs) in the GSE180226 and GSE87630 datasets respectively, defining DEGs as those with adjusted P values < 0.05 and log2FC > 1.0. The shared DEGs between the GSE180226 dataset and the GSE87630 dataset is obtained through the R language package “VennDiagram”.
Gene Ontology and Kyoto Encyclopedia of Genes and Genomes enrichment analysis
Gene Ontology (GO) is a database created by the Gene Ontology Consortium, which aims to create a database of gene and protein functions qualified and described for a wide range of species, and which can be divided into three main categories: Molecular functions (MF), biological processes (BP) and cytological components (CC). Kyoto Encyclopedia of Genes and Genomes (KEGG) is a comprehensive database integrating genomic, chemical, and phylogenetic functional information, with the KEGG pathway specifically storing information on gene pathways in different species. We performed GO/KEGG enrichment analysis of common DEGs in COVID-19 and liver cancer respectively through RStudio, and followed up with GO functional annotation and KEGG pathway enrichment analysis of shared hub genes in both diseases.
Construction of protein-protein interaction network
Search for interaction genes through the online data platform STRING (http://string-db.org). STRING is a database for the study of protein interactions and is a database for the study of protein interactions with information on over 14000 species, over 60 million proteins, and over 20 billion interactions. including direct physical interactions and indirect functional interactions. Protein-protein interaction (PPI) interaction networks for shared DEGs of COVID-19 and liver cancer were constructed from the STRING database, with interaction scores > 0.7. selected. To visualize the PPI network using Cytoscape software (version 3.9.0), we applied the Cystoscope-MODE plugin with the following parameter settings: Degree cutoff = 2, max depth = 100, node score cutoff = 0.2, and K-core = 2.
Identification of hub genes and differential expression analysis in COVID-19 and liver cancer
DEGs were selected via Cytoscape’s plugin cytoHubba and then the final hub genes were identified and visualised using seven algorithms (Closeness, MCC, Degree, MNC, Radiality, Stress, and EPC). geneMANIA (http://genemania.org) is online that can predict gene interactions database, which was used to construct a co-expression network of identified hub genes. The screened hub genes were subsequently subjected to GO annotation and KEGG enrichment analysis by RStudio. Differential expression of the screened hub genes in COVID-19 dataset (GSE180226) and liver cancer dataset (GSE113996) was verified by Rstudio separately and the expression results were visualized as violin plots.
Construction and analysis of the transcription factor-hub gene regulatory network
Transcription factors (TFs) interacting with hub genes were predicted using the online database TRUST (https://grnpedia.org/trust/), and a TF-hub gene regulatory network was built using Cytoscape. Rstudio was used to predict TFs expression differences in the GSE87630 dataset, and the results are presented as violin plots.
Cell culture
Human normal hepatocytes L-O2 and human liver cancer cell lines SMMC-7721, HUh7, H-97 were purchased from the Chinese Academy of Sciences Cell Resource Centre and kept in the central laboratory of Gansu Provincial People’s Hospital. The cells were cultured in RPMI-1640 containing 10% fetal bovine serum, 1% double antibodies (streptomycin and penicillin) in a humidified 5% CO2 incubator at 37 °C.
RNA isolation and quantitative reverse transcriptase polymerase chain reaction
RNA was extracted according to the instructions of the M5 Universal RNA Mini Kit. To determine the RNA concentration and purity in accordance with the experimental requirements, absorbance values were measured at 260 nm and 280 nm. RNA was reverse transcribed to cDNA according to the instructions of M5 Sprint qPCR RT Kit with gDNA Remover Reverse Transcription Kit. 2 × M5 HiPer SYBR Premix EsTaq (with Tli RnaseH) was used as a fluorescent dye for quantitative reverse transcriptase polymerase chain reaction (qRT-PCR) assay. The primers for the selected pivotal genes were designed and synthesized by Bioengineering (Shanghai) Co. Details of the sequences used are given in Supplementary Table 1. The mRNA expression levels of all genes were calculated and analysed using the 2-ΔΔCt formula.
RESULTS
Identification of DEGs and shared genes in COVID-19 and liver cancer
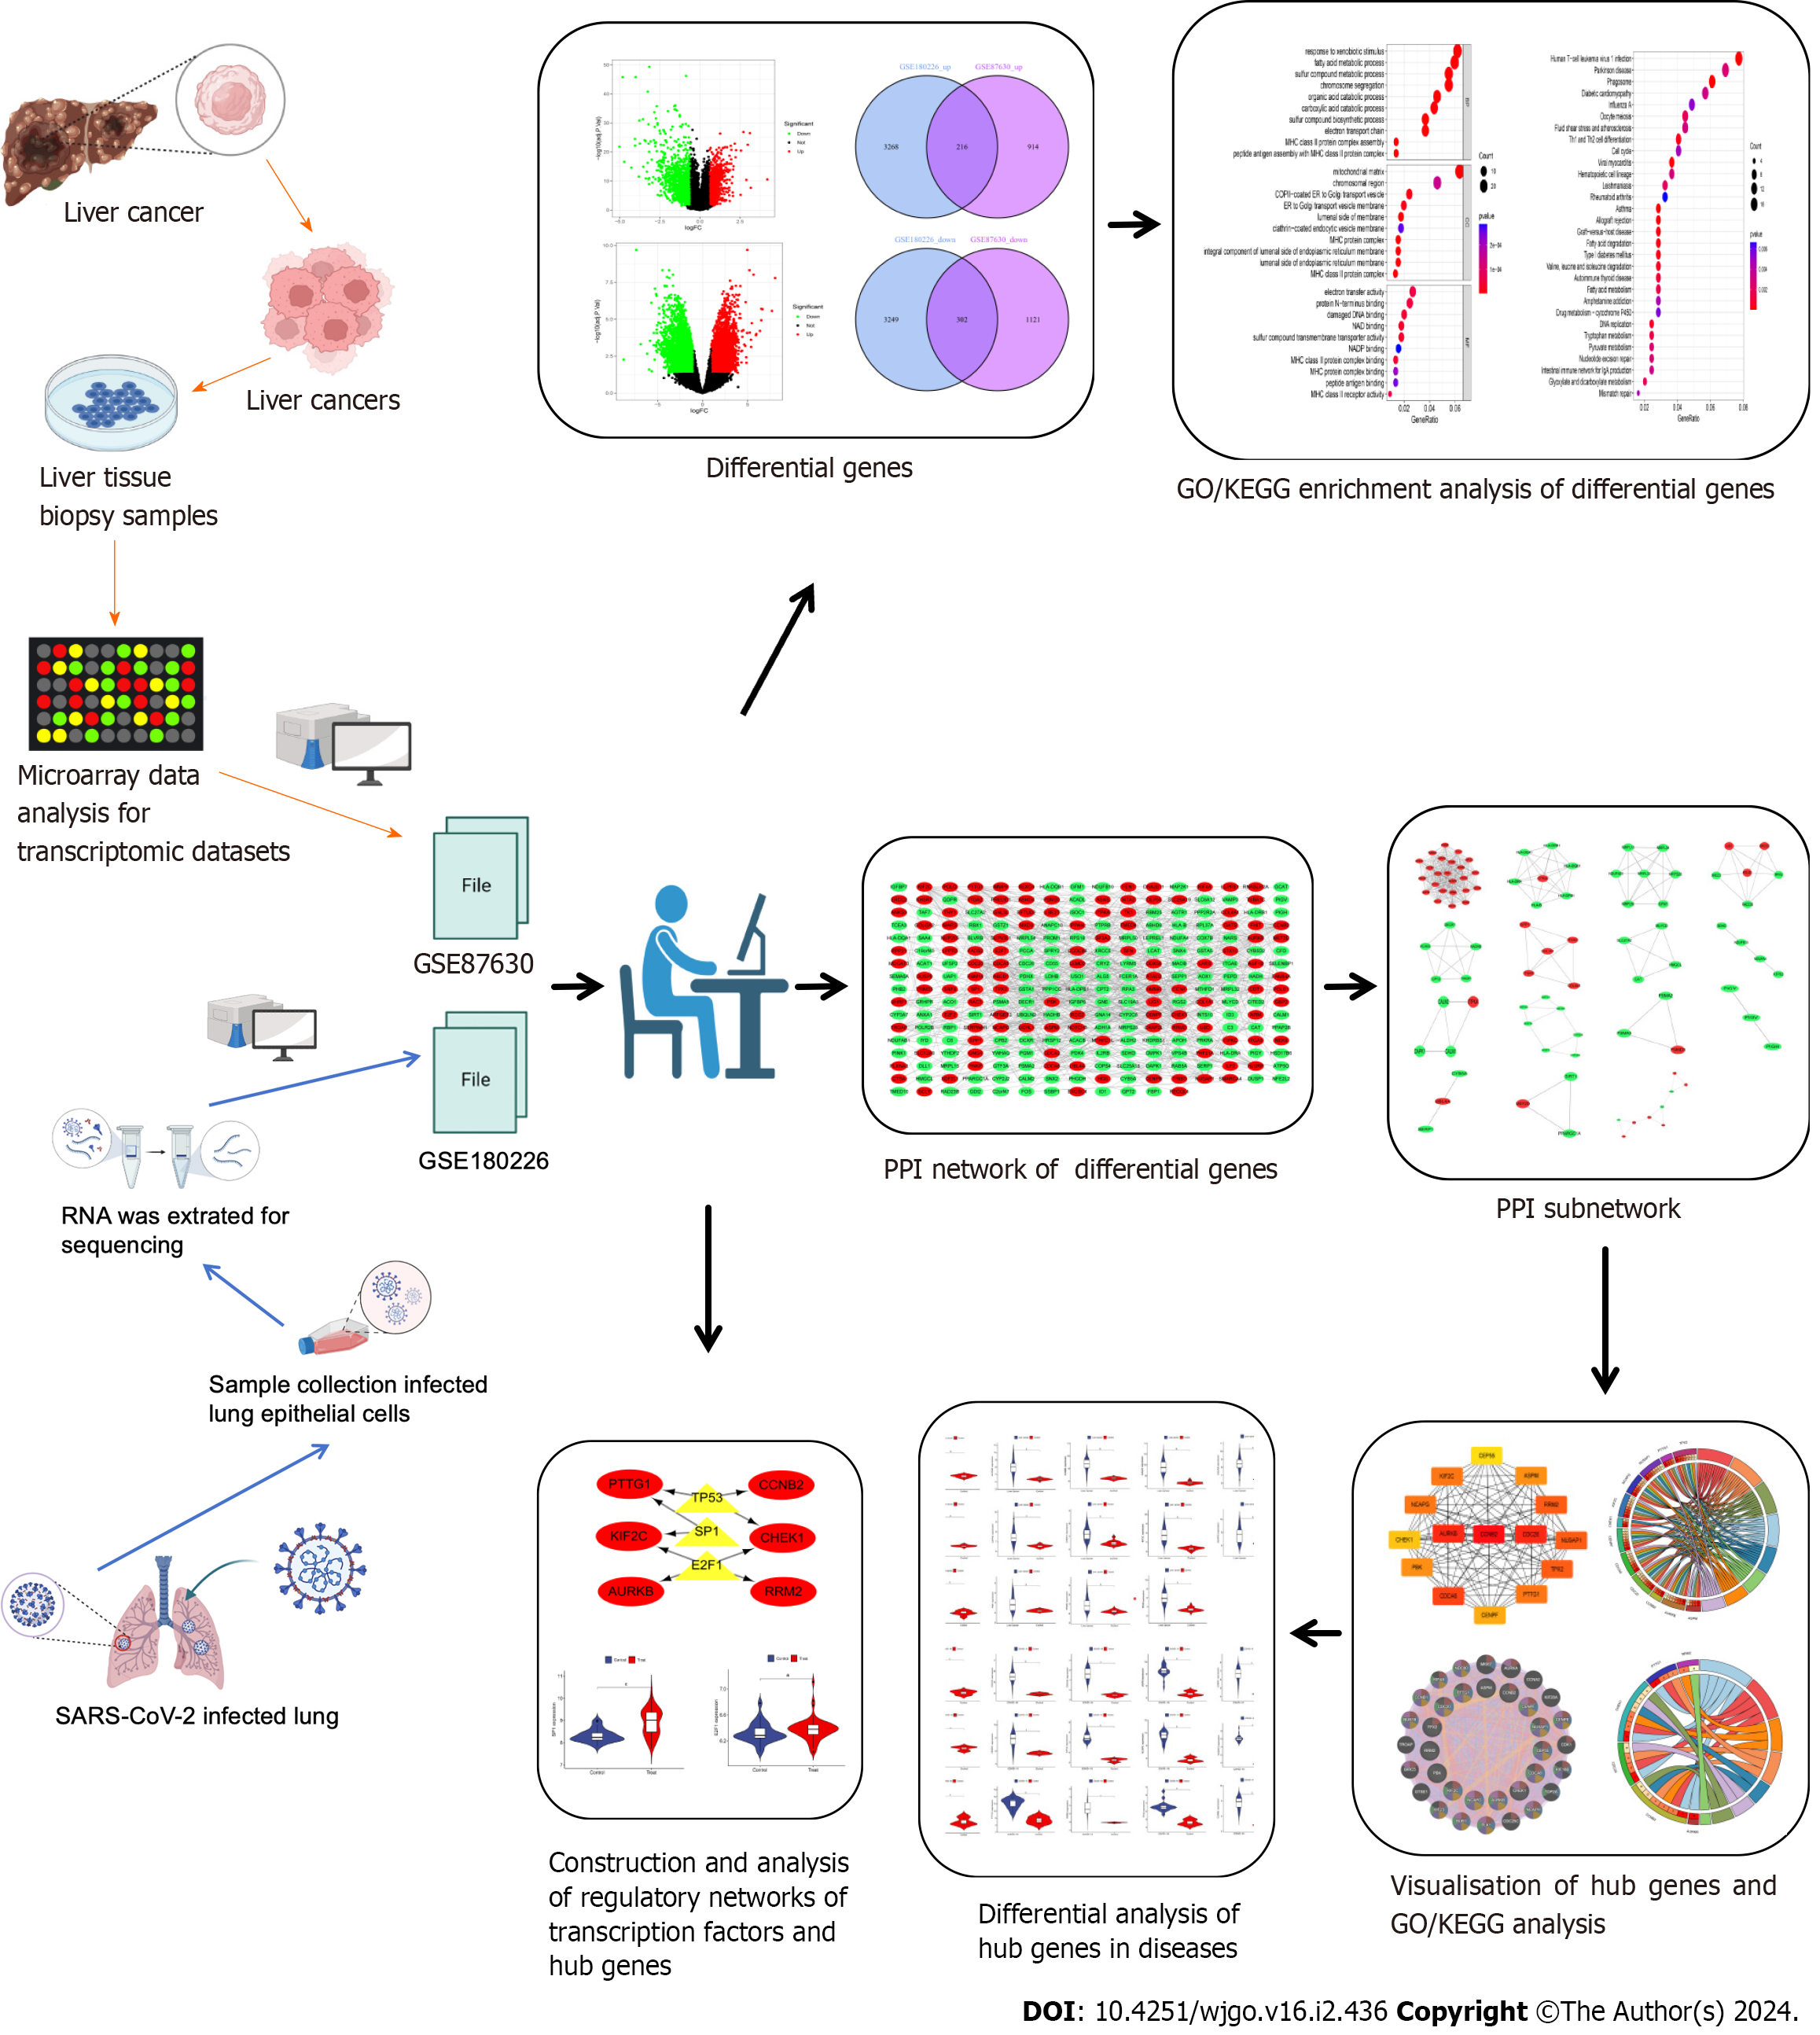
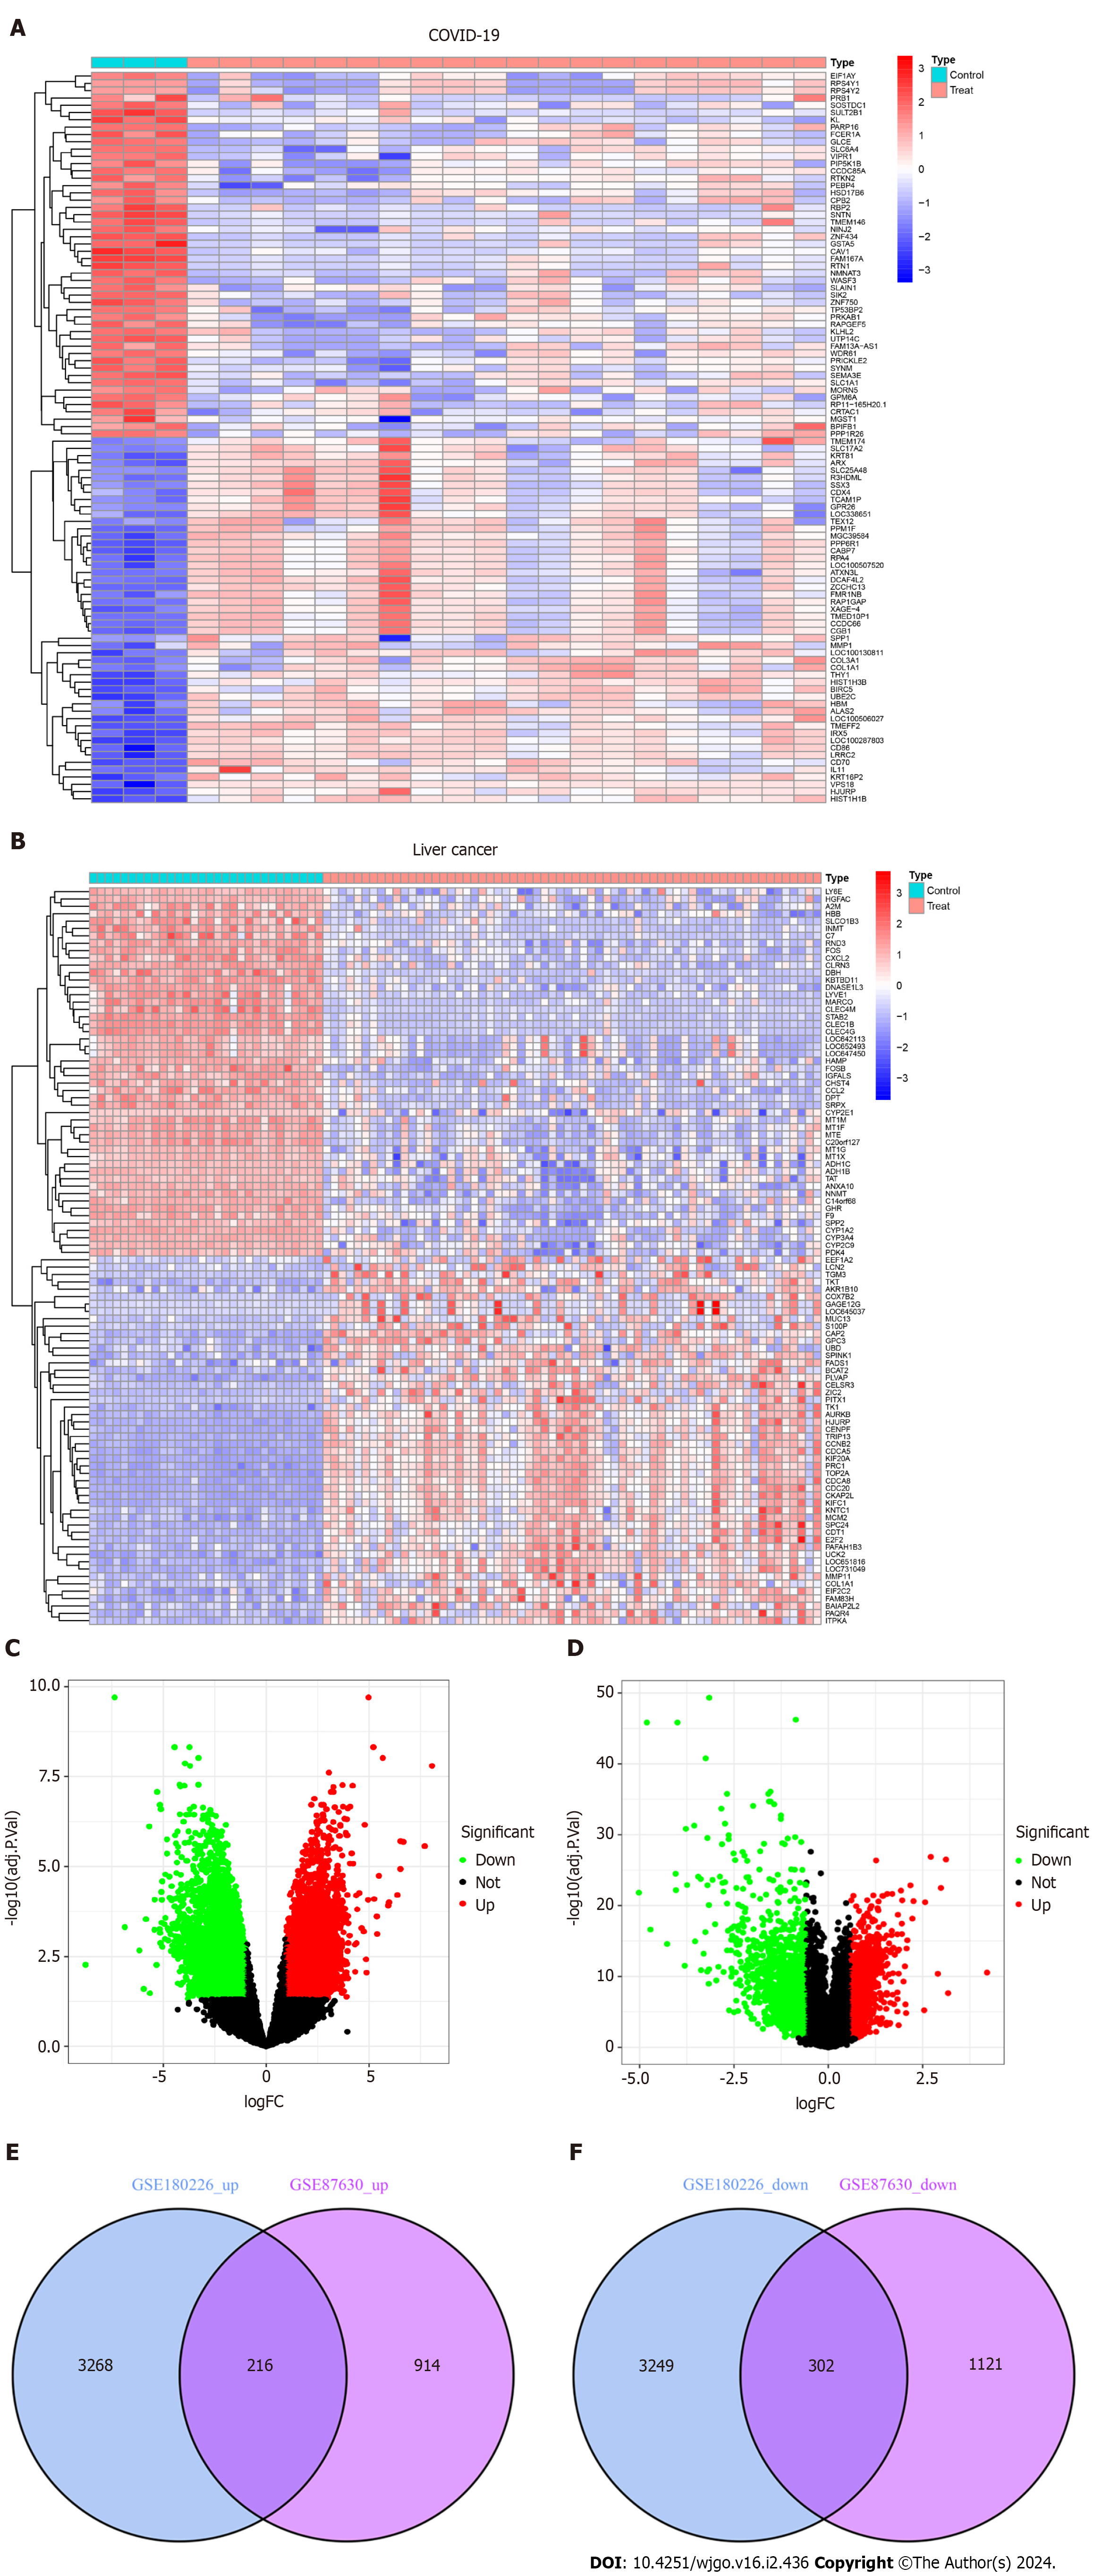
As shown in the flow chart (Figure 1), we used a Perl script to identify DEGs for the COVID-19 dataset GSE180226 and obtained a total of 7035 differential genes, of which 3484 were up-regulated DEGs and 3551 were down-regulated (Figure 2A). A total of 2553 DEGs were obtained from the identification of the dataset GSE87630 for liver cancer, of which 1130 were up-regulated DEGs and 1423 were down-regulated DEGs (Figure 2B). In addition, the DEGs of COVID-19 and liver cancer were clustered and visualized separately to obtain heat maps (Figures 2C and D). By obtaining the intersection of DEGs from the GSE180226 dataset and the GSE87630 dataset, 216 up-regulated shared DEGs and 302 down-regulated shared DEGs were obtained, which were visualized by Venn diagram (Figures 2E and F).
Figure 1 The predominant methodical workflow in the current study.
GO: Gene Ontology; KEGG: Kyoto Encyclopedia of Genes and Genomes; SARS-CoV-2: Severe acute respiratory syndrome coronavirus-2; PPI: Protein–protein interaction.
Figure 2 Volcanic diagram, heat map and Venn diagram.
A: Volcano map of GSE180226; B: Volcano map of GSE87630. Up-regulated genes are colored in red; down-regulated genes are colored in green; C: Cluster analysis of GSE180226; D: Cluster analysis of GSE87630; E: Two datasets showed 216 up-regulated shared differentially expressed genes (DEGs); F: Two datasets showed 302 down-regulated shared DEGs. COVID-19: Coronavirus disease 2019.
GO functional annotation and KEGG pathway enrichment analysis
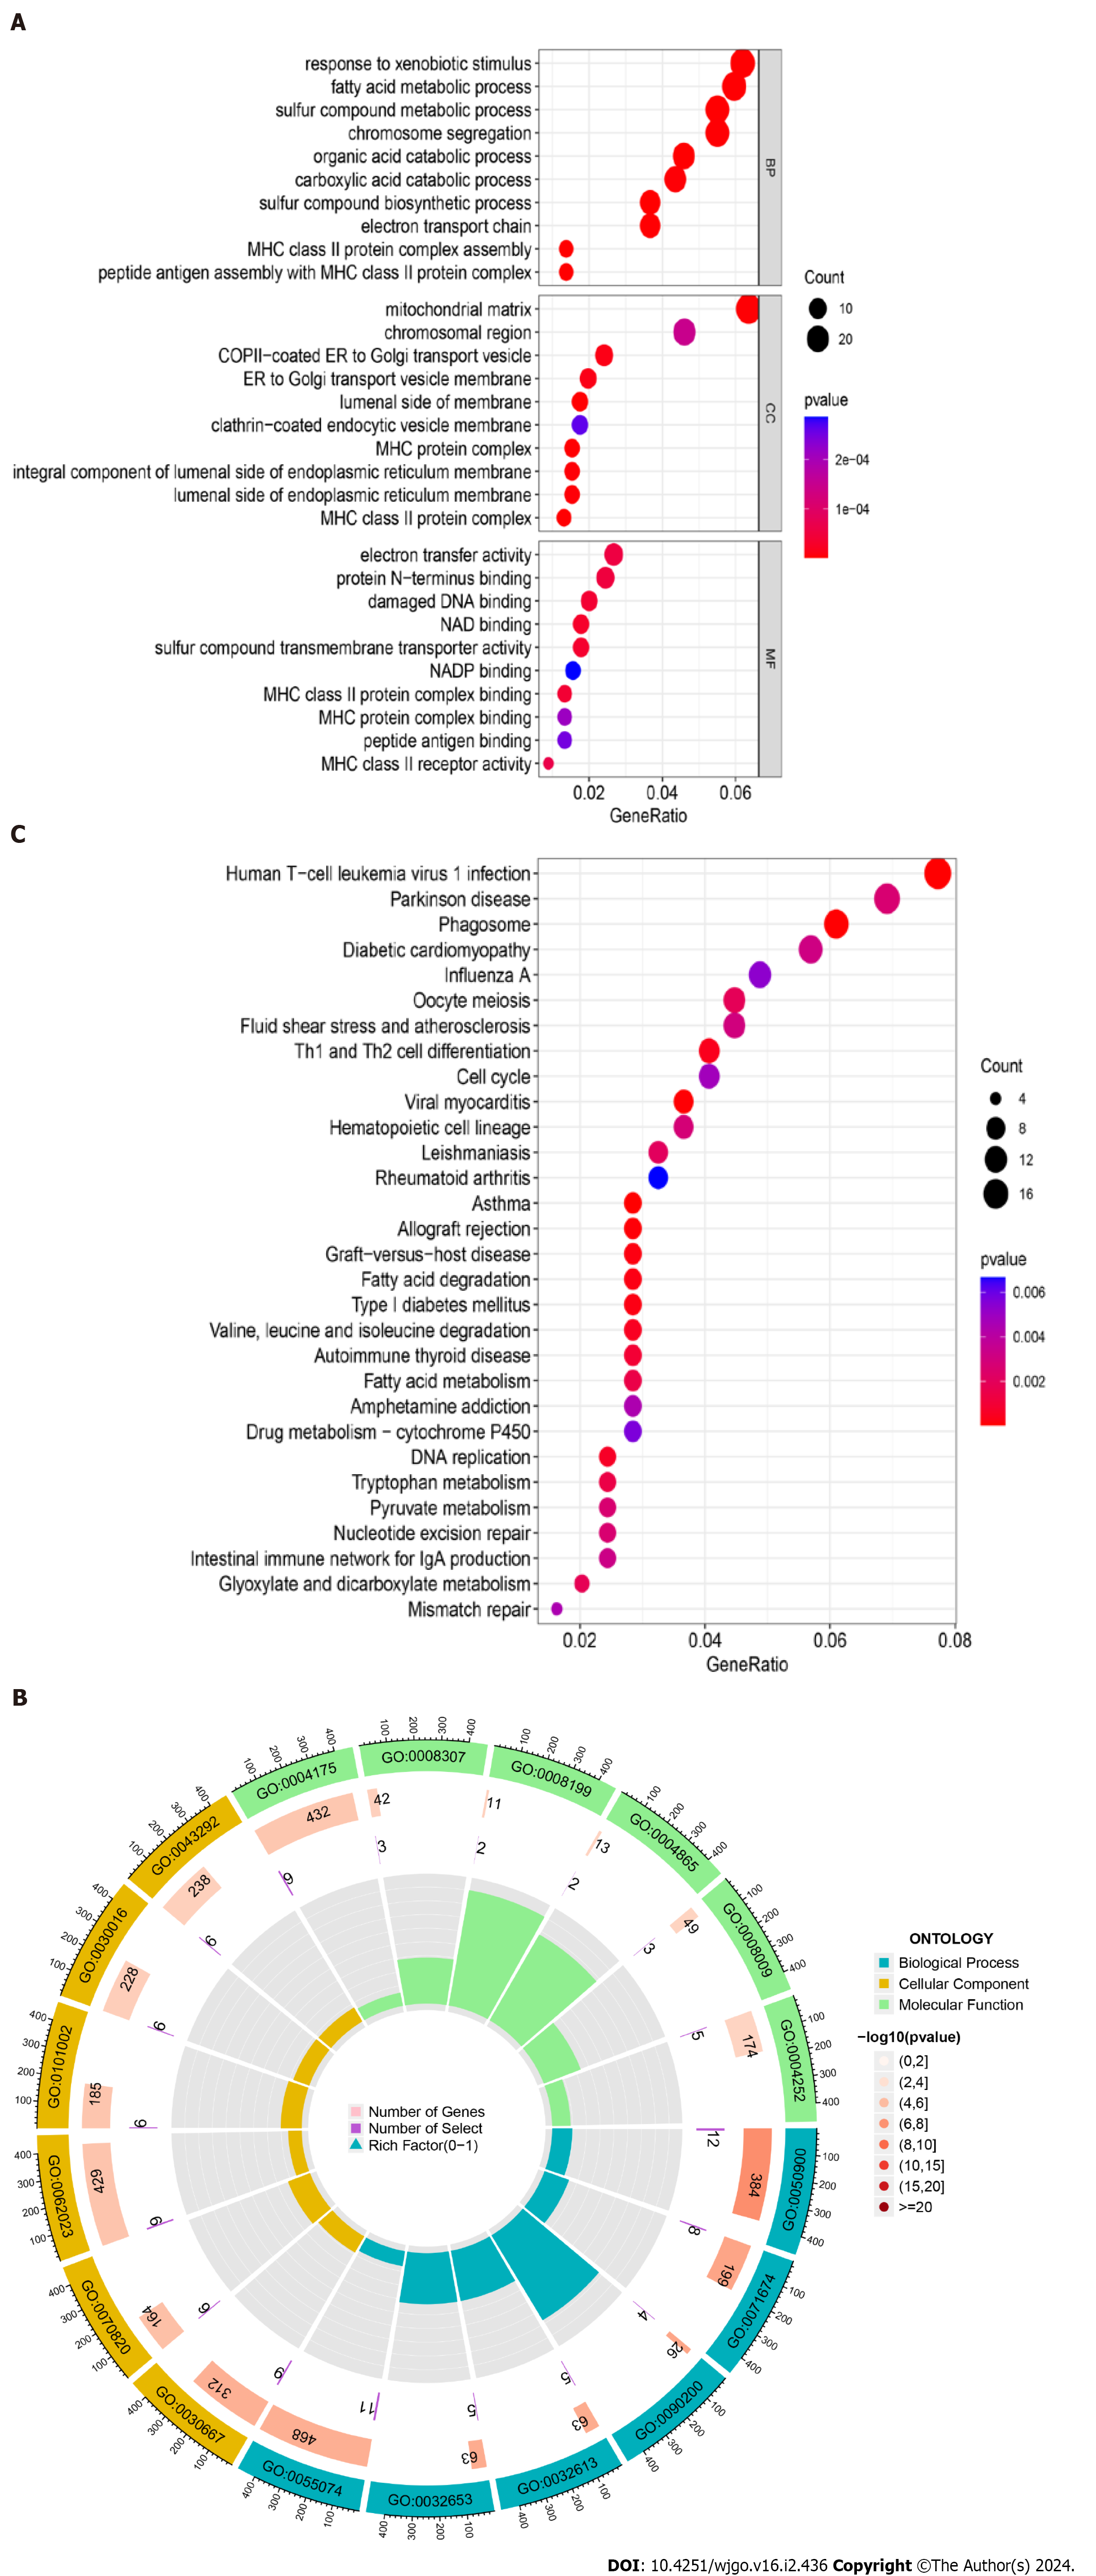
The bubble plots of GO enrichment analysis (BP, CC, MF) of DEGs in COVID-19 and liver cancer showed that the top 5 important functional components were mitochondrial matrix, response to xenobiotic stimulus, fatty acid metabolic process, sulfur compound metabolic process, chromosome segregation (Figure 3A). We then plotted the GO enrichment analysis circles using a perl script, where blue represents BP, yellow represents CC, green represents MF, and red represents the degree of variation in the enrichment of DEGs for a particular function, with the darker the red being the more significant variation. The results showed that DEGs were mainly enriched in BP related functions (n = 468) (Figure 3B). For the KEGG pathway enrichment analysis, the top five important signalling pathways were Human T-cell leukemia virus 1 infection, Parkinson disease, Phagosome, Diabetic cardiomyopathy, and Oocyte meiosis (Figure 3C).
Figure 3 Gene Ontology functional annotation and Kyoto Encyclopedia of Genes and Genomes pathway enrichment analysis of shared differentially expressed genes from two datasets.
A: Annotated bubble chart of Gene Ontology (GO) functions for shared differentially expressed genes (DEGs); B: Annotated circle diagram of the GO function for shared DEGs; C: Bubble plot of the Kyoto Encyclopedia of Genes and Genomes pathway enrichment analysis for shared DEGs.
DEGs PPI network analysis and sub-module analysis
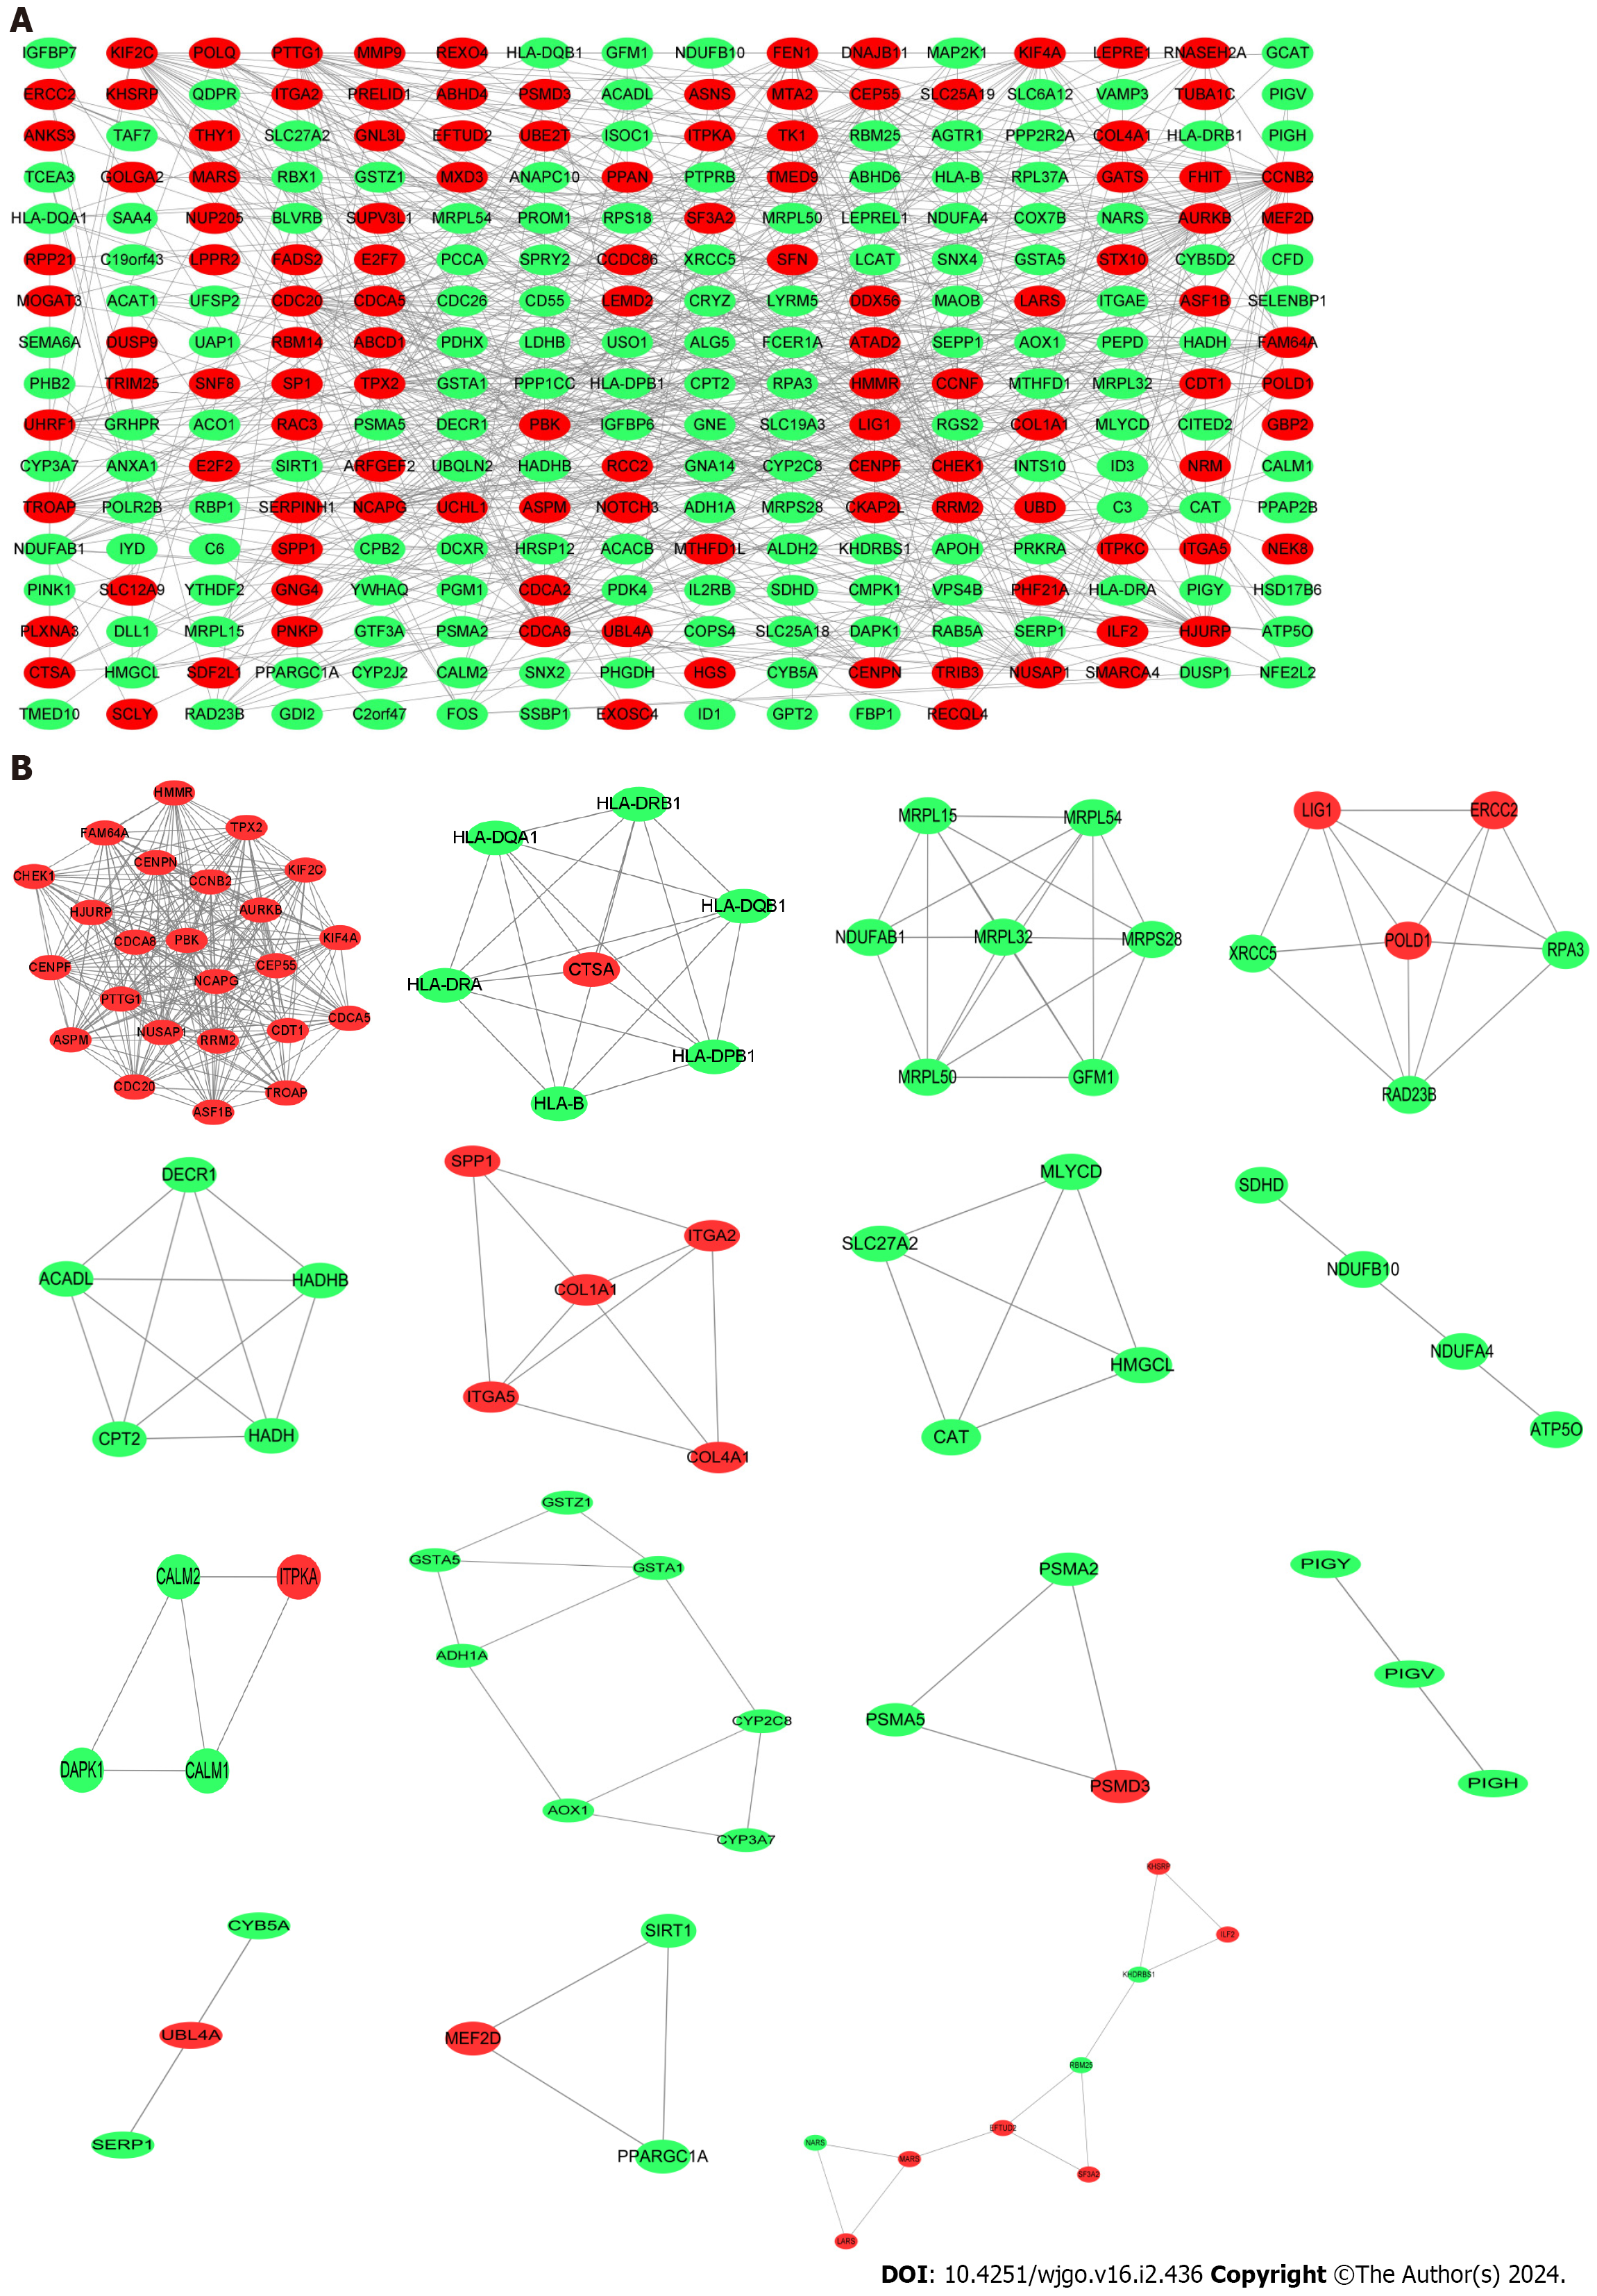
The PPI network of shared DEGs for COVID-19 and liver cancer was obtained through the String platform, with the chosen Conditions of high confidence (0.700). The PPI network was visualized by Cytoscape software, which included 268 nodes with 731 edges, with red nodes representing up-regulated shared DEGs and green nodes representing down-regulated shared DEGs (Figure 4A). Along this line, we applied the Cystoscope-MODE plug-in and, after selecting the qualifying conditions, obtained the corresponding 15 sub-networks of shared DEGs, with the DEGs in each sub-network being closely related to each other (Figure 4B).
Figure 4 Protein–protein interaction network construction.
A: Protein–protein interaction network of shared differentially expressed genes (DEGs) for coronavirus disease 2019 and liver cancer; B: Subnetworks of shared DEGs. Highlighted red nodes indicate up-regulated DEGs and green nodes indicate down-regulated DEGs.
Identification and functional analysis of hub genes
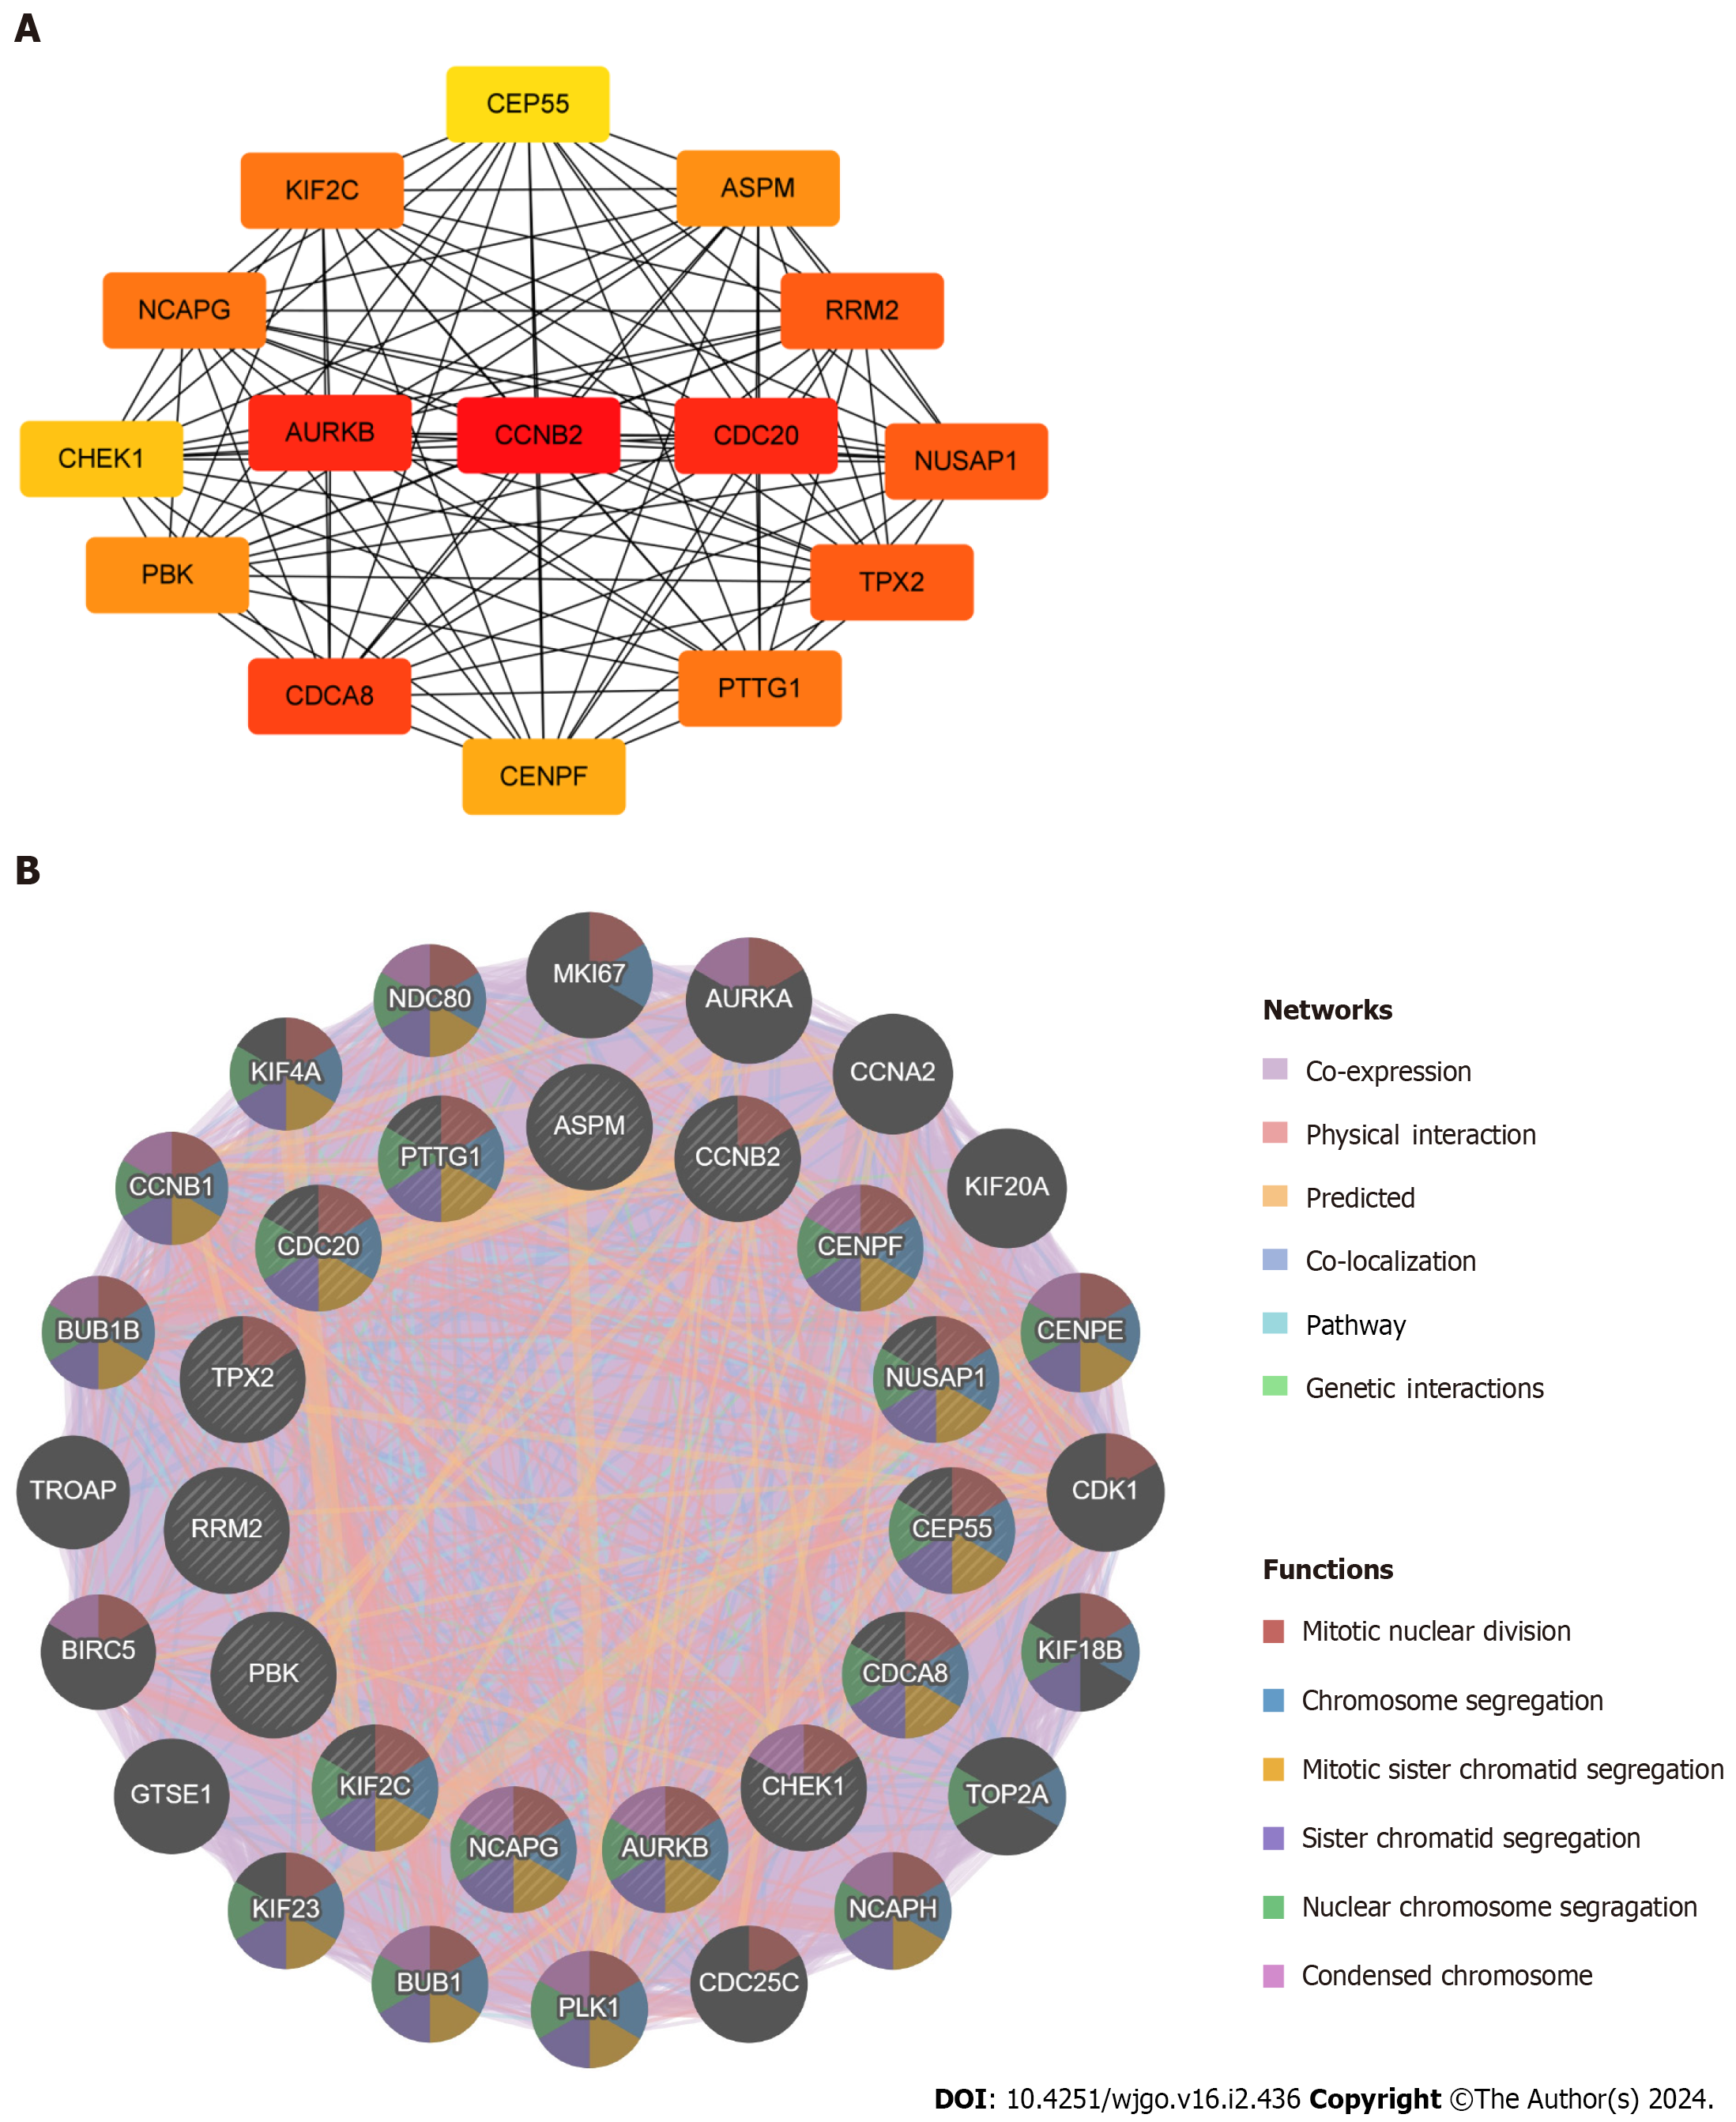
By applying the cytoHubba plugin in Cytoscape, Degree was selected for scoring, and in turn, the top 15 ranked hub genes were filtered out, including PDZ binding kinase (PBK), targeting protein for xklp2 (TPX2), aurora kinase B (AURKB), non-SMC condensin I complex subunit G (NCAPG), kinesin family member 2C (KIF2C), cell division cycle 20 (CDC20), centromere protein F (CENPF), ribonucleotide reductase regulatory subunit M2 (RRM2), tumor-transforming protein 1 (PTTG1), assembly factor for spindle microtubules (ASPM), cell division cycle associated 8 (CDCA8), checkpoint kinase 1 (CHEK1), nucleolar and spindle associated protein 1 (NUSAP1), centrosomal protein 55 (CEP55), and cyclin B2 (CCNB2) (Figure 5A). The darker colour of the nodes represents the more significant association of the hub genes with the PPI protein interactions network. A complex hub gene interactions network was constructed through the GeneMANIA database to better explore the biological functions of these hub genes in liver cancer and COVID-19 (Figure 5B). The inner circles in the network diagram represent the 15 hub genes and the outer circles represent the 20 associated genes with interactions with hub genes. The results showed co-expression of 88.44%, physical interactions of 4.31%, predicted of 3.60%, co-localization of 2.65%, pathway of 0.95%, and genetic interactions of 0.05%. Observation of the functions of hub genes enriched with interacting genes showed that they were mainly associated with mitotic nuclear division, chromosome segregation, mitotic sister chromatid segregation, sister nuclear chromosome segregation, condensed chromosome, etc.
Figure 5 Identification and analysis of the hub genes.
A: Protein–protein interaction network of hub genes; B: Biological function analysis of hub genes.
GO functional annotation and KEGG pathway enrichment analysis of the hub genes
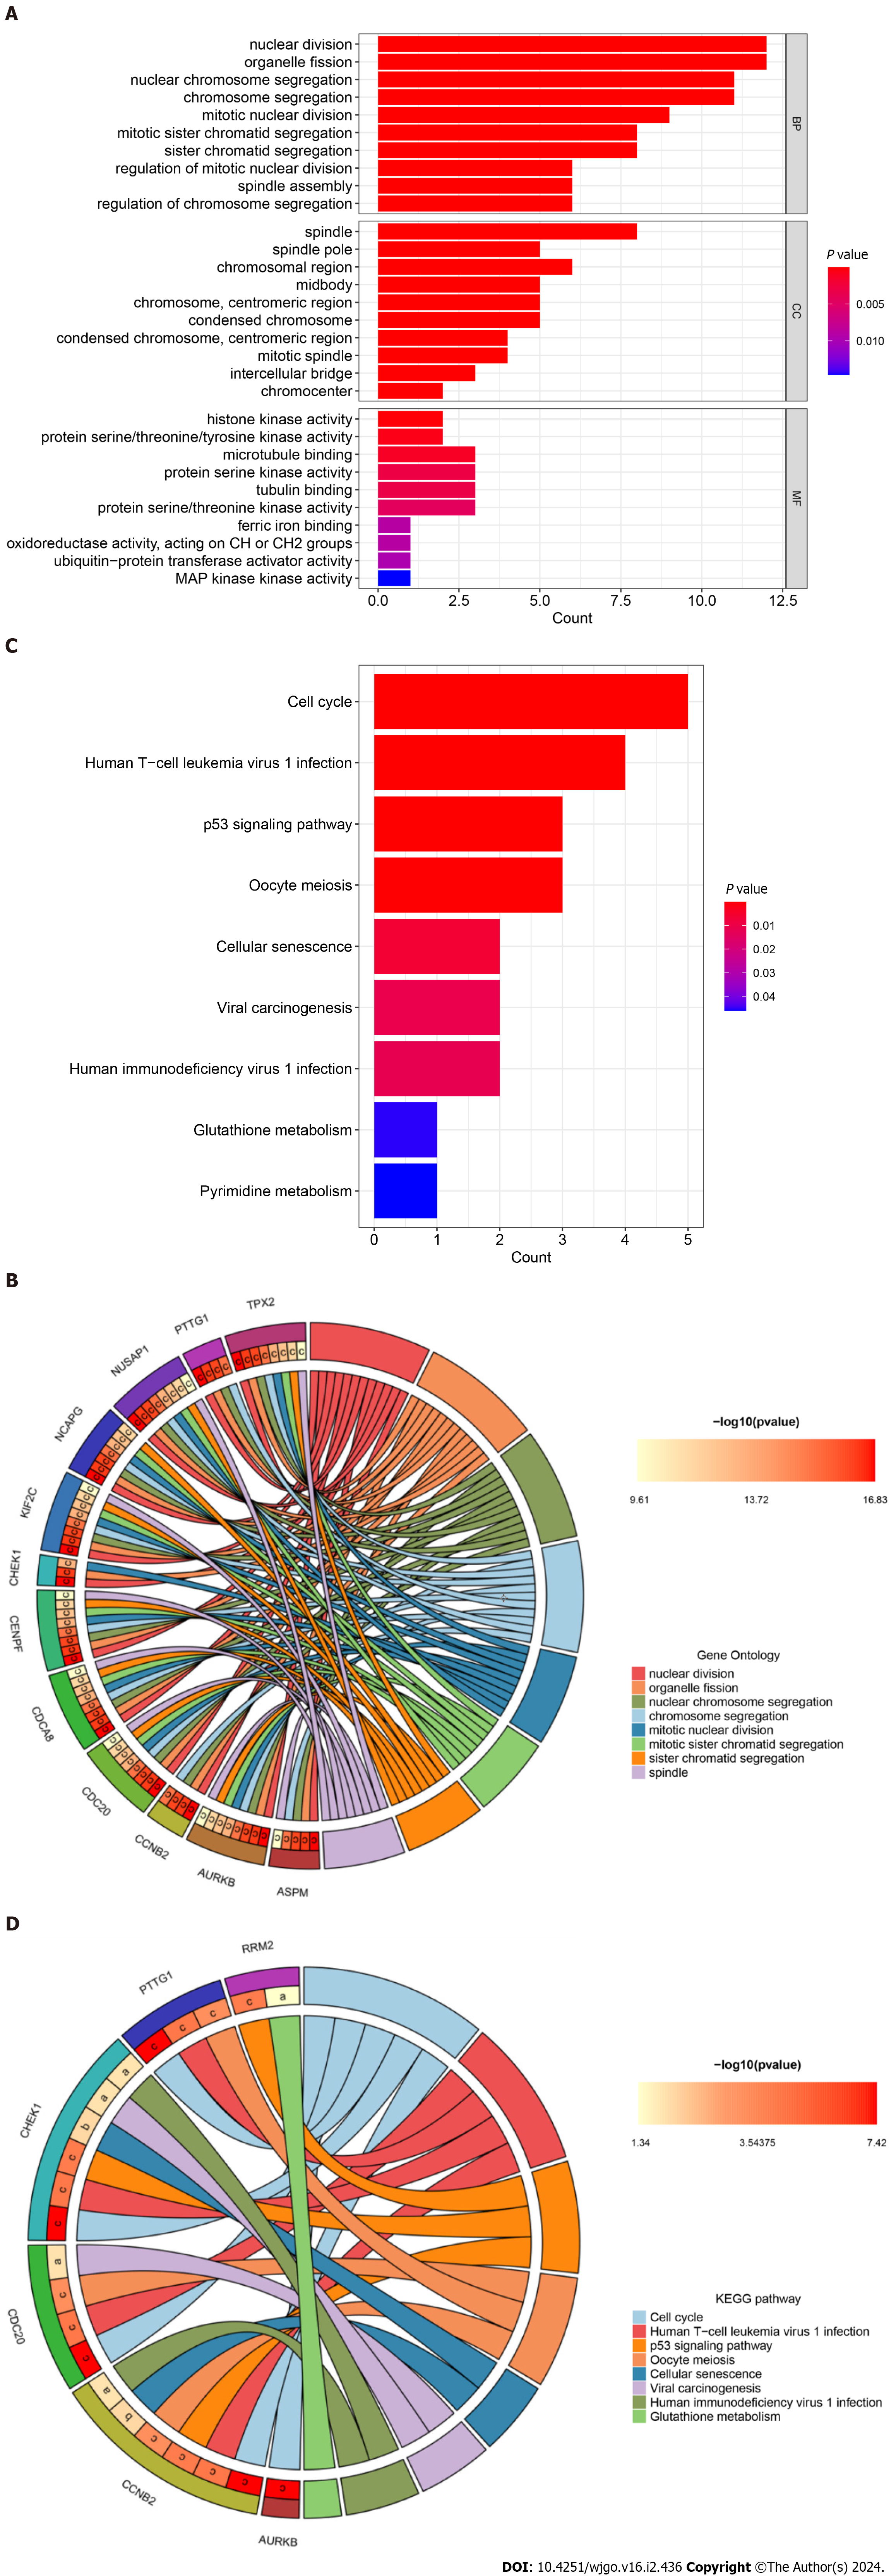
To further explore the relevant biological functions and signaling pathways of hub genes, we performed GO/KEGG enrichment analysis and plotted bar and circle maps of these hub genes using Rstudio. The GO functional annotations (BP, CC, MF) showed that the top 5 enriched functional components were nuclear division, organelle fission, mitotic nuclear division, mitotic sister chromatid segregation, and sister chromatid segregation (Figure 6A). The GO circle maps showed that 12 hub genes, including ASPM, AURKB, and CDC20, were significantly enriched in the nuclear division, organelle fission, nuclear chromosome segregation, chromosome segregation, mitotic nuclear division, mitotic sister chromatid segregation, sister chromatid segregation, spindle (Figure 6B).
Figure 6 Gene Ontology annotation and Kyoto Encyclopedia of Genes and Genomes pathway enrichment analysis of hub genes.
A: Bar plot of Gene Ontology (GO) function annotation of hub genes; B: Circle plot of GO function annotation of hub genes; C: Bar plot of Kyoto Encyclopedia of Genes and Genomes (KEGG) pathway enrichment analysis of hub genes; D: Circle plot of KEGG pathway enrichment analysis of hub genes. KEGG: Kyoto Encyclopedia of Genes and Genomes.
Furthermore, for KEGG pathway enrichment analysis, the top five significant signaling pathways showed that hub genes were mainly involved in the cell cycle, human T-cell leukemia virus 1 infection, p53 signaling pathway, oocyte meiosis, and cellular senescence (Figure 6C). While the KEGG circle plot indicated that CCNB2, CDC20, CHEK1, PTTG1, PRM2 and AURKB were significantly enriched in cell cycle, cell human T-cell leukemia virus 1 infection, p53 signaling pathway, oocyte meiosis, cellular senescence, viral carcinogenesis, human immunodeficiency virus 1 infection, glutathione metabolism (Figure 6D). These results strongly suggest that COVID-19 and hepatocarcinogenesis are related to cellular composition, viral infection, and metabolism.
Differential expression analysis of hub genes and COVID-19/liver cancer
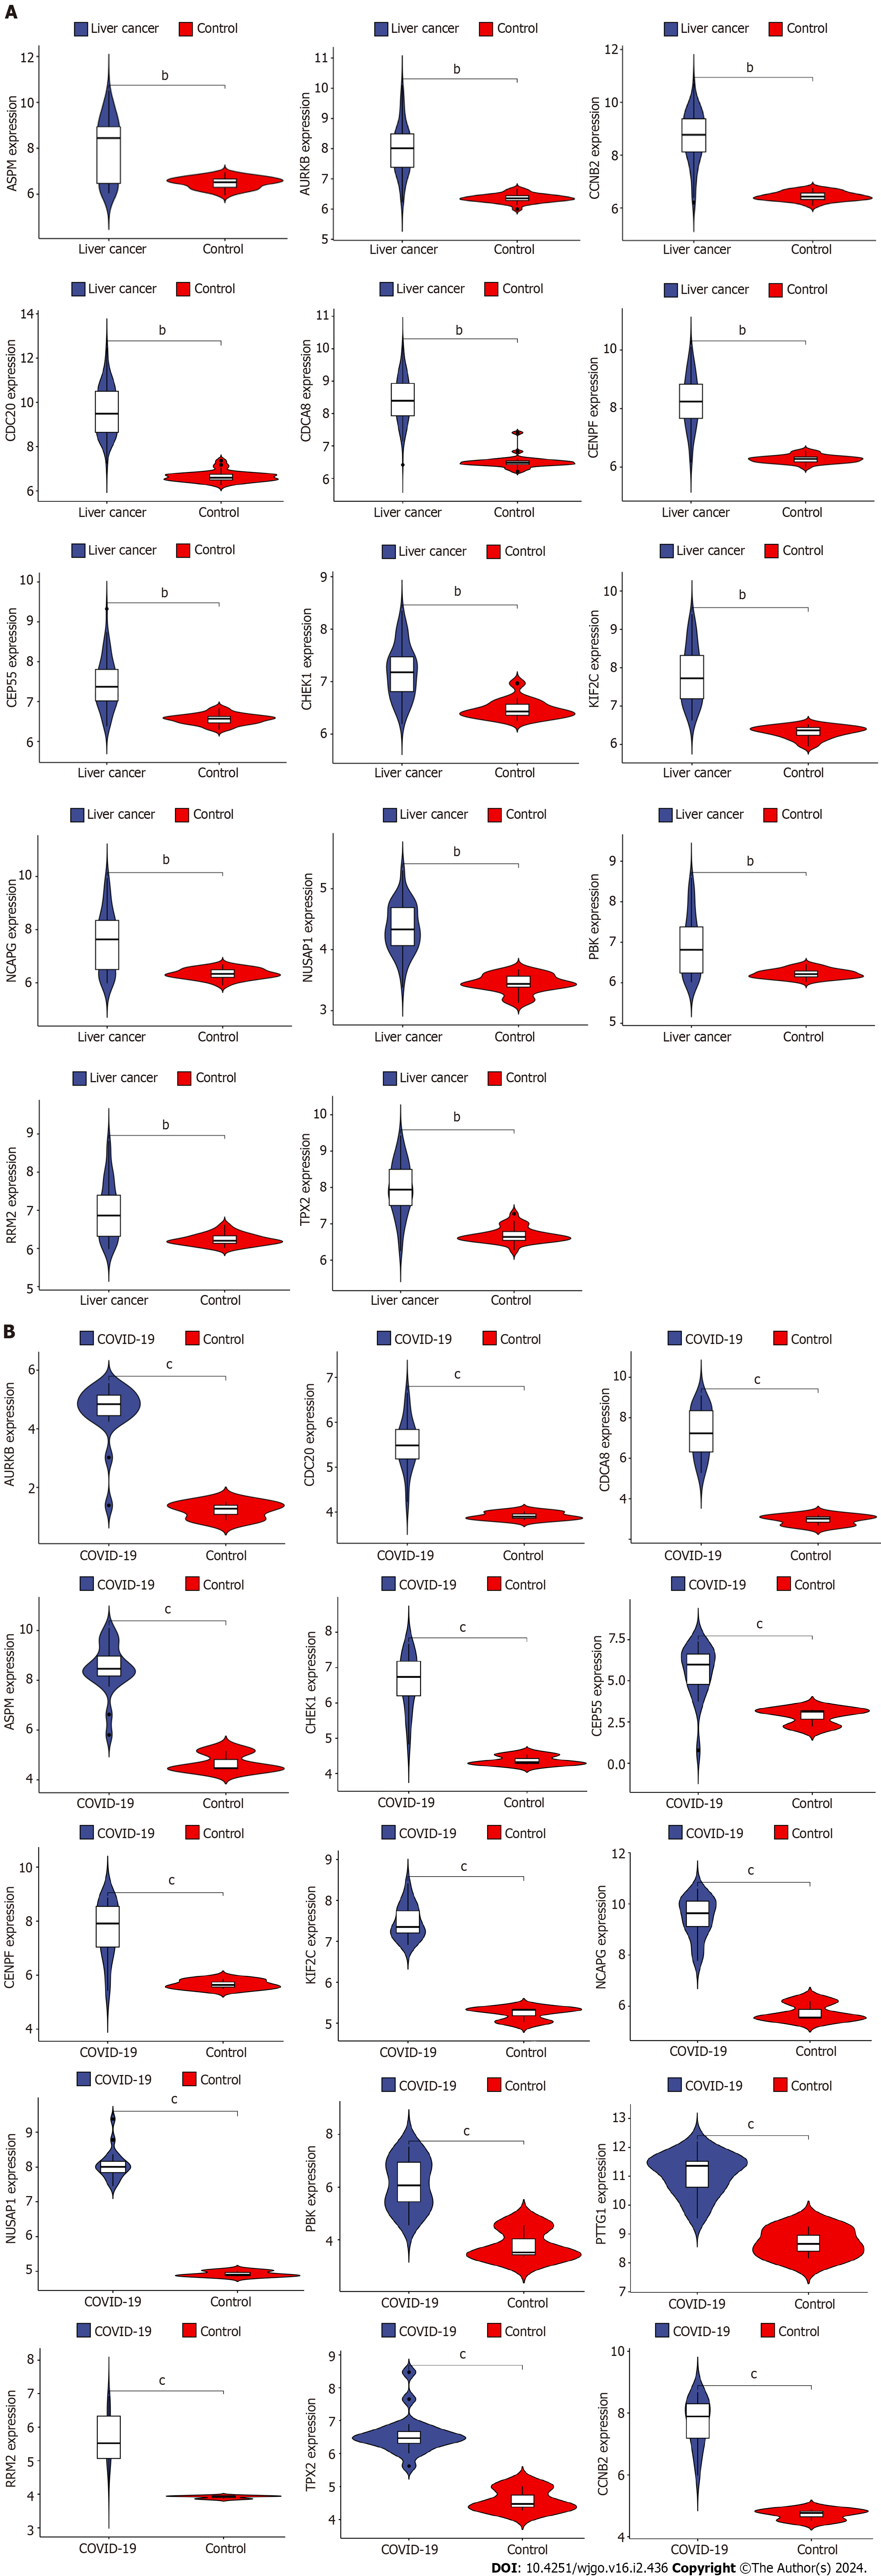
The GSE180226 dataset for COVID-19 and the GSE113996 dataset for liver cancer were selected for expression analysis by Rstudio to verify the difference in the expression of hub genes in the two diseases. By comparing the violin plots of the disease and control groups, we found that ASPM, AURKB, CCNB2, CDC20, CDCA8, CENPF, CEP55, CHEK1, KIF2C, NCAPG, NUSAP1, PBK, PTTG1, RRM2, and TPX2 genes were significantly more highly expressed in the COVID-19 group (Figure 7A). And all 14 hub genes except PTTG1 were significantly overexpressed in the liver cancer group (aP < 0.05, bP < 0.01, cP < 0.001) (Figure 7B). These results suggest that the differential expression of the shared hub genes in the two diseases may have a strong correlation with their development.
Figure 7 Validation of differential expression of hub genes in liver cancer and coronavirus disease 2019.
A: Differential expression analysis of hub genes in liver cancer dataset; B: Differential expression analysis of hub genes in coronavirus disease 2019 dataset. COVID-19: Coronavirus disease 2019. bP < 0.01, cP < 0.001.
Network construction and differential analysis of TF-hub genes
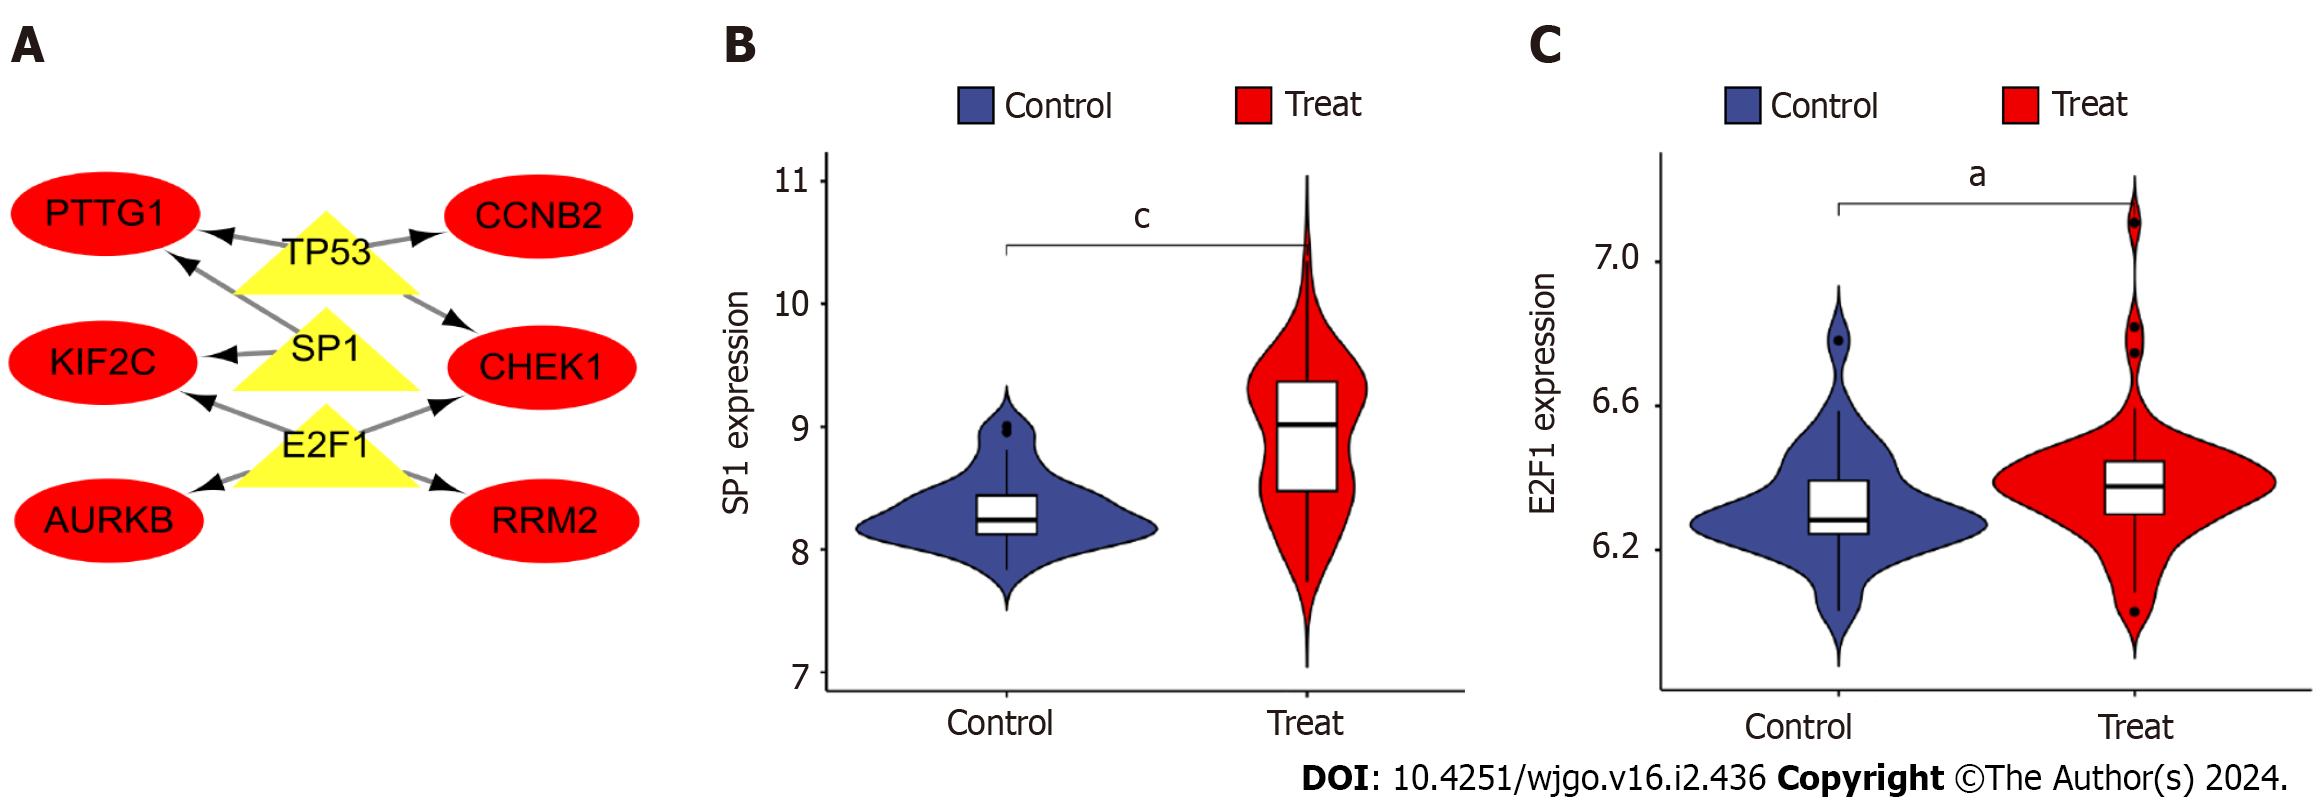
The three TFs that can play a role in regulating the six hub genes, PTTG1, CCNB2, KIF2C, CHEK1, AURKB, and RRM2, were predicted by TRUST as tumor protein P53 (TP53), sp1 TF (SP1), and e2f TF 1 (E2F1). The TF-hub genes were mapped by Cytoscape and visualized the regulatory network of TF-hub genes (Figure 8A). The network contains 9 nodes and 9 edges, with yellow nodes representing TFs and red nodes representing hub genes regulated by TFs. One TF in this regulatory network corresponds to multiple hub genes, which indicates the high correlation between TFs and hub genes. Furthermore, the above TFs were analyzed for differences by Rstudio (aP < 0.05, cP < 0.001). Violin plots indicated that SP1 and E2F1 in TFs were significantly upregulated in the disease group (Figures 8A and B).
Figure 8 Construction and analysis of the regulatory network of transcription factor genes and hub genes.
A: Transcription factor (TF)-hub gene regulatory network, highlighted red nodes indicate hub genes and yellow nodes indicate TF genes; B: Analysis of differential expression of TF gene e2f transcription factor 1 in disease; C: Differential analysis of TF gene sp1 transcription factor expression in disease. aP < 0.05, cP < 0.001 E2F1: e2f transcription factor 1; SP1: sp1 transcription factor; AURKB: Aurora kinase B; CCNB2: Cyclin B2; CHEK1: Checkpoint kinase 1.
Validation of hub gene expression in liver cancer cells
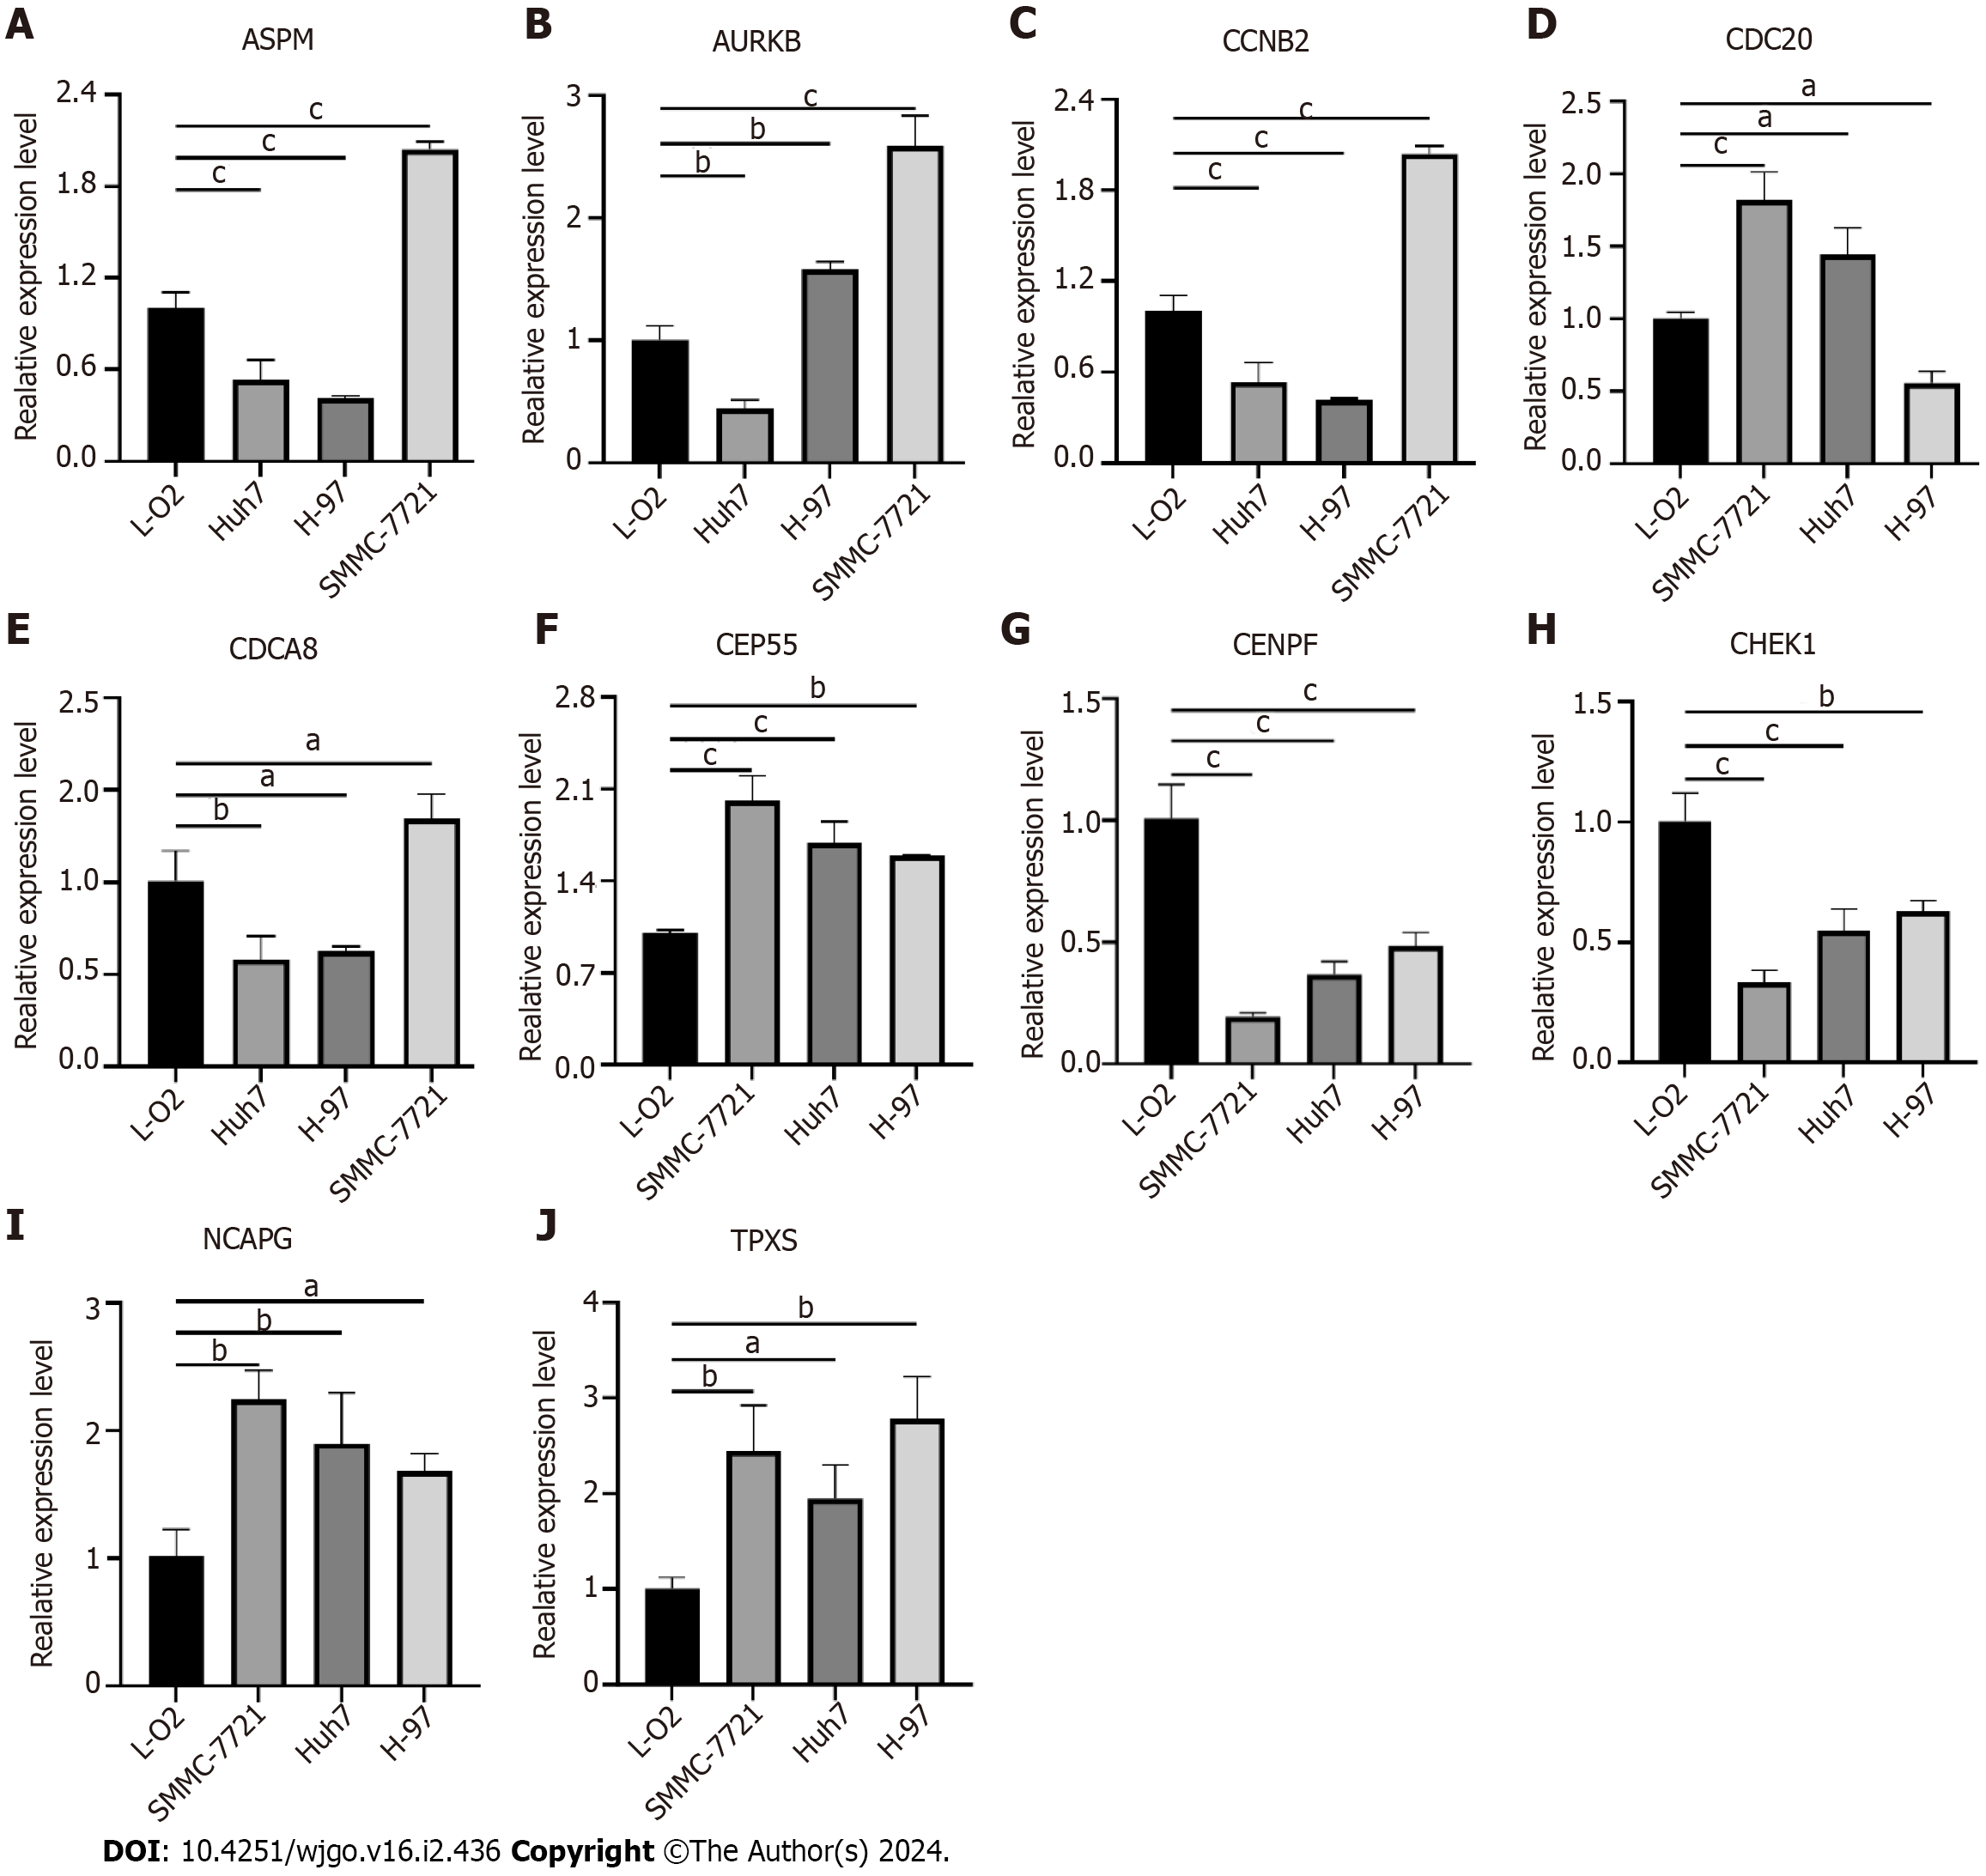
The expression of some hub genes in hepatoma cells was verified by qRT-PCR. The results showed that ASPM, CCNB2 and CDCA8 were all low expressed in HUh7 and H-97 hepatoma cells, and only high expression in SMMC-7721. AURKB is highly expressed in H-97 and SMMC-7721, and low in HUh7. CDC20 is highly expressed in SMMC-7721 and HUh7 and low in H-97. CENPF and CHEK1 were both low expressed in the three hepatoma cells. CEP55, NCAPG and TPX2 were highly expressed in the three hepatoma cells (Figure 9).
Figure 9 Validation of hub genes expression in liver cancer cells.
A: Assembly factor for spindle microtubules (ASPM); B: Aurora kinase B (AURKB); C: Cyclin B2 (CCNB2); D: Cell division cycle 20 (CDC20); E: Cell division cycle associated 8 (CDCA8); F: Centrosomal protein 55 (CEP55); G: Centromere protein F (CENPF); H: Checkpoint kinase 1 (CHEK1); I: Non-SMC condensin I complex subunit G (NCAPG); J: Targeting protein for xklp2 (TPX2). aP < 0.05, bP < 0.01, cP < 0.001 ASPM: Assembly factor for spindle microtubules; AURKB: Aurora kinase B; CCNB2: Cyclin B2; CDC20: Cell division cycle 20; CDCA8: Cell division cycle associated 8; CEP55: Centrosomal protein 55; CENPF: Centromere protein F; CHEK1: Checkpoint kinase 1; NCAPG: Non-SMC condensin I complex subunit G; TPX2: Targeting protein for xklp2.
DISCUSSION
In most cases, the severity of a disease is often related to the pre-existing disease that can impair the immune function of the body. As many reports have shown, the incidence of severe disease and the risk of death associated with COVID-19 is much higher in cancer patients compared to non-cancer patients[21]. However, studies on COVID-19 and liver cancer are still relatively few, so we attempted to link the two and further clarify the correlation between COVID-19 and liver cancer by exploring the molecular biological functions and mechanisms shared between them.
A total of 473 shared DEGs for COVID-19 and liver cancer was obtained in this study, and after performing a screen to construct a PPI network of shared DEGs, we obtained 15 hub genes, sorted by “Degree” from highest to lowest, namely CCNB2, AURKB, CDC20, CDCA8, NUSAP1, TPX2, RRM2, PTTG1, NCAPG, KIF2C, PBK, ASPM, CENPF, CHEK1, CEP55. We subsequently validated the in vitro expression of some of the hub genes in liver cancer, and the results were generally consistent with previous literature. However, it is noteworthy that the expression of the same hub genes, such as ASPM, AURKB, CCNB2, CDC20, CDCA8, was not identical in different liver cancer cells, which may be due to the different degrees of heterogeneity between cells[22,23].
We briefly describe the top six hub genes that are associated with liver cancer or COVID-19 pathogenesis. CDC20 is an E3 ubiquitin ligase complex that binds to the regulatory factor E-calmodulin and activates the prophase complex. CDC20 plays an important role in cell entry and termination of mitosis, and can participate in apoptosis and tumorigenesis by mediating multiple signaling pathways[24]. An increasing number of studies have demonstrated that CDC20 expression is upregulated in different types of malignancies and is associated with poor prognosis[24,25]. This includes HCC, where CDC20 is highly expressed in HCC tissue and significantly associated with poor prognosis in HCC patients and promotes a malignant phenotype in HCC cells[26]. In addition, silencing of CDC20 expression in HCC cells was observed to increase E-cadherin expression and decrease N-cadherin, and vimentin protein expression, suggesting that CDC20 can advance HCC progression by regulating epithelial-mesenchymal transition[27]. Zhao et al[28] found that in HCC, CDC20 could be involved in the progression of HCC, CDC20 was found to regulate P53-activated HCC cell proliferation and attenuate radioresistance by participating in the Bcl-2/Bax pathway. CDCA8 is one of the components of the chromosome passenger complex, which consists of CDCA8, survivin, inner centromere protein, and AURKB. CDCA8 is an important regulator of mitosis and cytokinesis, so it may be an important member involved in the abnormal division process of tumor cells[29]. CDCA8 is upregulated in a variety of malignancies and promotes their growth and progression, which can also lead to poorer prognostic outcomes[30]. It has been shown that CDCA8 is highly expressed in HCC and induces poor TNM staging and enhances the tumorigenic capacity of tumor cells. When CDCA8 expression is suppressed, the G0/G1 phase of the cell cycle of HCC cells is blocked, suggesting that CDCA8 can influence the proliferative phenotype of HCC cells by regulating their cell cycle[31]. When CDCA8 is silenced in HCC cells, it can inhibit HCC development and stemness expression by reversing activating TF 3 tumor suppressor activity and blocking the AKT/β-catenin signalling pathway[32]. NUSAP1 is an important microtubule and chromosome-binding protein that has an important role in the regulation of spindle assembly, chromosome segregation, and cell division[33]. Increasing reports have elucidated a close relationship between NUSAP1 and the development of HCC. NUSAP1 maintains stable cell cycle operation in HCC cells, but high expression of NUSAP1 stimulates HCC progression by reducing apoptosis and promoting cell cycle progression[34,35]. Upregulation of NUSAP1 expression enhances HCC cell proliferation, invasion, and tumourigenesis and is associated with high-level staging and poor prognosis in HCC patients[35]. Furthermore, NUSAP1 can affect immune cells in the HCC tumor microenvironment, promoting the progression of HCC by affecting CD4+ T cells and M0 macrophages[36]. In addition to enhancing the biological phenotype of HCC, NUSAP1 also promotes HCC recurrence by stimulating the signalling transducer and nuclear translocation of transcriptional activator 3 and activating protein C kinase 1 receptor activation to enhance cancer stemness[37]. CCNB2 is an important component of the cell cycle regulatory machinery and binds to cell cycle protein-dependent kinases, which are synthesized in the G1 phase and rapidly decrease in the mid-to late-stage. Abnormal expression of CCNB2 can lead to a failure of the G2/M checkpoint function in the cell cycle to the point of disrupting DNA repair function and genomic integrity thereby promoting tumor development[38]. CCNB2 is noted to be highly expressed in gastrointestinal tumors such as colon and gastric cancers[39,40]. For liver cancer, it has been reported that CCNB2 can enhance the biological phenotype of HCC cells by upregulating the expression of jagged canonical notch ligand 1[41]. In addition, CCNB2 is considered to be a prognostic marker for liver cancer, spiking the growth and development of liver cancer cells by affecting the CCNB2/polo like kinase 1 pathway activity in liver cancer[42]. PBK is a serine/threonine kinase belonging to the mitogen-activated protein kinase family. PBK has been shown to positively contribute to the development of tumourigenesis, promoting the biological phenotype of cancer cell proliferation, invasion, and metastasis[43,44]. PBK is highly expressed in cancers such as breast, lung, and leukaemia and is associated with unfavourable prognostic outcomes[45-47]. In addition, PBK was identified as a potential target for a novel anti-SARS-CoV-2 agent[48], suggesting that PBK has a common potential targeting therapeutic value for cancer and COVID-19. TPX2 is a microtubule-associated protein whose expression is strictly regulated by the cell cycle and participates in cell cycle progression by maintaining the stability of the mitotic spindle[49]. TPX2 is overexpressed in a variety of tumors in the body, including medullary thyroid, colon, oesophageal, and breast cancer, etc, and promotes the growth and metastasis of, for example, HCC[50-52]. It has been shown that silencing TPX2 expression in liver cancer cells can inhibit the growth and tumourigenic capacity of liver cancer cells by suppressing the wingless/β-catenin and phosphatidylinositol-3-kinase/AKT signalling pathways[51,53], and can regulate cyclin D1 and apoptosis-related proteins to inhibit proliferation and induce apoptosis in liver cancer cells[53,54], which fully demonstrates that TPX2 is a potential target for anti-liver cancer therapy.
From the results of the GO enrichment analysis of hub genes in this study, the main functions enriched by hub genes in the BP part are nuclear division, mitotic nuclear division, mitotic sister chromatid segregation, etc. In the CC part, they are mainly enriched in spindle, chromosomal region, In the CC fraction, they are mainly enriched in spindle, chromosomal region, spindle pole, etc. In the MF fraction, they are mainly involved in microtubule binding, histone kinase activity, tubulin binding, etc. The above results suggest that the common mechanism of action between COVID-19 and HCC may be related to the regulation of chromosome segregation and mitosis-related functions of cells, which is compatible with the functions of the aforementioned hub genes such as CDC20, CDCA8, and NUSAP1. The results of the KEGG pathway enrichment analysis showed that the shared hub genes between COVID-19 and HCC were mainly enriched in signaling pathways such as cell cycle, human T-cell leukemia virus 1 infection, and p53 signaling pathway. Based on previous literature, the p53 signaling pathway may be a common regulatory mechanism for COVID-19 and liver cancer.
The TF P53 is able to be encoded by the TP53 gene and is one of the most important tumor suppressors[55]. Missense mutations in TP53 are common in tumors and this has led to the accumulation of mutant P53 in tumors[56]. Overexpression of P53 has been shown to impede the growth level of tumor cells and induce apoptosis[57]. P53 acts as a tumor suppressor and regulator that promotes tumor cell cycle arrest, apoptosis and senescence through the upregulation of pro-apoptotic proteins such as cyclin dependent kinase inhibitor 1A, BAX, p53 up-regulated modulator of apoptosis and phorbol-12-myristate-13-acetate-induced protein 1[58]. Whereas P53 also plays an important role in regulating the development of HCC[59]. Lujambio et al[60] showed that tumor-suppressive M1-type macrophages in hepatic stellate cells can be polarised to tumor-promoting M2-type macrophages through P53-dependent inactivation of the senescence program based on chronic liver injury, which would drive the transformation of normal precancerous cells to liver cancer cells[60]. On the other hand, P53 is a crucial COVID-19 regulator. Increased viral reproduction and immunosuppressive capability in host cells are two features of COVID-19, whereas P53 functions as an anti-SARS-CoV factor and prevents the replication of the virus. The German Centre for Infection Research found that cells lacking P53 had a much higher rate of viral replication than cells normally expressing P53, suggesting that P53 is able to participate in the host cell’s non-specific viral defense system[61]. The pathogenesis of P53 affecting COVID-19 may be related to a number of circumstances, with P53 acting as an antiviral molecule limiting the activity of SARS-CoV-2 and its degradation rate being able to regulate by Ring Finger And CHY Zinc Finger Domain Containing 1-mediated nonstructural protein 3 and can further influence the rate of viral replication[62]. When P53 is compromised, SARS-CoV-2 can initiate specific molecular programs leading to oxidative cellular and DNA damage, thereby inducing widespread apoptosis, a mechanism that would contribute to the elevated severity of pneumonia and respiratory symptoms in COVID-19[63]. In addition, SARS-CoV-2 maintains normal survival of SARS-CoV-2 by upregulating the expression of the P53 inhibitor MDM2 Proto-Oncogene (MDM2), leading to accelerated degradation of P53[64]. Zauli et al[65] found that P53 in ocular tissue is protective against SARS-CoV-2 infection and that P53 can act through the MDM2 inhibitor member Nutlin-3 is upregulated and reduces the spread of the virus.
In addition, we found that the TFs TP53, SP1, and E2F1 regulate certain shared hub genes in HCC and COVID-19. TP53 encodes P53 in response to different cellular stresses to regulate the expression of target genes, thereby inducing cell cycle arrest, cellular senescence, apoptosis, DNA repair, or metabolic changes[66]. Its regulatory effects on liver cancer and COVID-19 have been described above[67]. E2F1 belongs to the E2F family of transcriptional activators, which regulate the G1/S phase of the cell cycle by mediating chromosomal DNA replication and gene promoters and regulate the proliferative and apoptotic phenotypes of many tumors, including HCC, in a variety of ways[68-70]. In addition, E2F1 upregulates the expression of regulatory T (Treg) cell surface receptors CD39 and CD73 and further enhances Tregs infiltration, a common mechanism by which E2F1 may affect liver cancer and COVID-19 by regulating cellular immunity[71]. SP1 is a basic TF that has been shown to be involved in angiogenesis in a variety of tumours[72]. Liao et al[73] showed that SP1 promotes angiogenesis in HCC by promoting transcriptional activation of miR-130b-3p. Recently, it has been reported that deubiquitination of SP1 can promote the development of HCC. For example, zinc finger ranbp2-type containing 1 can directly bind to SP1, induce SP1 deubiquitination and overexpress lysyl oxidase-like 2, which in turn promotes HCC[74]. Ubiquitin-specific peptidase 39 can promote HCC proliferation by participating in the deubiquitination of SP1[75].
Although previous studies have investigated hub genes associated with COVID-19 and HCC, respectively, there is a lack of bridges to explore the common molecular mechanisms of COVID-19 and liver cancer. In this study, we explored the correlation between these two diseases using bioinformatics methods, which may help to further elucidate the pathogenesis of these two diseases. The COVID-19 dataset (GSE180226) is based on comparing the integration of gene expression, viral load, pathology, and plasma proteins between autopsy tissues from patients with COVID-19 and normal lung tissues, but it is not yet possible to understand these patients defensive vaccination status. Therefore, the effect of vaccination or not on the co-regulatory mechanism of COVID-19 and liver cancer could not be explained in this study. In the future, we hope to enrich the prospects and implications of this study by conducting cohort studies with or without vaccination as an exposure factor. In addition, we only verified the expression of some of the central genes in three HCC cell lines by in vitro experiments, but lacked a dual-disease model of COVID-19 and HCC to validate the expression of the central genes and the impact of the associated signaling pathways on biological functions and to further elucidate the potential relevance of the two diseases.


