Copyright
©2014 Baishideng Publishing Group Inc.
World J Gastrointest Oncol. Jul 15, 2014; 6(7): 225-243
Published online Jul 15, 2014. doi: 10.4251/wjgo.v6.i7.225
Published online Jul 15, 2014. doi: 10.4251/wjgo.v6.i7.225
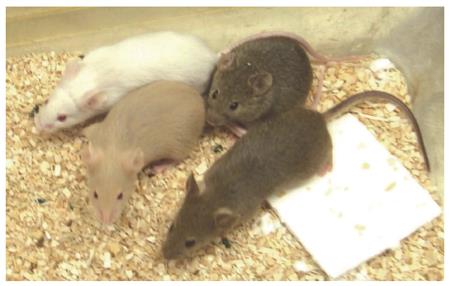
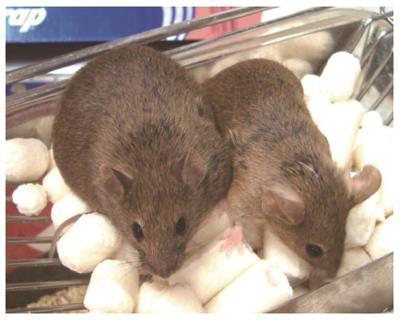
Figure 1 Young mice from 2nd generation cross of 2 wild type inbred lines show variation in colors.
Figure 2 Opened proximal colons plus cecal areas of mice.
A: 3 grossly visible mucosal nodules (arrows); B: No visible nodules. The letter P indicates a region of the proximal colon and letter C indicates a cecum.
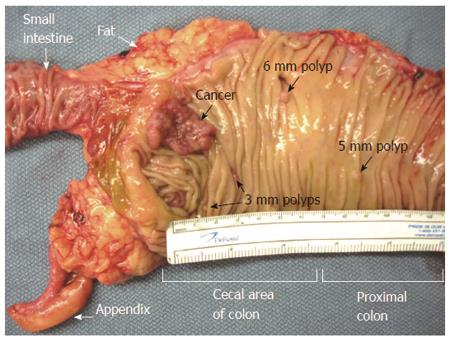
Figure 3 Cut open gross specimen of proximal human colon showing multiple tumors[13].
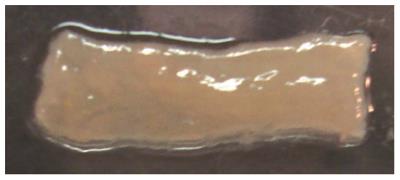
Figure 4 Opened segment of small intestine observed to have mucosal nodules.
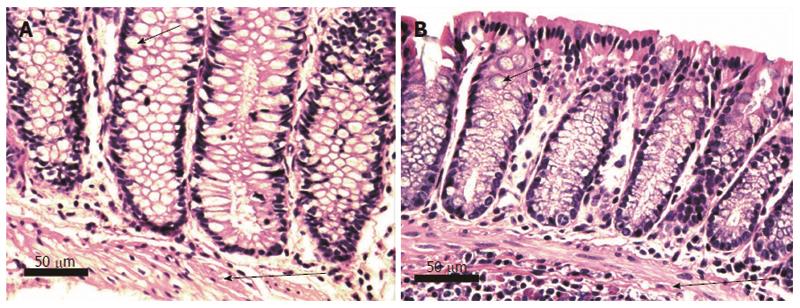
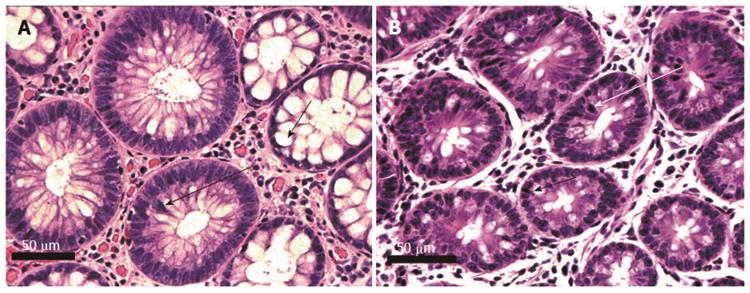
Figure 5 Histologically normal human (A) and mouse (B) colonic crypts, cut along the long axis of crypts.
The normal human and mouse glands (crypts) are composed of columnar epithelial cells and goblet cells. Short arrows indicate typical goblet cells containing mucin (not stained, white in the image). About half of the cells in the crypts are goblet cells. Nuclei are darkly stained. All crypts are normally aligned colonic mucosal glands with the bases of the crypts abutting the muscularis mucosa. Long arrows indicate the muscularis mucosa. All crypt cells are parallel to each other and the nuclei are adjacent to each other, with no overlapping. Images obtained with 40× objective lens.
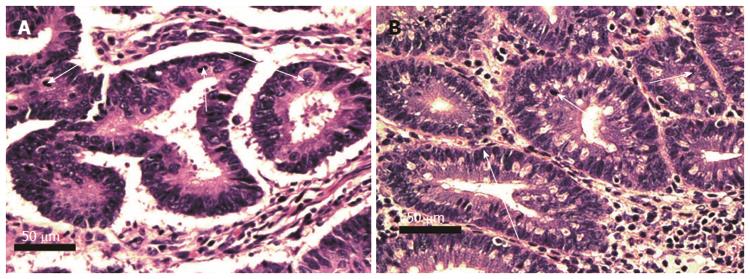
Figure 6 Human (A) and mouse (B) crypts cut across the short axis, showing tubular adenomatous crypts as well as histologically normal crypts.
Crypts on the right in A and at the bottom of B have normal histology. Adenomatous crypts are seen to the left in A, and in the top half of B. Adenomatous glands show overlapping cells with hyperchromatic mitotically active nuclei (long arrows indicate examples of cells undergoing mitosis). Short arrows indicate typical goblet cells. The goblet cells in adenomatous glands are decreased in frequency compared to goblet cells in the histologically normal glands. Images obtained with 40× objective lens.
Figure 7 Crypts of tubular adenomas with high grade dysplasia cut across the short axis, human (A) and mouse (B).
Glands with high grade dysplasia show overlapping cells with oval to round vesicular nuclei and prominent nucleoli (long arrows). Mitotic figures are abundant (short arrows). Complex architecture with infolding of crypts can also be seen. Images obtained with 40× objective lens.
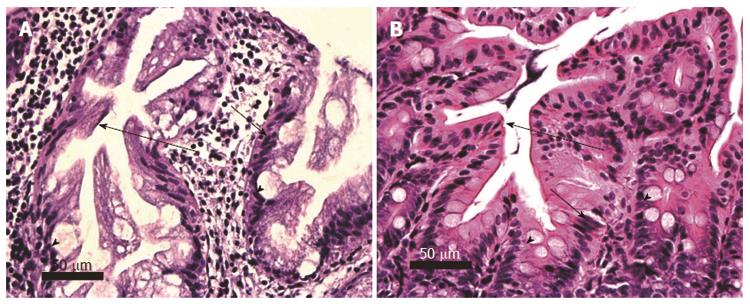
Figure 8 Sessile serrated adenomas, human (A) and mouse (B), cut along the long axis.
Serrated glands show star shaped crypt architecture (long arrows). Adenomatous glands with hyperchromatic overlapping nuclei (short arrows) retaining goblet cells (arrow heads) are seen. Images obtained with 40× objective lens.
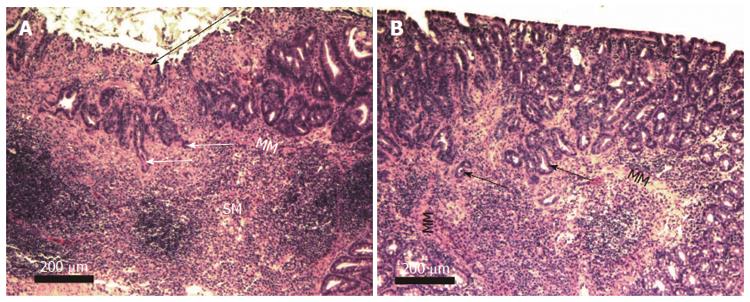
Figure 9 Two examples of mouse adenocarcinoma stage T1.
A shows a sessile serrated adenoma in the right upper portion of the image and an ulcerated region (long arrow) above an adenocarcinoma that had penetrated the muscularis mucosa. Both A and B show invasive glands (short arrows) infiltrating through the muscularis mucosa (MM) into the submucosa (SM). Images obtained with 10× objective lens.
Figure 10 Mouse adenocarcinomas at stages T1 (A) and T2 (B).
A shows a section through an entire cancer at stage T1, and B shows a section through an almost entire cancer at stage T2. A shows infiltrating malignant glands (long arrow) in submucosa (SM) but not in muscularis propria (MP). B shows infiltrating malignant glands (long arrows) within muscularis propria (MP). These adenocarcinomas are about 2 to 3 mm tall and about 6 mm wide and would correspond to the sizes of the mucosal nodules seen in Figure 2A. Pale areas in B are pools of mucin. Images obtained with 4× objective lens.
Figure 11 Invasion of the muscularis propria by adenocarcinoma stage T2, human (A) and mouse (B).
Malignant glands (long arrows) can be seen invading the muscularis propria (MP). The pale areas within the stroma in B are mucin pools. Necrotic material is seen within the lumen of malignant glands in A and B. Images obtained with 10× objective lens.
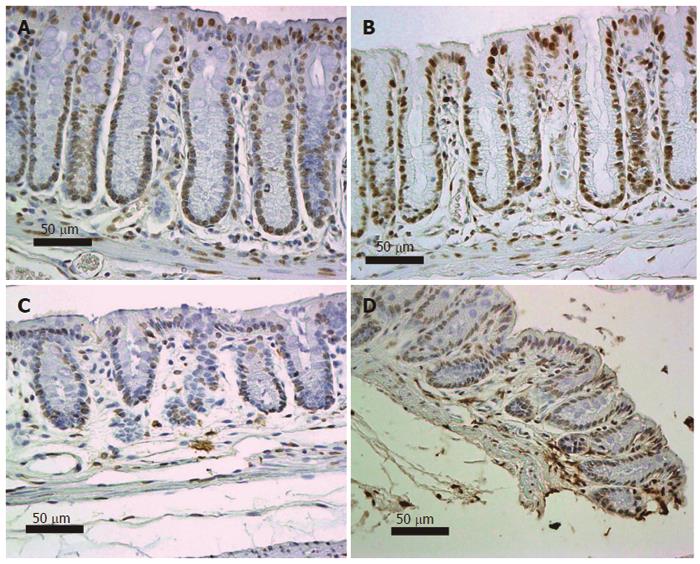
Figure 12 Colonic epithelia from mice fed diet + deoxycholic acid (A, B) or mice fed control diet (C, D) immunostained (brown) for 8-OH-dG, counterstained with hematoxylin.
Images obtained with 40× objective lens.
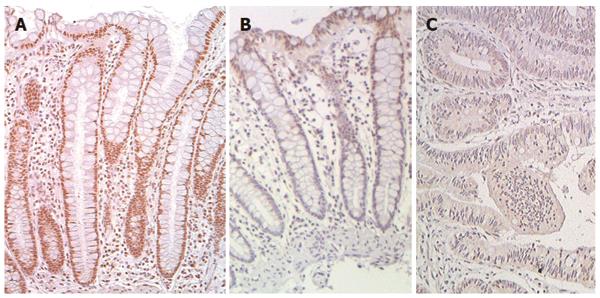
Figure 13 Human colonic mucosa immunostained (reddish brown) for excision repair cross-complementation group 1 with blue hematoxylin counter stain for chromatin.
A: From patient without colonic neoplasia; B: From tissue near a colon cancer; C: From cancer tissue. Images with 40× objective. Scale shows 50 μm.
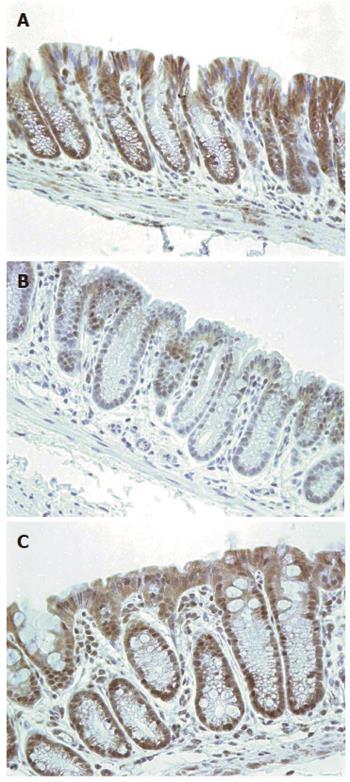
Figure 14 Mouse colonic epithelia with immunohistochemistry for excision repair cross-complementation group 1 (brown) and hematoxylin (blue) for chromatin.
Mice fed diets: A: Control; B: Diet + deoxycholic acid (DOC); C: Diet + DOC + chlorogenic acid. Images obtained with 40× objective lens. Scale shows 50 μm.
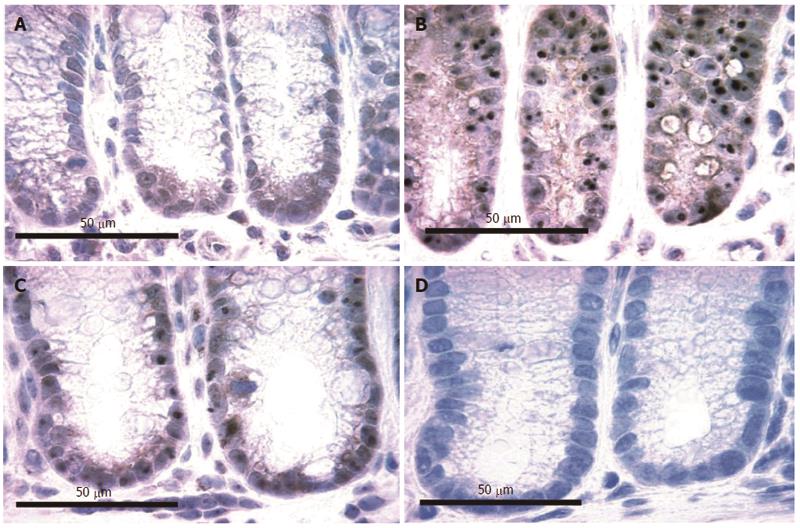
Figure 15 Immunohistochemistry of mouse colons for beclin-1.
Mice fed diets: A: Control; B: Diet + deoxycholic acid (DOC); C: Diet + DOC + chlorogenic acid; D: Negative control without primary antibody (blue hematoxylin stain for nuclei). Images taken with 40× objective lens.
Figure 16 Lower regions of mouse colonic crypts immunostained for beta-catenin.
Mice fed diets: A: Control; B: Diet + deoxycholic acid (DOC); C: Diet + DOC + chlorogenic acid (CGA). In A (control diet), in the stem cell region (lowest cells in the crypts), cells have beta-catenin expression localized to their membrane regions as shown by arrows. In B (diet + DOC), the stem cell region shows substantial nuclear localization of beta-catenin (arrows). In C (diet + DOC + CGA), stem cell region nuclei are largely deficient in beta-catenin, and the cytoplasm has low levels of beta-catenin, similar to the levels in mice fed the control diet alone. Images taken with 40× objective lens.
Figure 17 Two mice, raised in the same pan, had different weights after 10 mo on their diet.
The heavier mouse and the lighter mouse both appeared to be healthy and active.
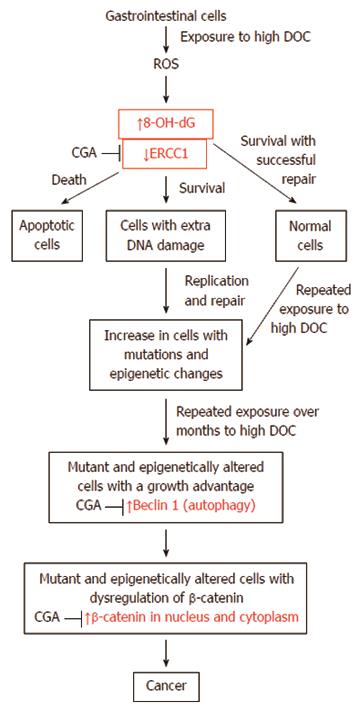
Figure 18 Likely path of progression to colon cancer in mice and humans, indicating key roles of the molecular markers evaluated here and the points of effects of chlorogenic acid in mice.
CGA: Chlorogenic acid; DOC: Deoxycholic acid; ERCC1: Excision repair cross-complementation group 1.
- Citation: Prasad AR, Prasad S, Nguyen H, Facista A, Lewis C, Zaitlin B, Bernstein H, Bernstein C. Novel diet-related mouse model of colon cancer parallels human colon cancer. World J Gastrointest Oncol 2014; 6(7): 225-243
- URL: https://www.wjgnet.com/1948-5204/full/v6/i7/225.htm
- DOI: https://dx.doi.org/10.4251/wjgo.v6.i7.225


