Copyright
©2014 Baishideng Publishing Group Co.
World J Gastrointest Oncol. Jan 15, 2014; 6(1): 22-33
Published online Jan 15, 2014. doi: 10.4251/wjgo.v6.i1.22
Published online Jan 15, 2014. doi: 10.4251/wjgo.v6.i1.22
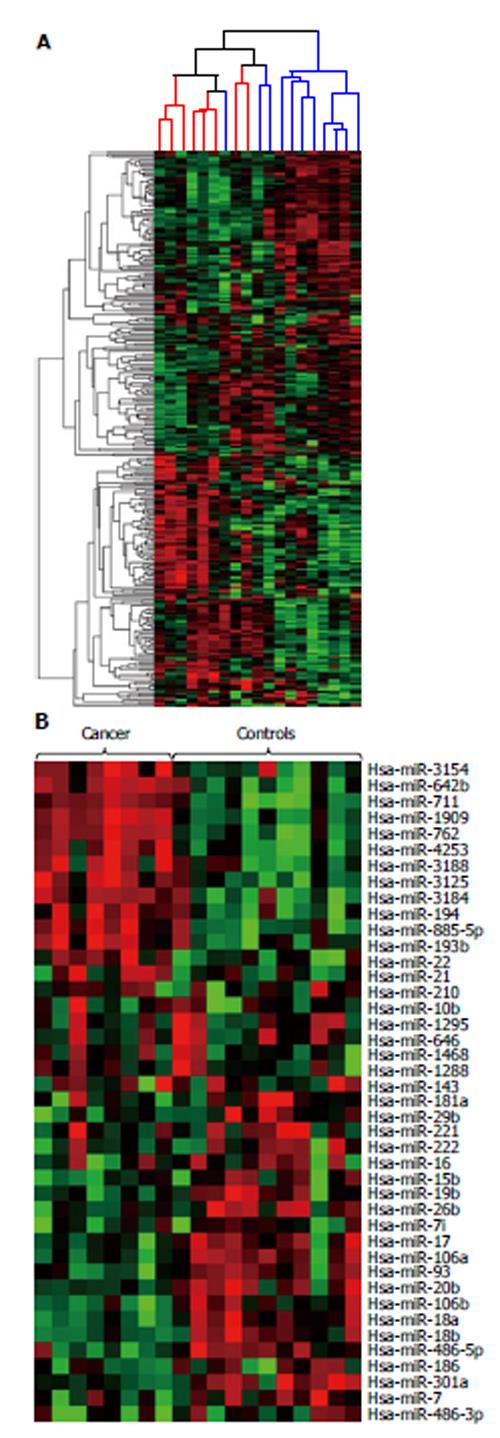
Figure 1 The microarray signature profile of circulating microRNA in pancreatic cancer patients and healthy controls.
A: The unsupervised hierarchical clustering of 290 miRNAs that are differentially expressed among pancreatic cancer patients (n = 8) and healthy controls (n = 11). The dendrogram on top indicates the hierarchical clustering relationship between pancreatic cancer patients (in red) and healthy controls (in blue); B: Heat map depicting the subset of 42 miRNAs chosen for confirmation RT-qPCR study, arranged as indicated. Heat map color scale represents fold increase (red) or decrease (green) from baseline. MiRNA: MicroRNA.
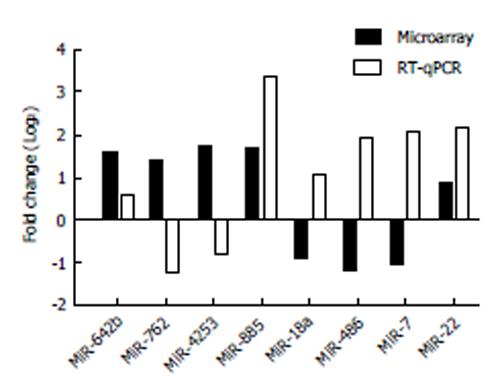
Figure 2 Confirmation study of the expression profile of eight microRNAs.
Microarray (solid bar) and RT-qPCR (open bar) data sets were analyzed based on the “Comparative C(T) Method”, normalized to miR-3196, and calculated as the ratio of mean fold change of pancreatic cancer patients (n = 8) to healthy controls (n = 11). MiRNA: MicroRNA.
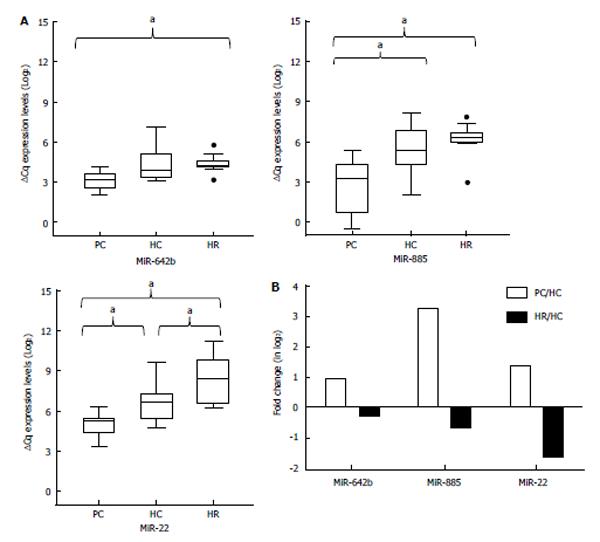
Figure 3 Validation of three-microRNA panel using quantitative real-time reverse transcription polymerase chain reaction.
A: Box plot of relative expression of three miRNAs, based on normalized mean ΔCq values [mean quantification cycle (Cq) normalized to miR-3196] of pancreatic cancer patients (PC, n = 11), healthy controls (HC, n = 11), and high risk controls (HR, n = 11). The whiskers extend to the observations which are no more than 1.5 times the length of the box (interquartile range) away from the box. More extreme observations are considered outliers and are indicated as dots. "a" indicates P value ≤ 0.017 (0.05/3, a Bonferroni-adjusted α-level based on the 3 multiple comparisons performed among patient groups); B: Fold change expression levels of three miRNAs calculated as the ratio of mean fold change of PC/HC and HR/HC. MiRNA: MicroRNA.
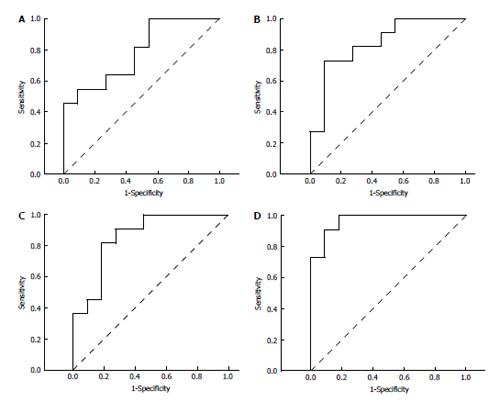
Figure 4 Receiver operating characteristic curve analysis of three microRNAs.
Validation study with 11 stage IIA/IIB pancreatic cancer patients and 11 healthy controls. A: Receiver operating characteristic (ROC) curve for the miR-642b-3p data alone [area under the curve (AUC) = 0.79]; B: ROC curve for the miR-885-5p data alone (AUC = 0.84); C: ROC curve for the miR-22-3p data alone (AUC = 0.86); D: ROC curve for all three miRNAs (miR-642b-3p, -885-5p, 22-3p) as a composite panel (AUC = 0.97). MiRNA: MicroRNA.
- Citation: Ganepola GA, Rutledge JR, Suman P, Yiengpruksawan A, Chang DH. Novel blood-based microRNA biomarker panel for early diagnosis of pancreatic cancer. World J Gastrointest Oncol 2014; 6(1): 22-33
- URL: https://www.wjgnet.com/1948-5204/full/v6/i1/22.htm
- DOI: https://dx.doi.org/10.4251/wjgo.v6.i1.22


