Copyright
©2013 Baishideng Publishing Group Co.
World J Gastrointest Oncol. Dec 15, 2013; 5(12): 222-229
Published online Dec 15, 2013. doi: 10.4251/wjgo.v5.i12.222
Published online Dec 15, 2013. doi: 10.4251/wjgo.v5.i12.222
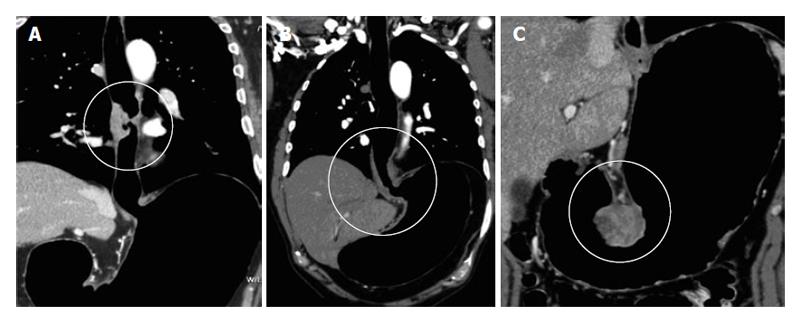
Figure 1 Pneumo-computed tomography in esophageal and gastric neoplasms.
A: Pneumo-computed tomography (PnCT) multiplanar reconstructions (MPR) coronal soft tissue window reconstruction depicting involvement of mid-thoracic esophagus. Note detailed demonstration of location; B: PnCT MPR coronal soft tissue window reconstruction depicting involvement of the gastroesophageal junction; C: PnCT MPR coronal soft tissue window shows a GIST tumor arising from gastric wall.
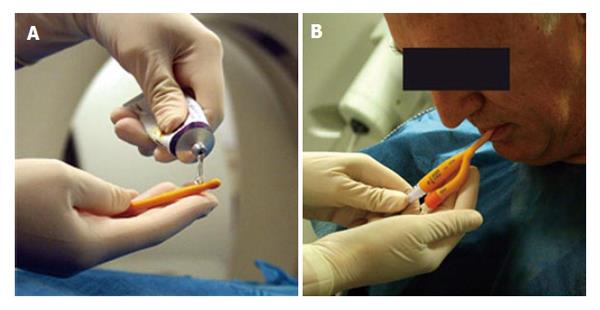
Figure 2 Pneumo-computed tomography technique.
A: The tip of the Foley catheter is lubricated with gel anesthesia; B: The Foley catheter is introduced transorally.
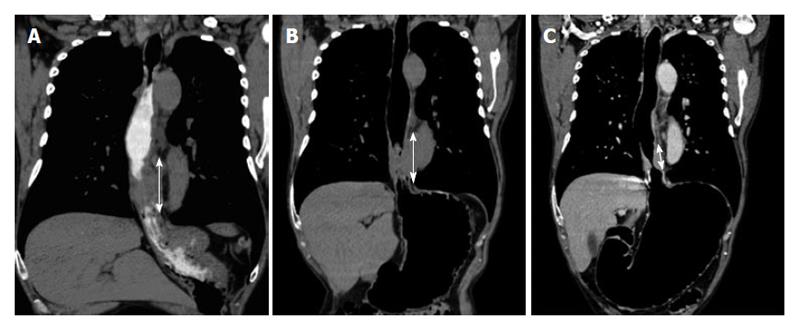
Figure 3 Comparison of different distention options in the same patient with diagnosis of adenocarcinoma.
A: Distension with positive oral contrast, the double arrow shows the extent of the lesion, which is larger than b and c, thus overestimating the neoplasm size; B: Distension with effervescent granules, the double arrow shows the tumor extent which is larger than c, still overestimating its size; C: Distension with pneumo-computed tomography technique, the double arrow shows the extent of the wall thickening which is shorter than a and b in accordance with the surgical specimen.
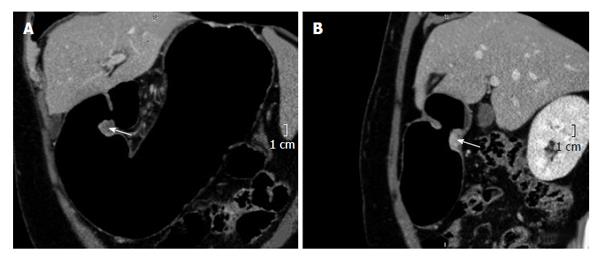
Figure 4 Adenocarcinoma of the pylorus.
A: Coronal multiplanar reconstructions (MPR) reconstruction, the arrow shows the tumor and its relationship with the pylorus; B: Sagital MPR reconstruction, the arrow shows the tumor and its relationship with the pylorus.
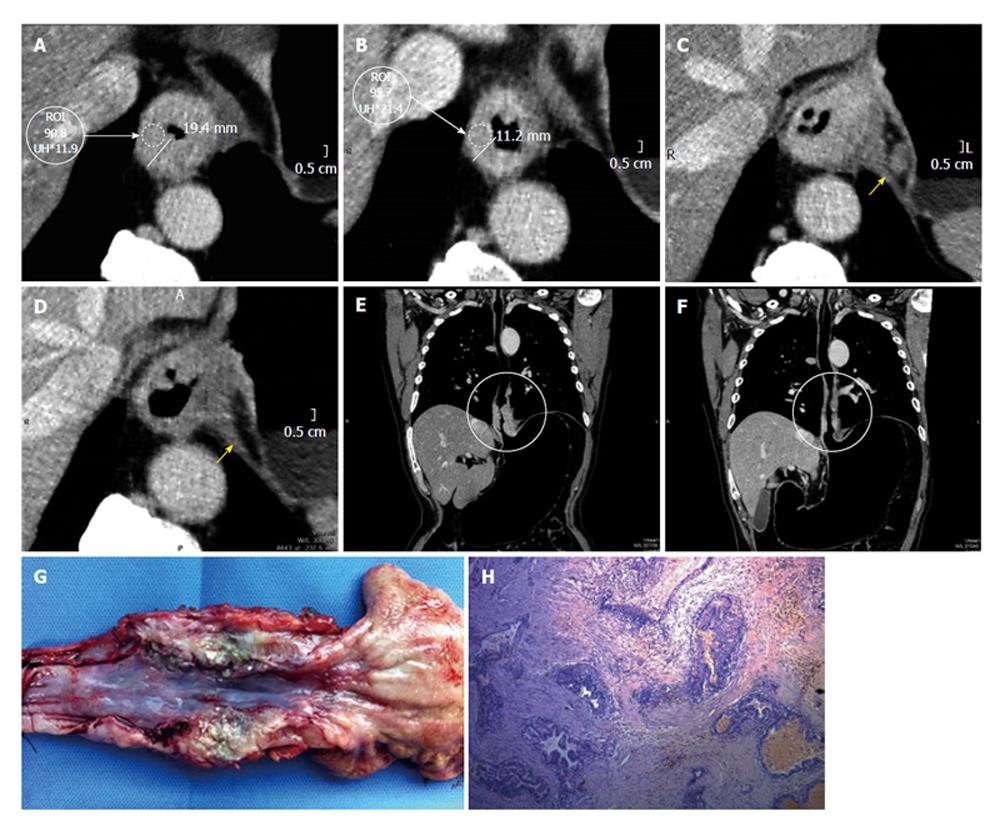
Figure 5 Advanced adenocarcinoma.
Dworak grade I, prevalence of active cells. A: Axial pre neoadjuvant therapy image. Both wall thickness and density are measured; B: Axial post-neoadjuvant therapy image reveals persistence of the wall thickening and almost no variation in density; C: Axial pre-neoadjuvant therapy image, the arrow is pointing to a lymphadenopathy; D: Axial post-neoadjuvancy image reveals resolution of the adenopathy; E: Coronal multiplanar reconstructions (MPR) pre-neoadjuvancy reconstruction. The circle shows the long axis compromise of the tumor; F: Coronal MPR post-therapy reconstruction. The circle shows the long axis of the tumor and its precise location; G: Surgical specimen of total esophagectomy and upper polar gastrectomy. Open piece shows an important thickening of the lower esophagus, at squamo-columnar junction recognizes a polypoid lesion and poorly defined borders. The remaining gastric mucosa presents edematous folds; H: Section shows at gastroesophageal junction one degrade injuries ranging from low-grade dysplasia to invasive adenocarcinoma. The primary lesion is below the squamocolumnar junction. Generally infiltrates shaped surface (submucosa) with occasional foci in muscle layer and extends in the form of multiple separate foci below esophageal epithelium. Proximal margin: adenocarcinoma foci observed at adventitia and submucosa layers. Tumor is seen infiltrating striated muscle tissue.
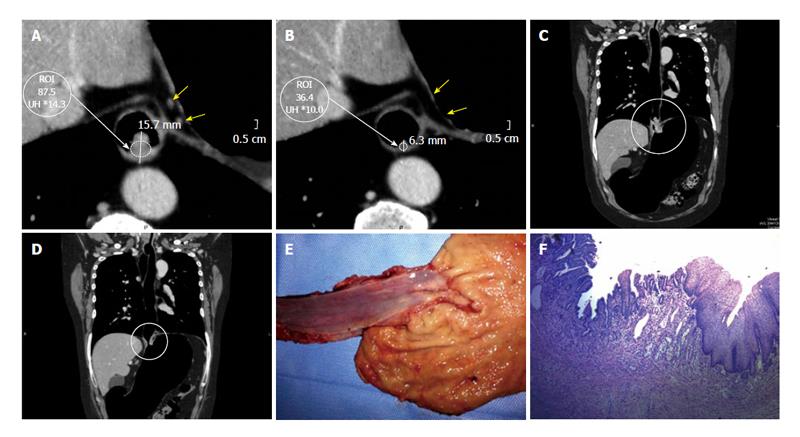
Figure 6 Advanced adenocarcinoma of the gastroesophageal junction.
Dworak grade 2, large areas of fibrosis or necrosis with active cells. A: Axial pre-therapy image. Both wall thickness and density are measured. Yellow arrows indicate two small lymph nodes; B: Axial post-therapy image reveals a clear decrease of tumor size and in density. Lymph nodes are not visible; C: Coronal multiplanar reconstructions (MPR) pre-therapy reconstruction. The circle shows the long axis of the tumor; D: Coronal MPR after therapy reconstruction. Note marked decrease in tumor size; E: Surgical specimen of total esophagectomy and upper polar gastrectomy correlating well with the lesion demonstrated with pneumo-computed tomography. Open piece, is recognized at the level of the gastro-esophageal junction an indurated area with diminished mucosal folds and elevated edges with whitish nodule and firm consistency; F: Submucosal layer with nodular accumulations of atypical epithelial cells scant cytoplasm that are arranged in small tubular structures, cords or dispersed. Nodules are found at the distal esophagus and cardia underlying mucosa. Linfovasculares tumor emboli are observed. In small area is observed submucosal fibrosis, chronic inflammation and congestion. At the level of the gastroesophageal junction is observed extensive intestinal metaplasia to intramucosal carcinoma focus. Preserved oxyntic gastric mucosa.
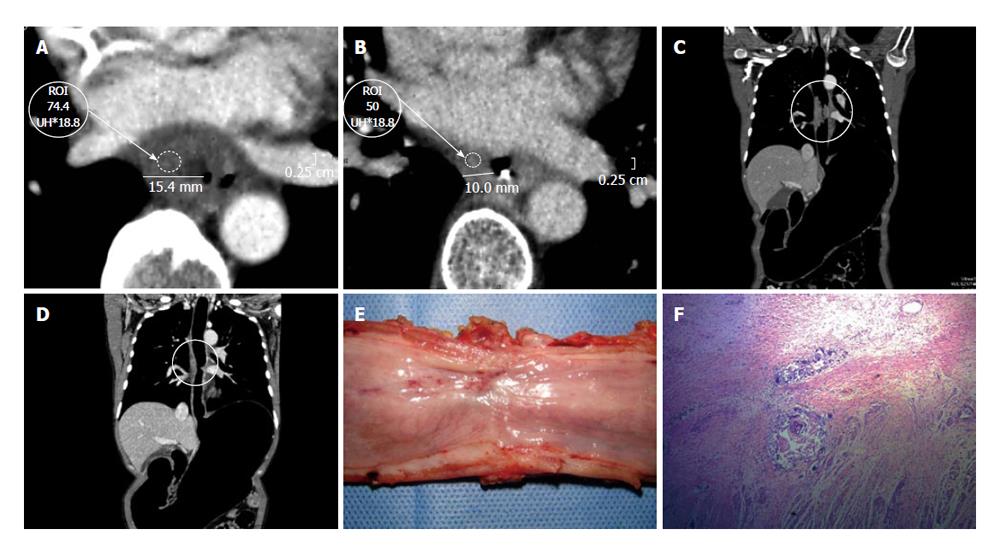
Figure 7 Epidermoid carcinoma.
Dworak grade 3, scarce neoplastic cells. A: Axial pre-neoadjuvant therapy image. Both wall thickness and density are measured; B: Axial post- neoadjuvant therapy image reveals a clear decrease of the wall thickening and density; C: Coronal multiplanar reconstructions (MPR) pre-neoadjuvant therapy reconstruction. The circle shows the long axis of the tumor; D: Coronal MPR post-neoadjuvant therapy reconstruction with decrease in tumor size; E: Surgical specimen of total esophagectomy. Open piece, shows thickening at the middle third of the esophagus with an ulcerated area; F: The sections shows at submucosal layer a nodular accumulation of atypical epithelial cells with vesicular nuclei and scant cytoplasm that are arranged in small tubular structures. Also the submucosa presents fibrosis, chronic inflammation and congestion. Mucosal layer shows conserved squamous epithelium and focal fibrosis regression suggesting changes.
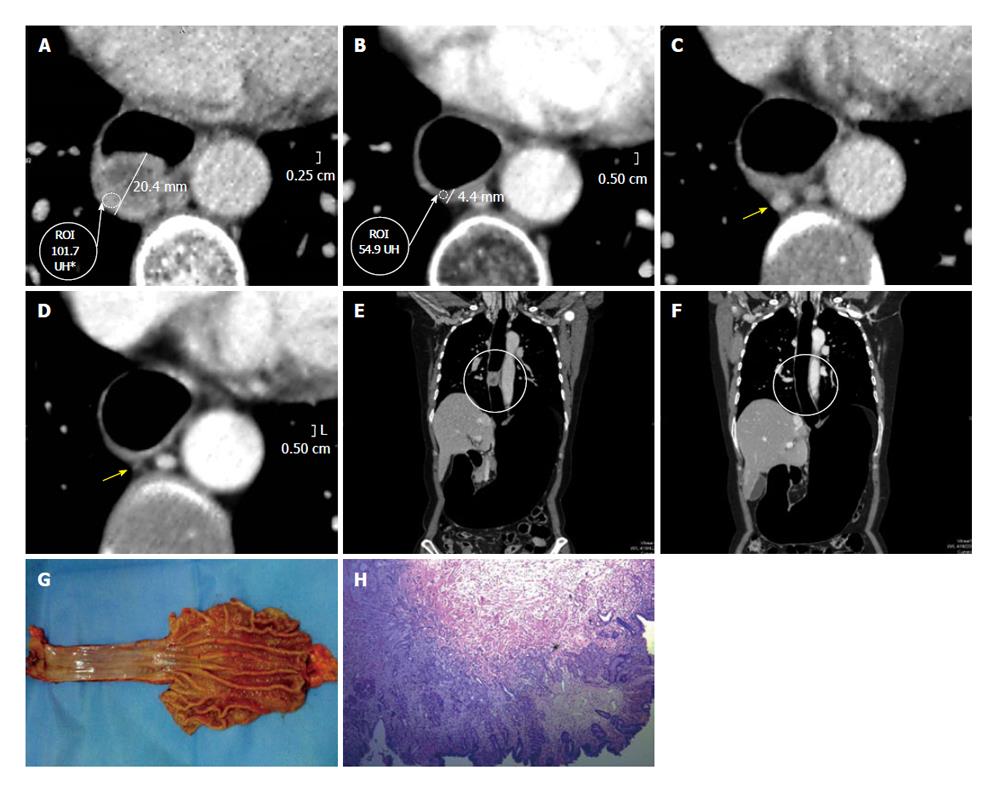
Figure 8 Epidermoid carcinoma of the thoracic esophagus [CME #5].
Dworak grade 4, absence of tumor cells. A: Axial pre-neoadjuvant therapy image. Both wall thickness and density are measured; B: Axial post- neoadjuvant therapy image reveals a clear decrease of the wall thickening and density; C: Axial pre- neoadjuvant therapy image, the arrow is pointing to adenopathy; D: Axial post-neoadjuvancy image reveals disappearance of adenopathy; E: Coronal multiplanar reconstructions (MPR) pre-neoadjuvant therapy reconstruction. The circle shows the long axis of the tumor; F: Coronal MPR reconstruction post- neoadjuvant therapy. The neoplasm is not longer detected; G: Surgical specimen of total esophagectomy and upper polar gastrectomy. Open piece, is recognized at the level of the gastro-esophageal junction an area of white-depressed with elevated edges; H: Squamous epithelium with acanthosis, conserved cell polarity. Fibrohialinosis in lamina propria and submucosa with lymphocytic infiltrate. Absence of atypical cells. At the level of the gastroesophageal junction shows a sector with intestinal metaplasia in the stomach side, negative for dysplasia.
- Citation: Ulla M, Gentile E, Yeyati EL, Diez ML, Cavadas D, Garcia-Monaco RD, Ros PR. Pneumo-CT assessing response to neoadjuvant therapy in esophageal cancer: Imaging-pathological correlation. World J Gastrointest Oncol 2013; 5(12): 222-229
- URL: https://www.wjgnet.com/1948-5204/full/v5/i12/222.htm
- DOI: https://dx.doi.org/10.4251/wjgo.v5.i12.222


