
















Copyright: ©Author(s) 2026.
World J Gastrointest Oncol. Aug 15, 2026; 18(8): 123710
Published online Aug 15, 2026. doi: 10.4251/wjgo.123710
Published online Aug 15, 2026. doi: 10.4251/wjgo.123710
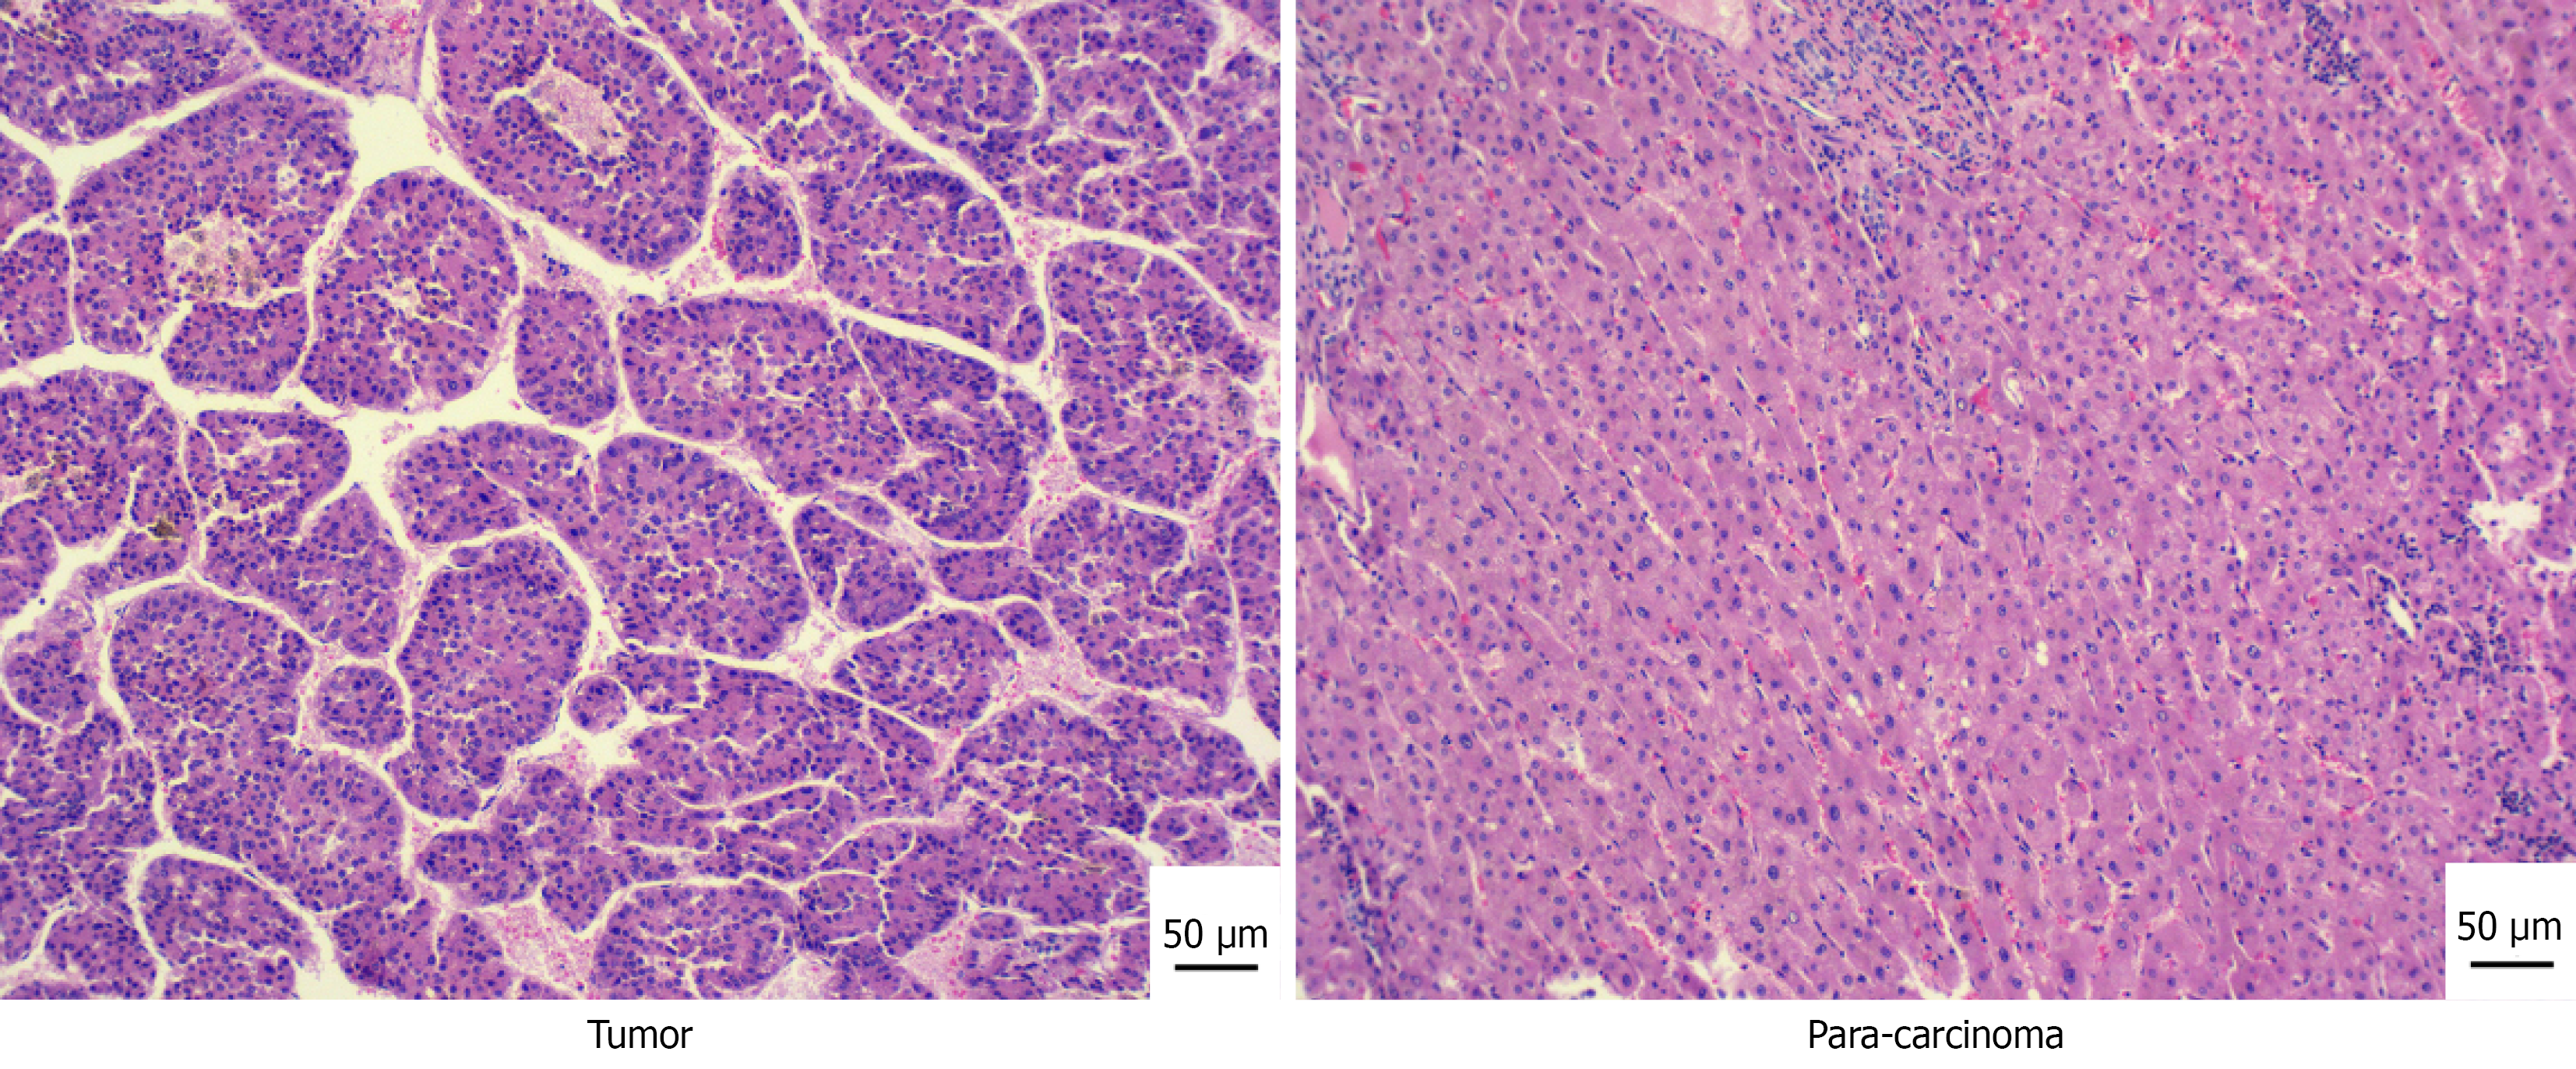
Figure 1 Hematoxylin and eosin staining of human hepatocellular carcinoma and paracancer tissue.
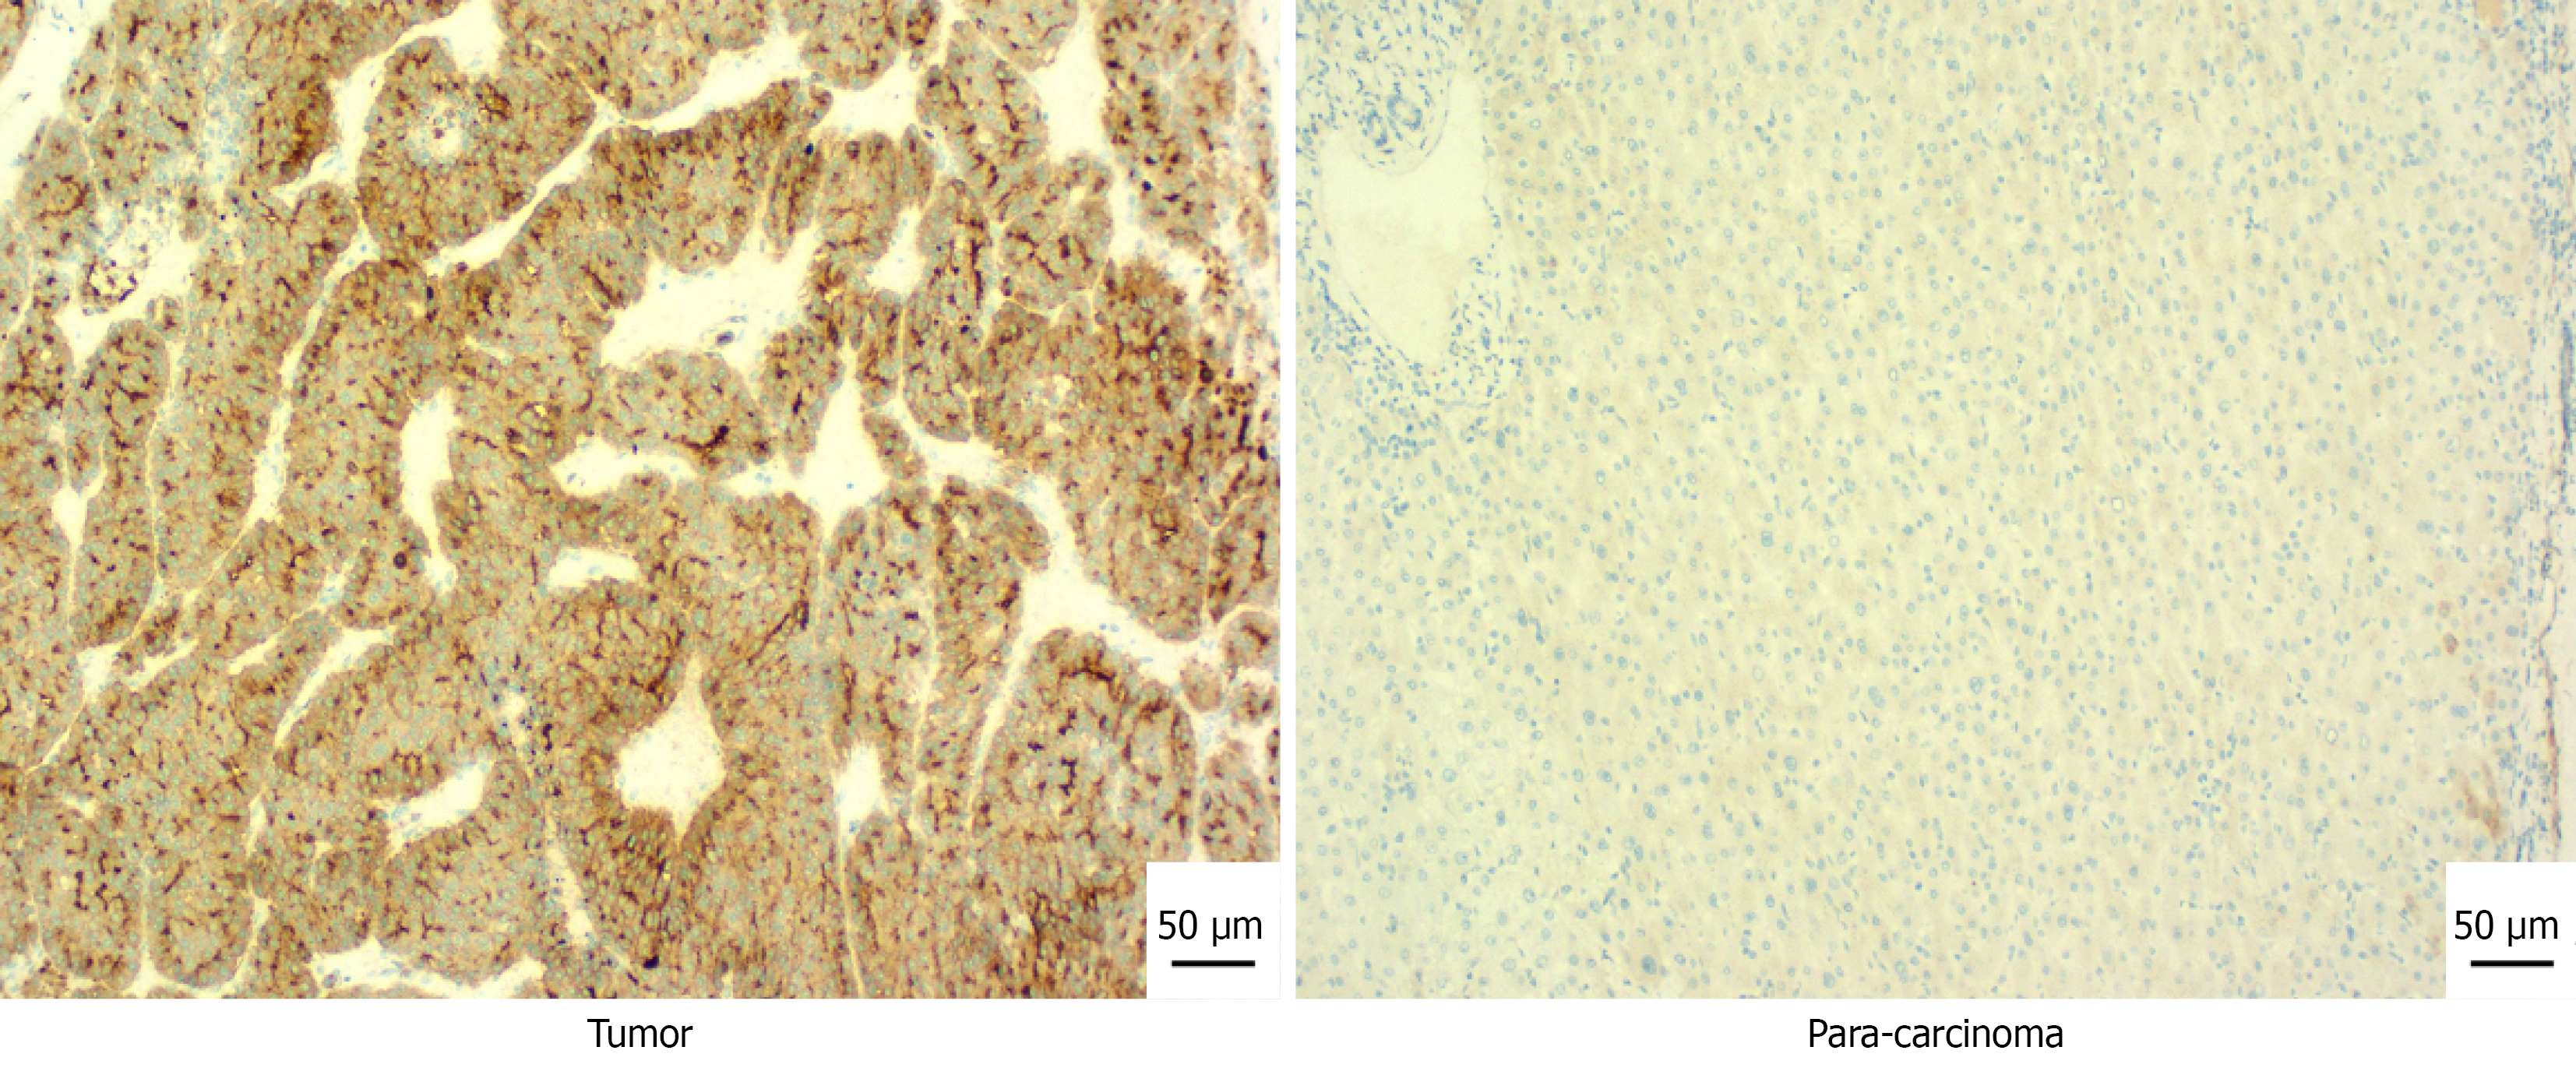
Figure 2 Expression of tensin 4 protein in human hepatocellular carcinoma and paracancer tissues was detected by immuno
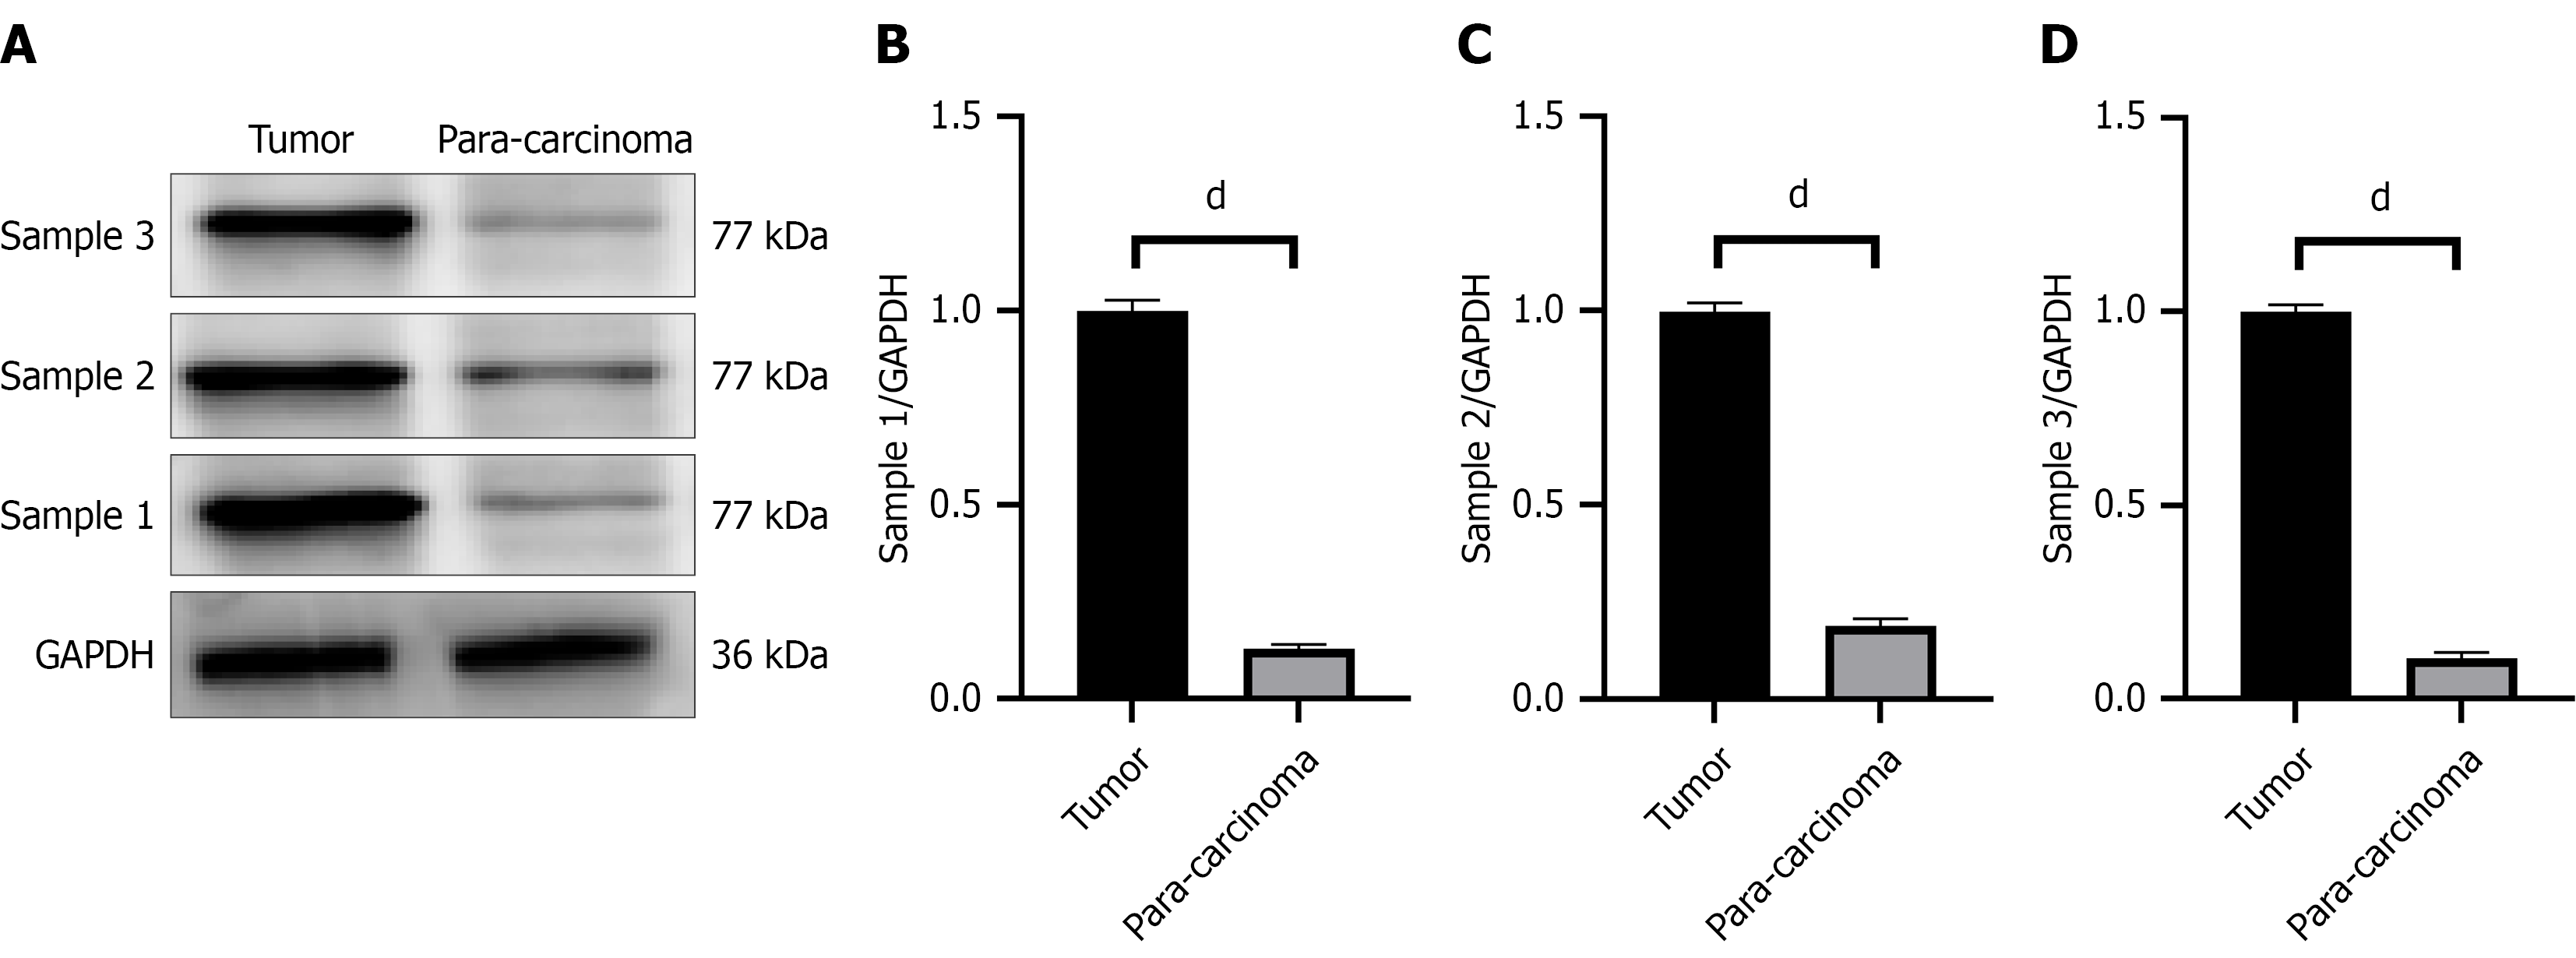
Figure 3 Expression of TNS4 in hepatocellular carcinoma detected by western blotting.
A: Tensin 4 protein expression in hepatocellular carcinoma and adjacent tissues determined by western blotting; B-D: Tensin 4 protein expression in hepatocellular carcinoma and adjacent tissues of Samples 1-3 by western blotting. dP < 0.0001.
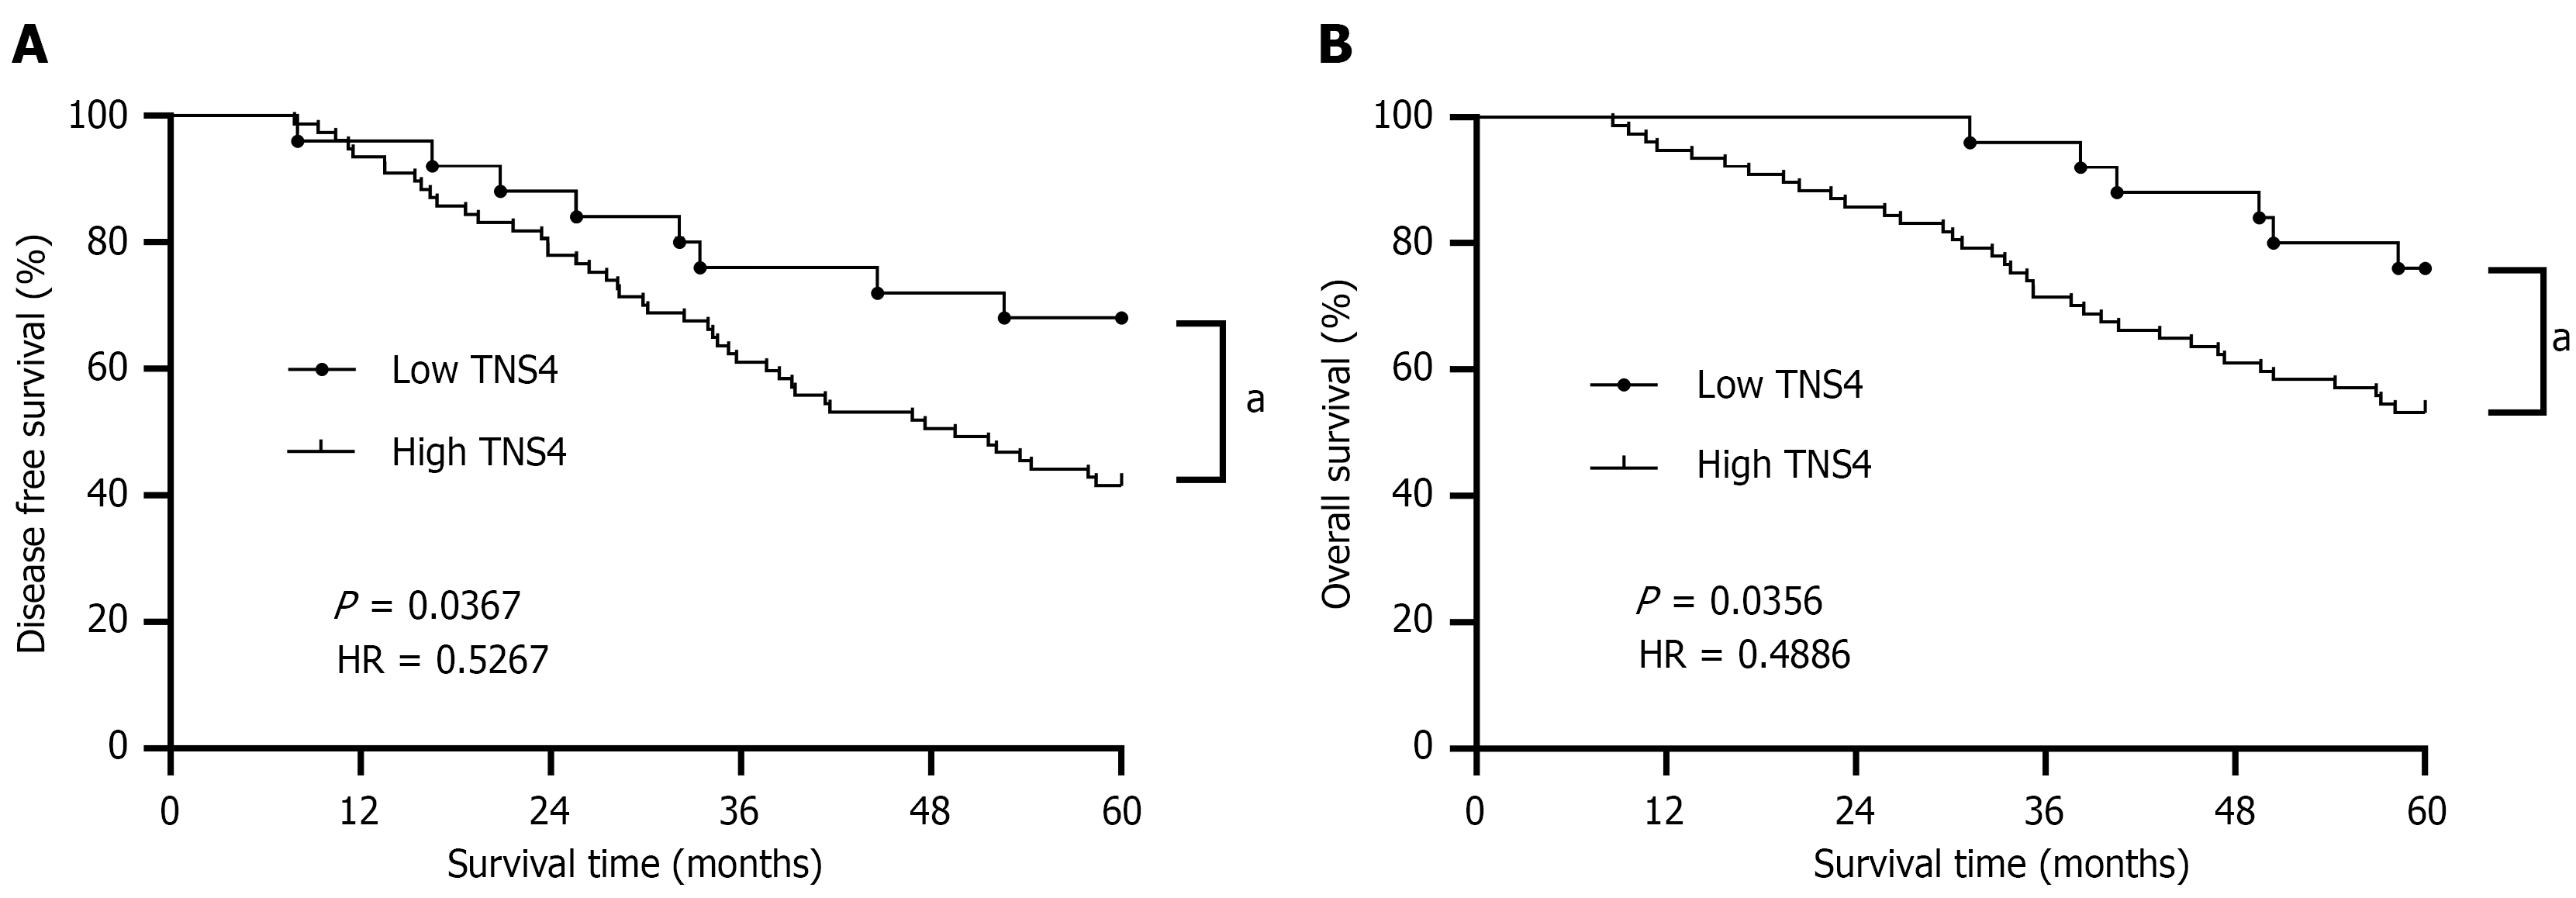
Figure 4 Correlation between tensin 4 expression and prognosis of patients with hepatocellular carcinoma.
A: Relationship between tensin 4 expression level and postoperative tumor-free survival in patients with hepatocellular carcinoma; B: Relationship between tensin 4 expression level and overall survival rate of patients with hepatocellular carcinoma. aP < 0.05. TNS4: Tensin 4; HR: Hazard ratio.
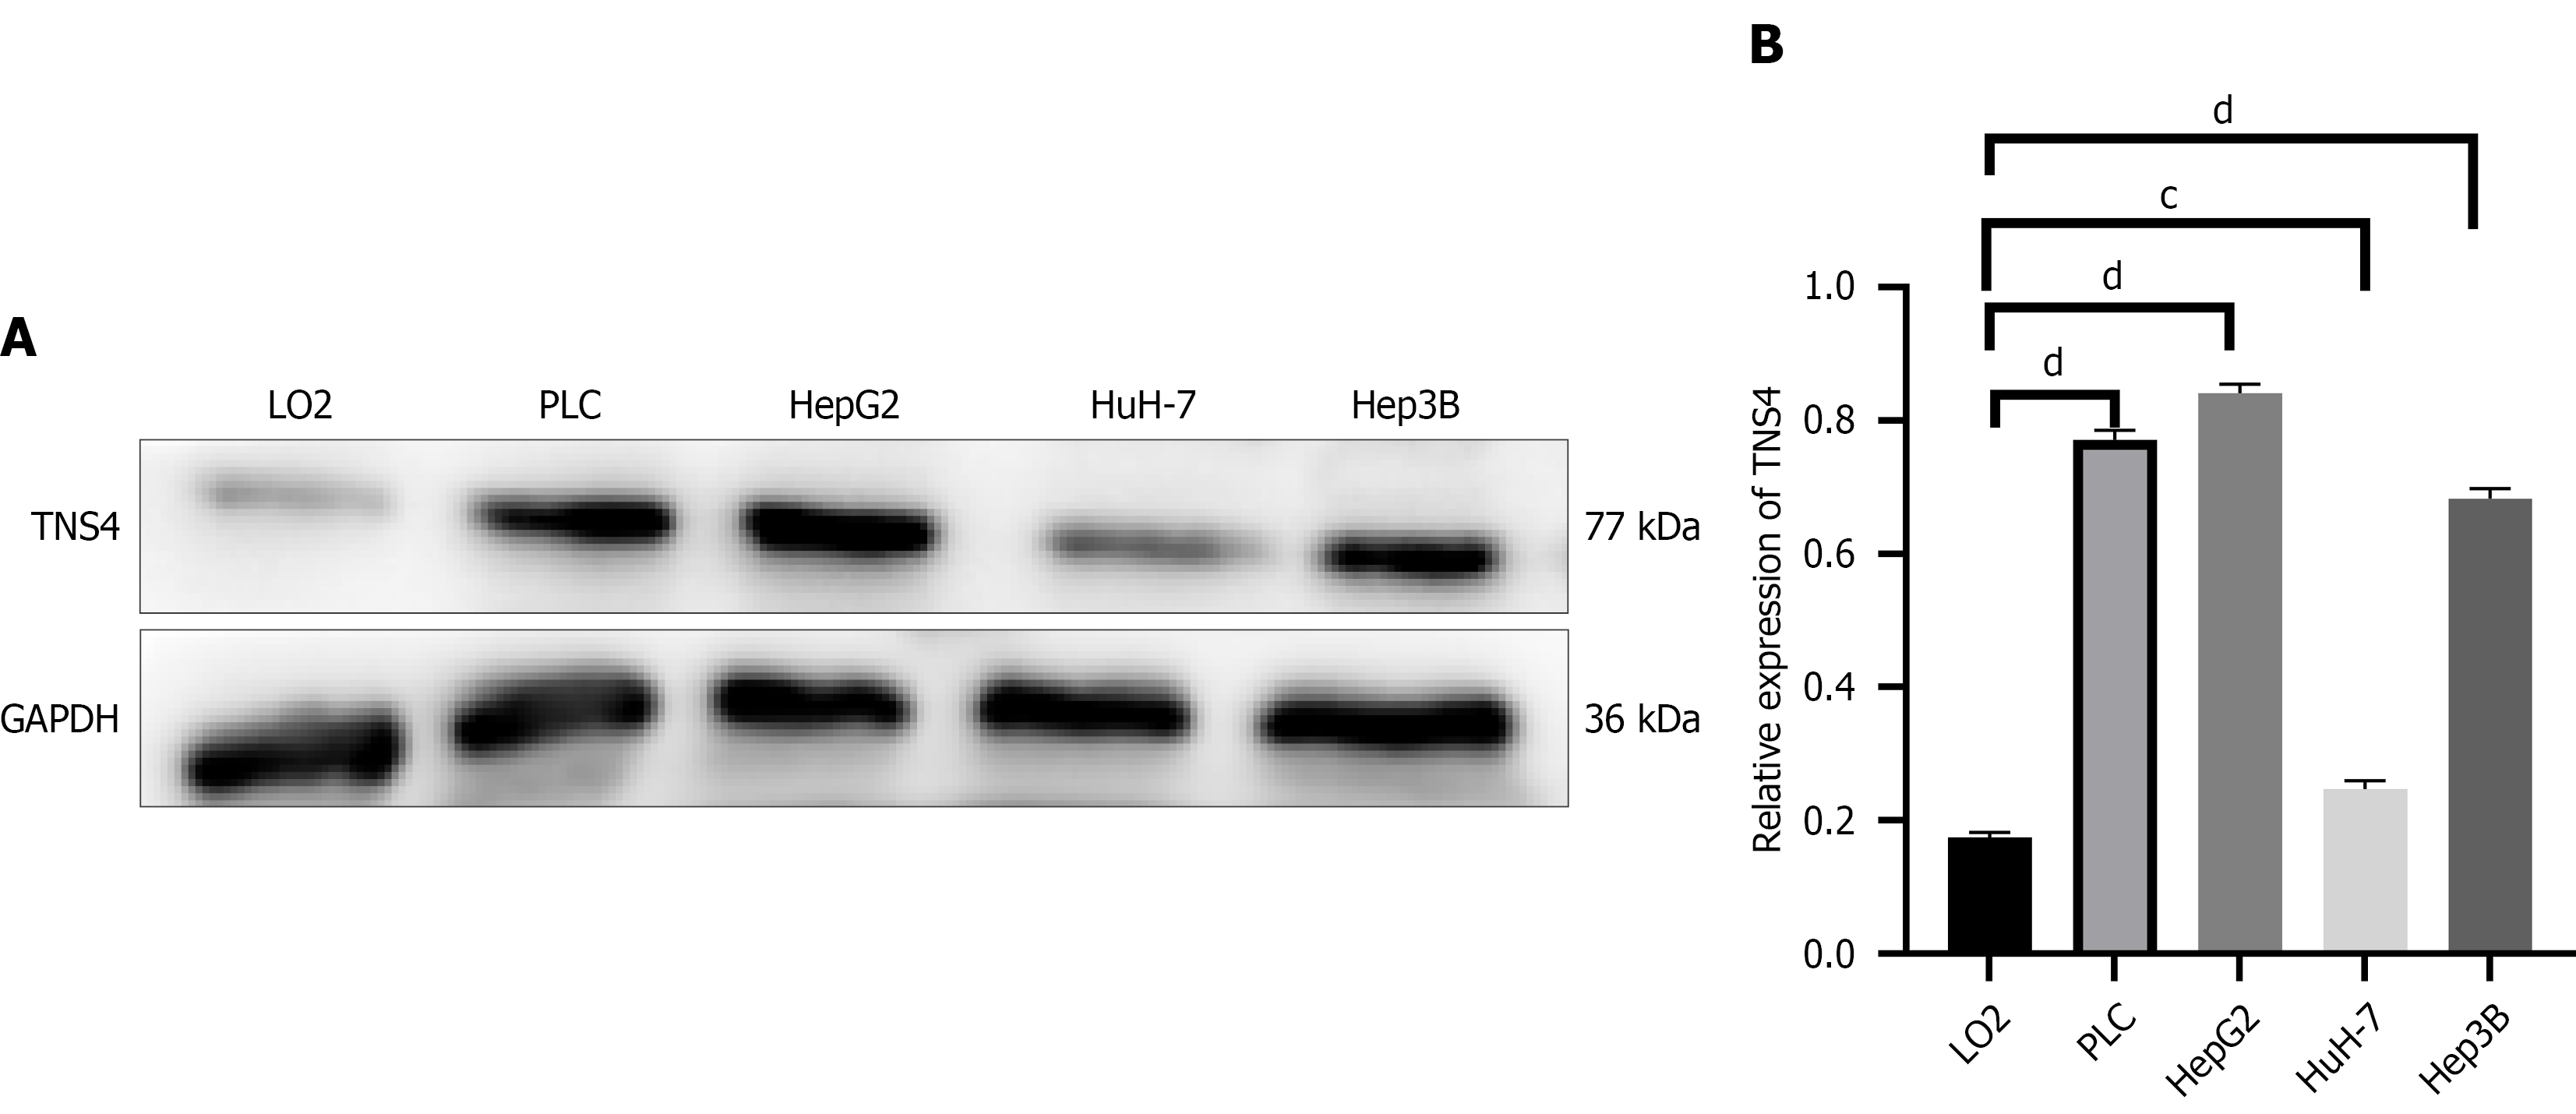
Figure 5 Expression of tensin 4 in different hepatoma cell lines.
A: Expression of tensin 4 protein in normal liver LO2 cell lines and hepatoma cell lines (PLC, HepG2, HuH-7 andHep3B); B: Expression of tensin 4 in each cell line was detected by western blotting. cP < 0.001, dP < 0.0001. TNS4: Tensin 4.
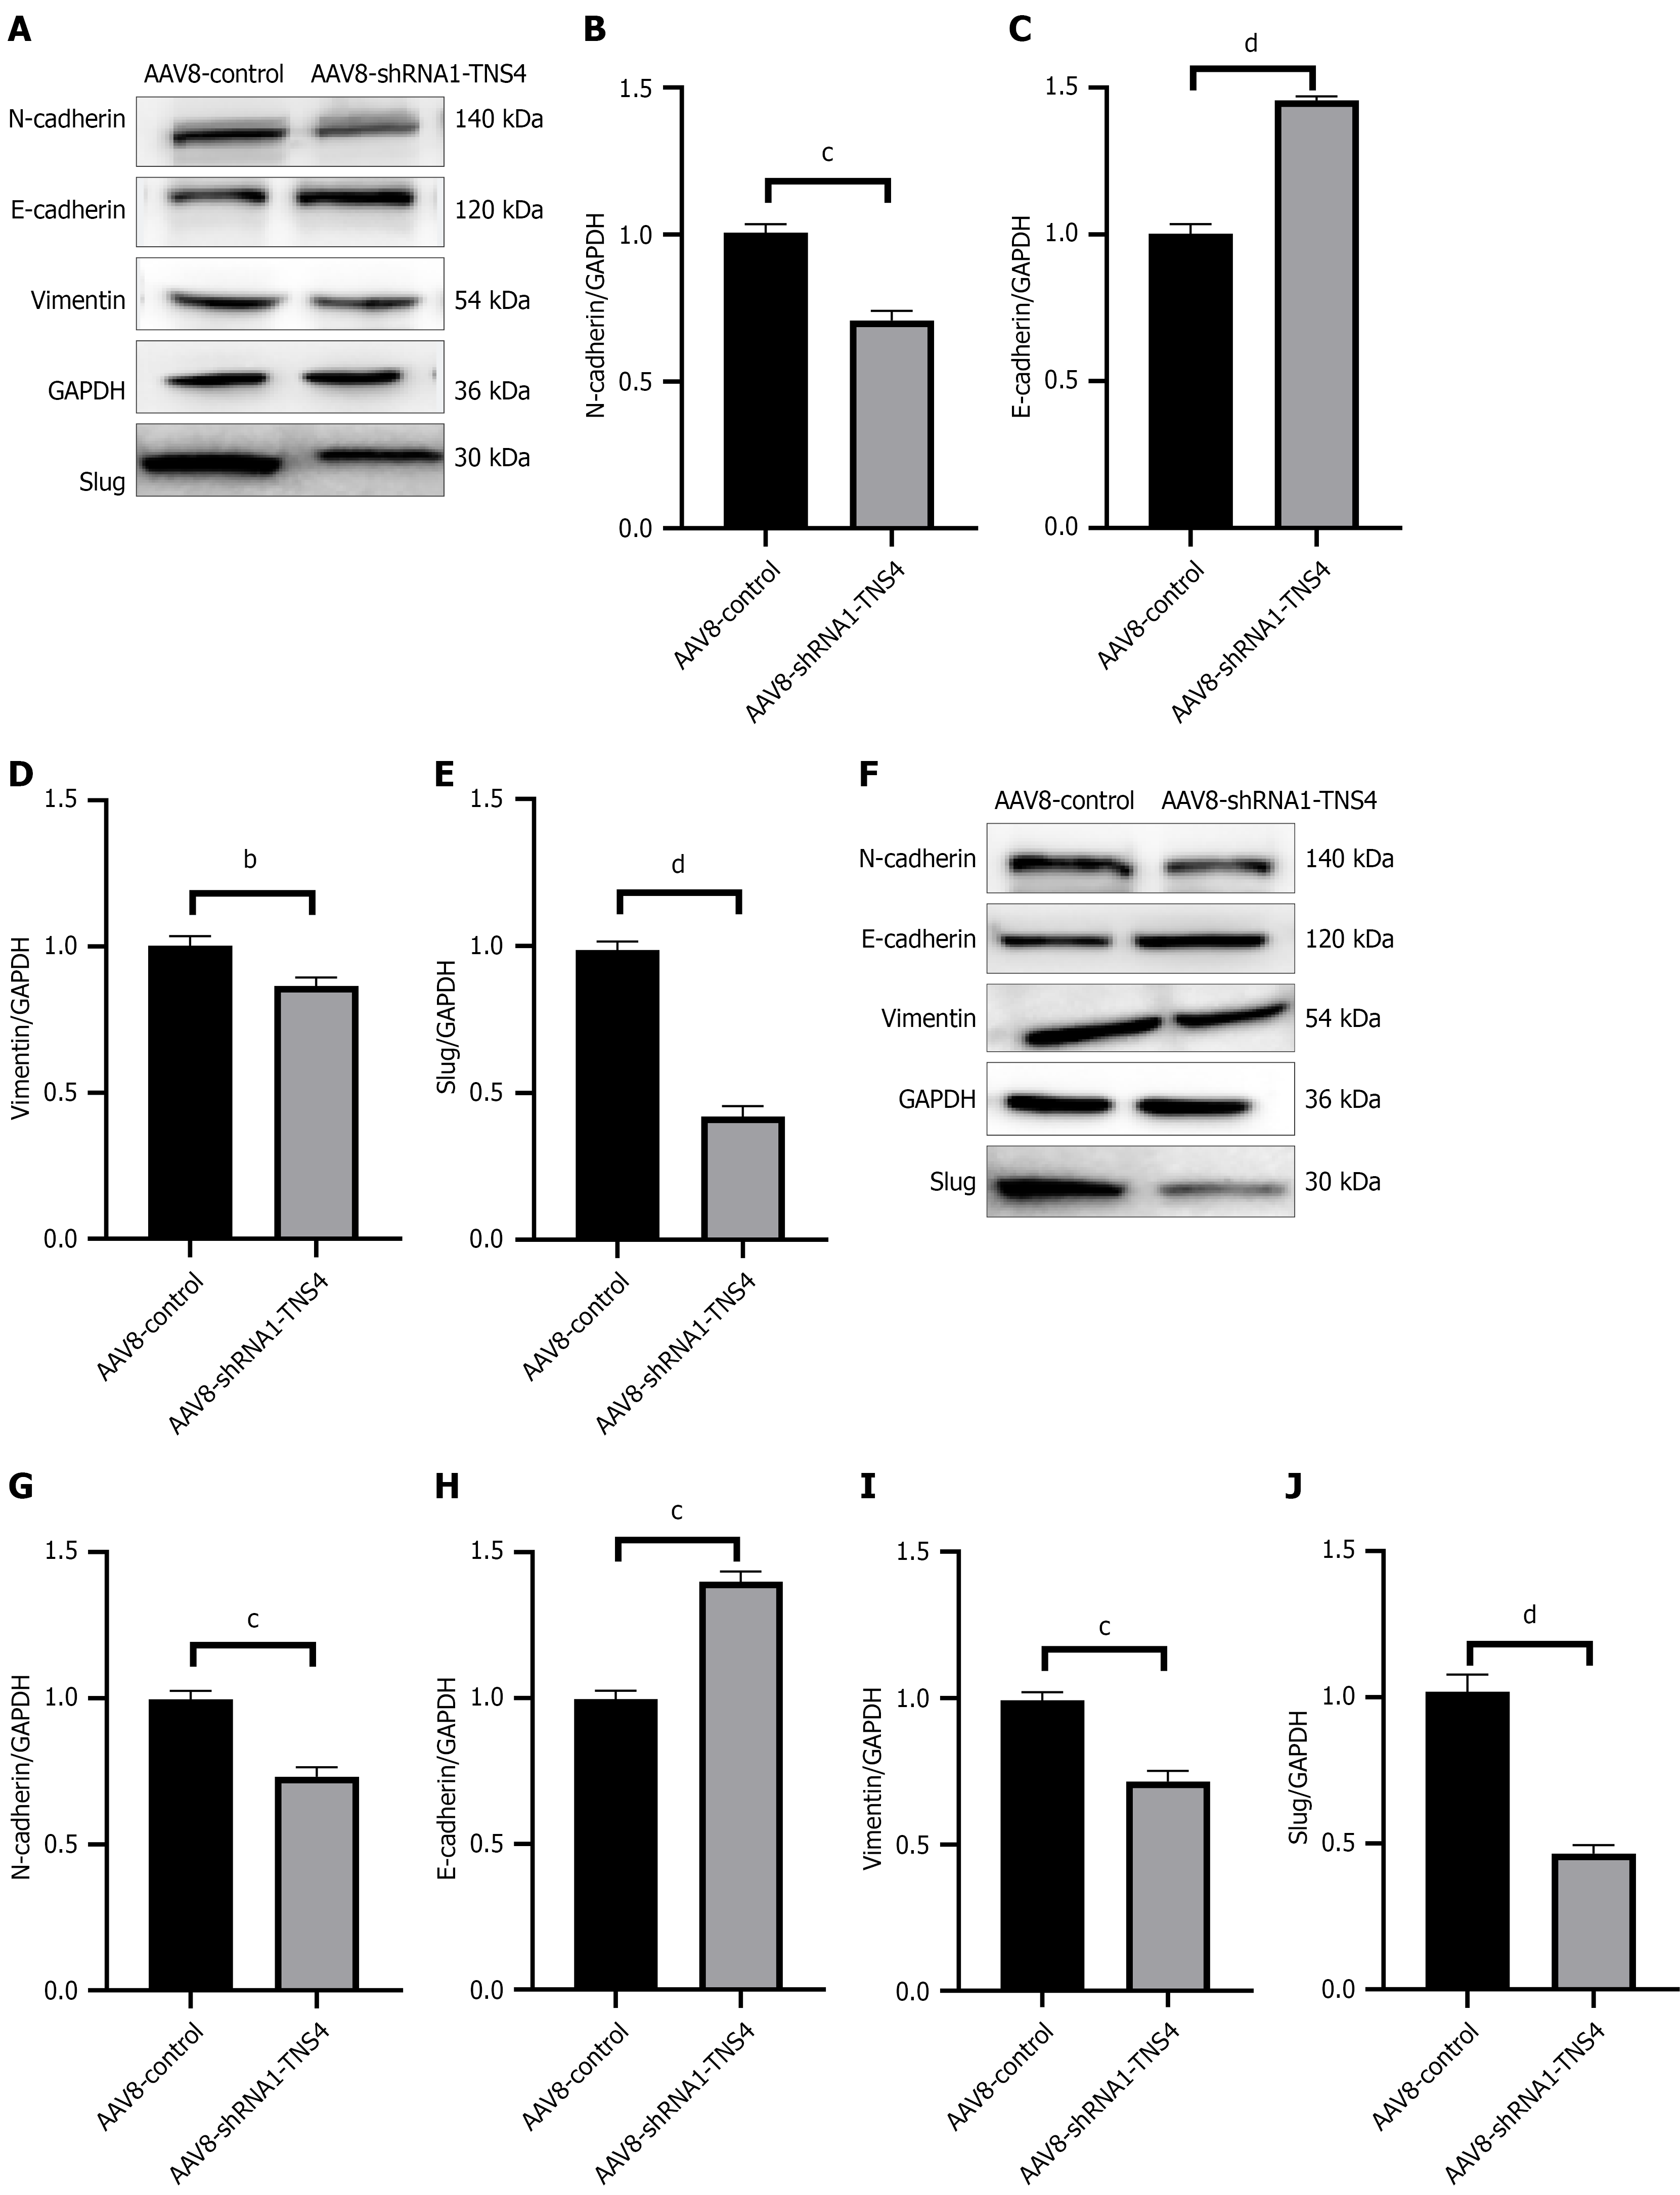
Figure 6 Effects of tensin 4-shRNA transfection on epithelial-mesenchymal transition-related protein expression in HepG2 and PLC cells.
A: Influence of tensin (TNS)4-shRNA transfection on epithelial-mesenchymal transition-related protein expression in HepG2 cells, measured by western blotting; B-E: TNS4-shRNA1 transfection significantly downregulated expression of N-cadherin, vimentin and Slug, and upregulated E-cadherin expression in HepG2 cells; F: Influence of TNS4-shRNA transfection on epithelial-mesenchymal transition-related protein expression in PLC cells, measured by western blotting; G-J: TNS4-shRNA1 transfection exerted consistent regulatory effects in PLC cells, with downregulation of N-cadherin, vimentin and Slug and upregulation of E-cadherin. bP < 0.01, cP < 0.001, dP < 0.0001. TNS4: Tensin 4; AAV: Adeno-associated virus.
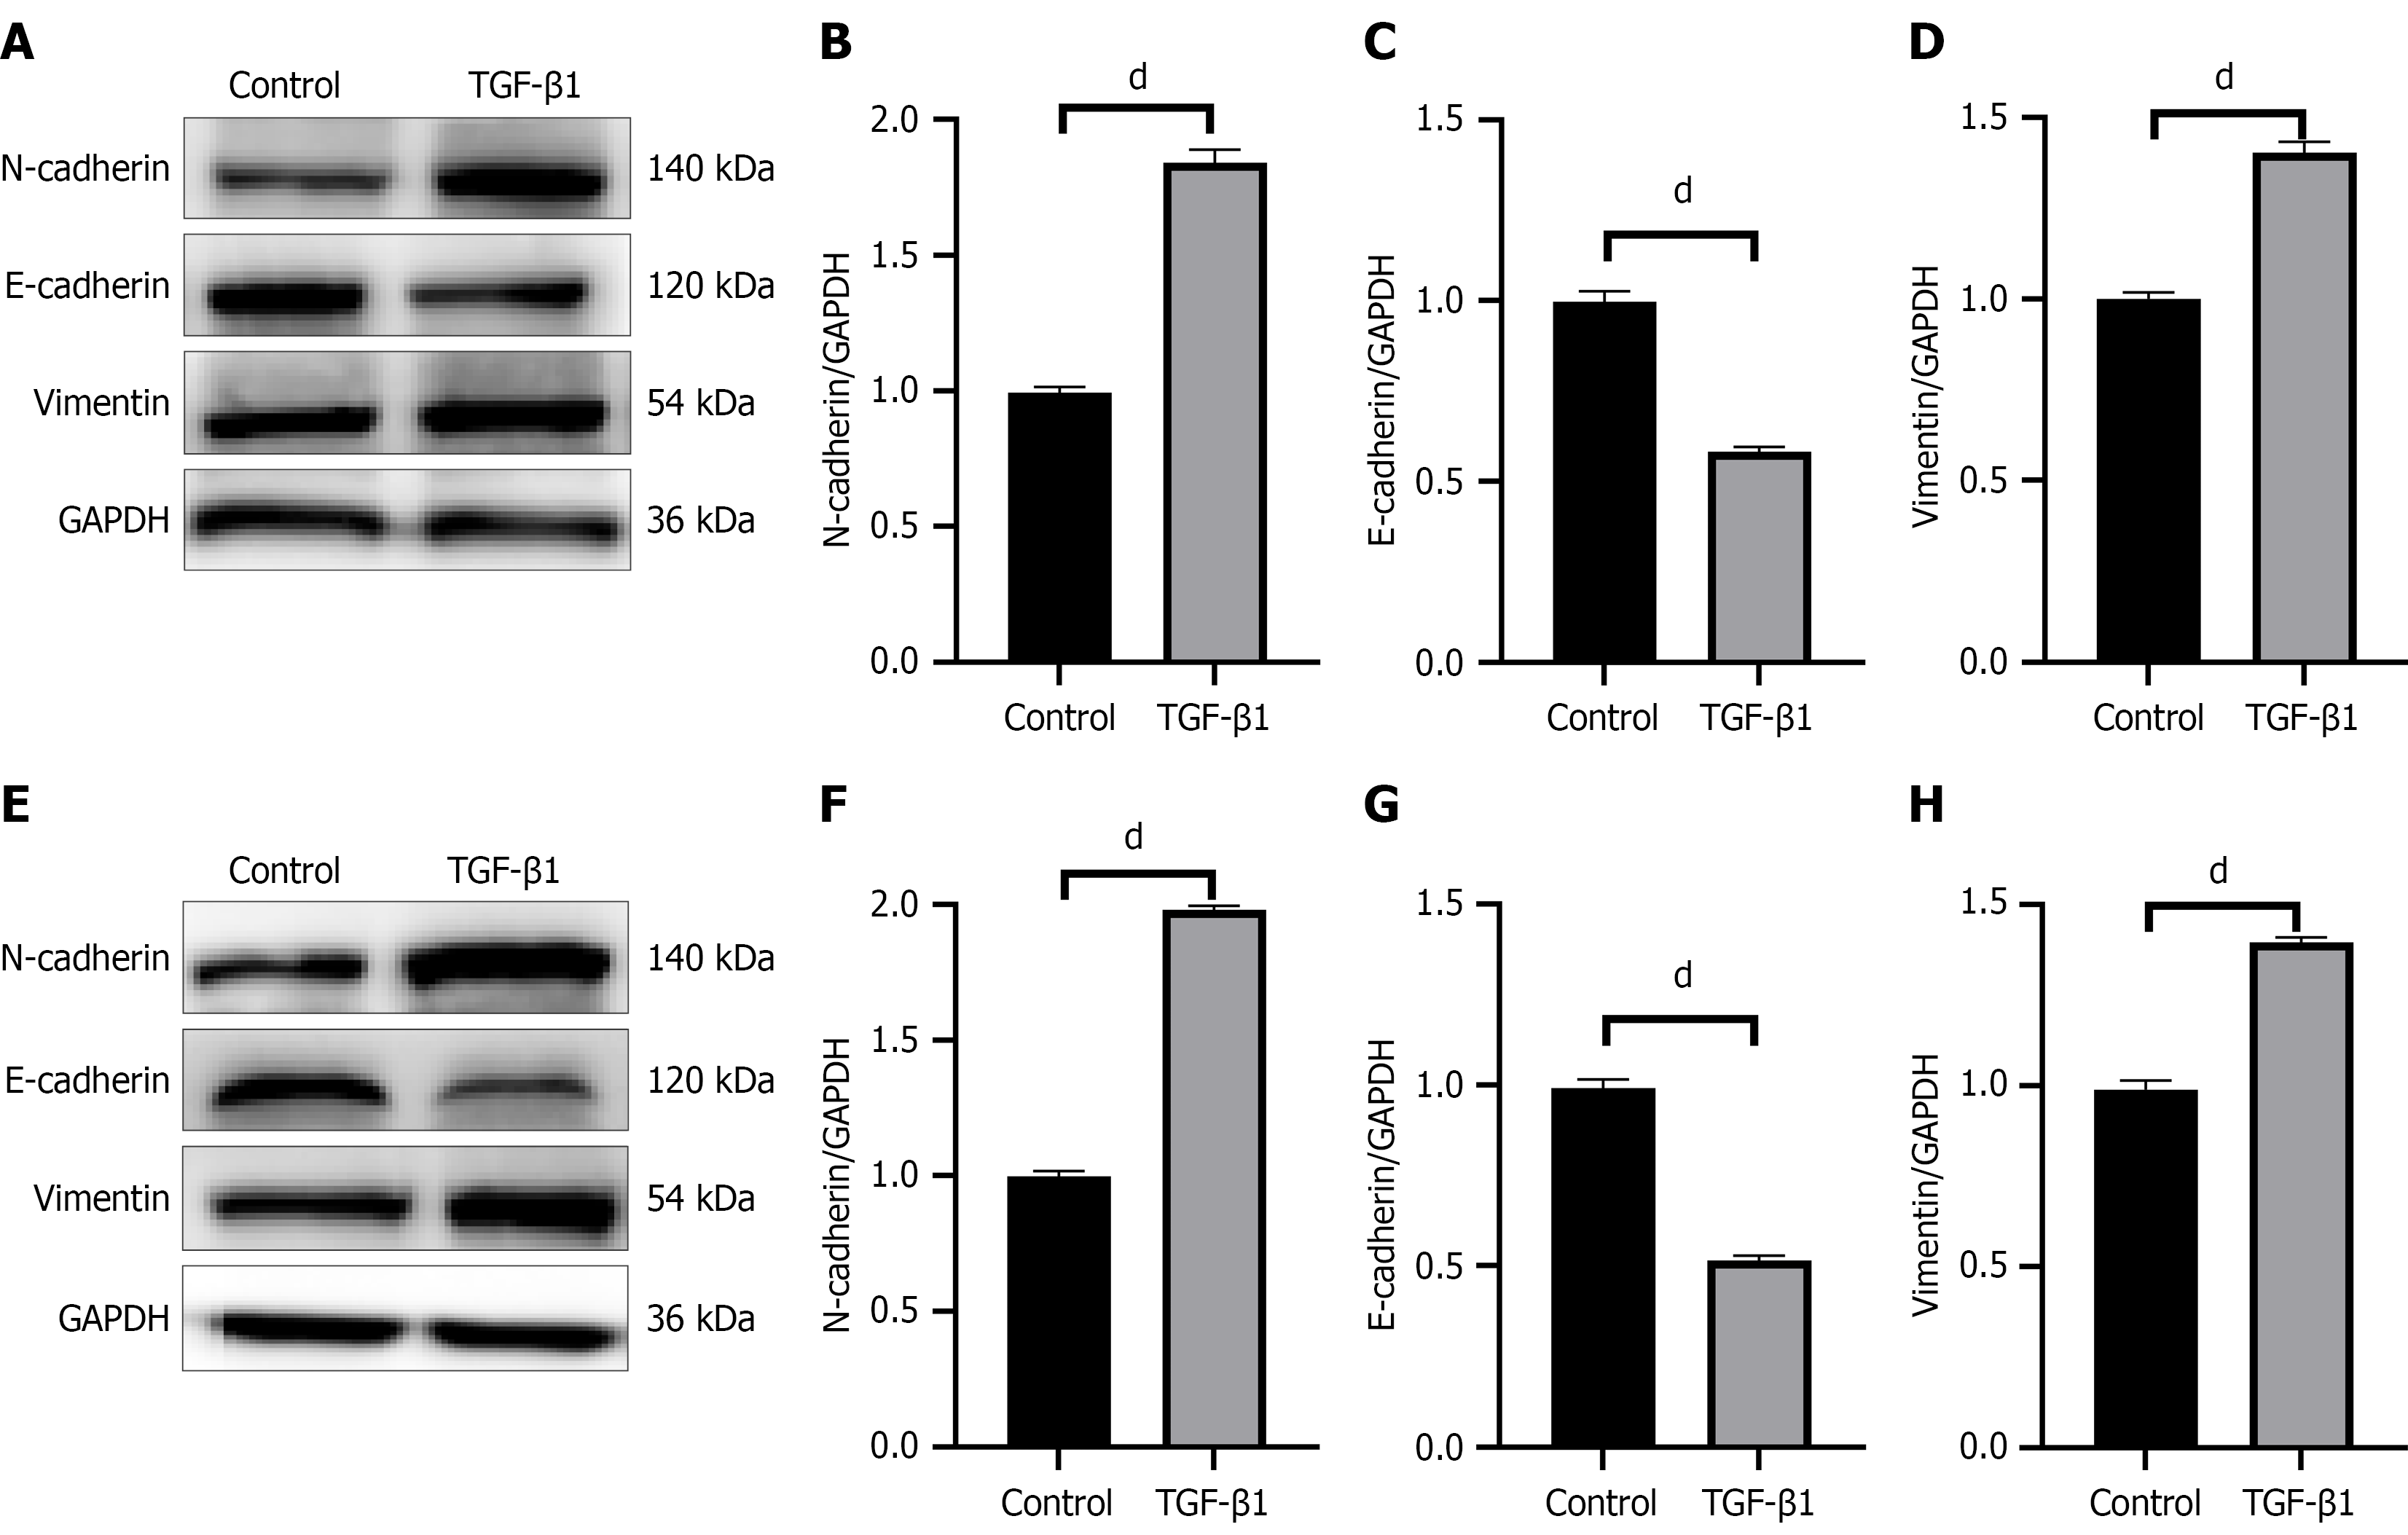
Figure 7 Effects of transforming growth factor-β1 on epithelial-mesenchymal transition-related protein expression in HepG2 and PLC cells.
A: Influence of transforming growth factor (TGF)-β1 on epithelial-mesenchymal transition (EMT)-related protein expression in HepG2 cells detected by western blotting; B-D: TGF-β1 significantly upregulated expression of N-cadherin and vimentin, and downregulated E-cadherin expression in HepG2 cells; E: Influence of TGF-β1 on EMT-related protein expression in PLC cells detected by western blotting; F-H: TGF-β1 induced consistent changes in expression of the aforementioned EMT-related proteins in PLC cells. dP < 0.0001. TGF-β1: Transforming growth factor-β1.
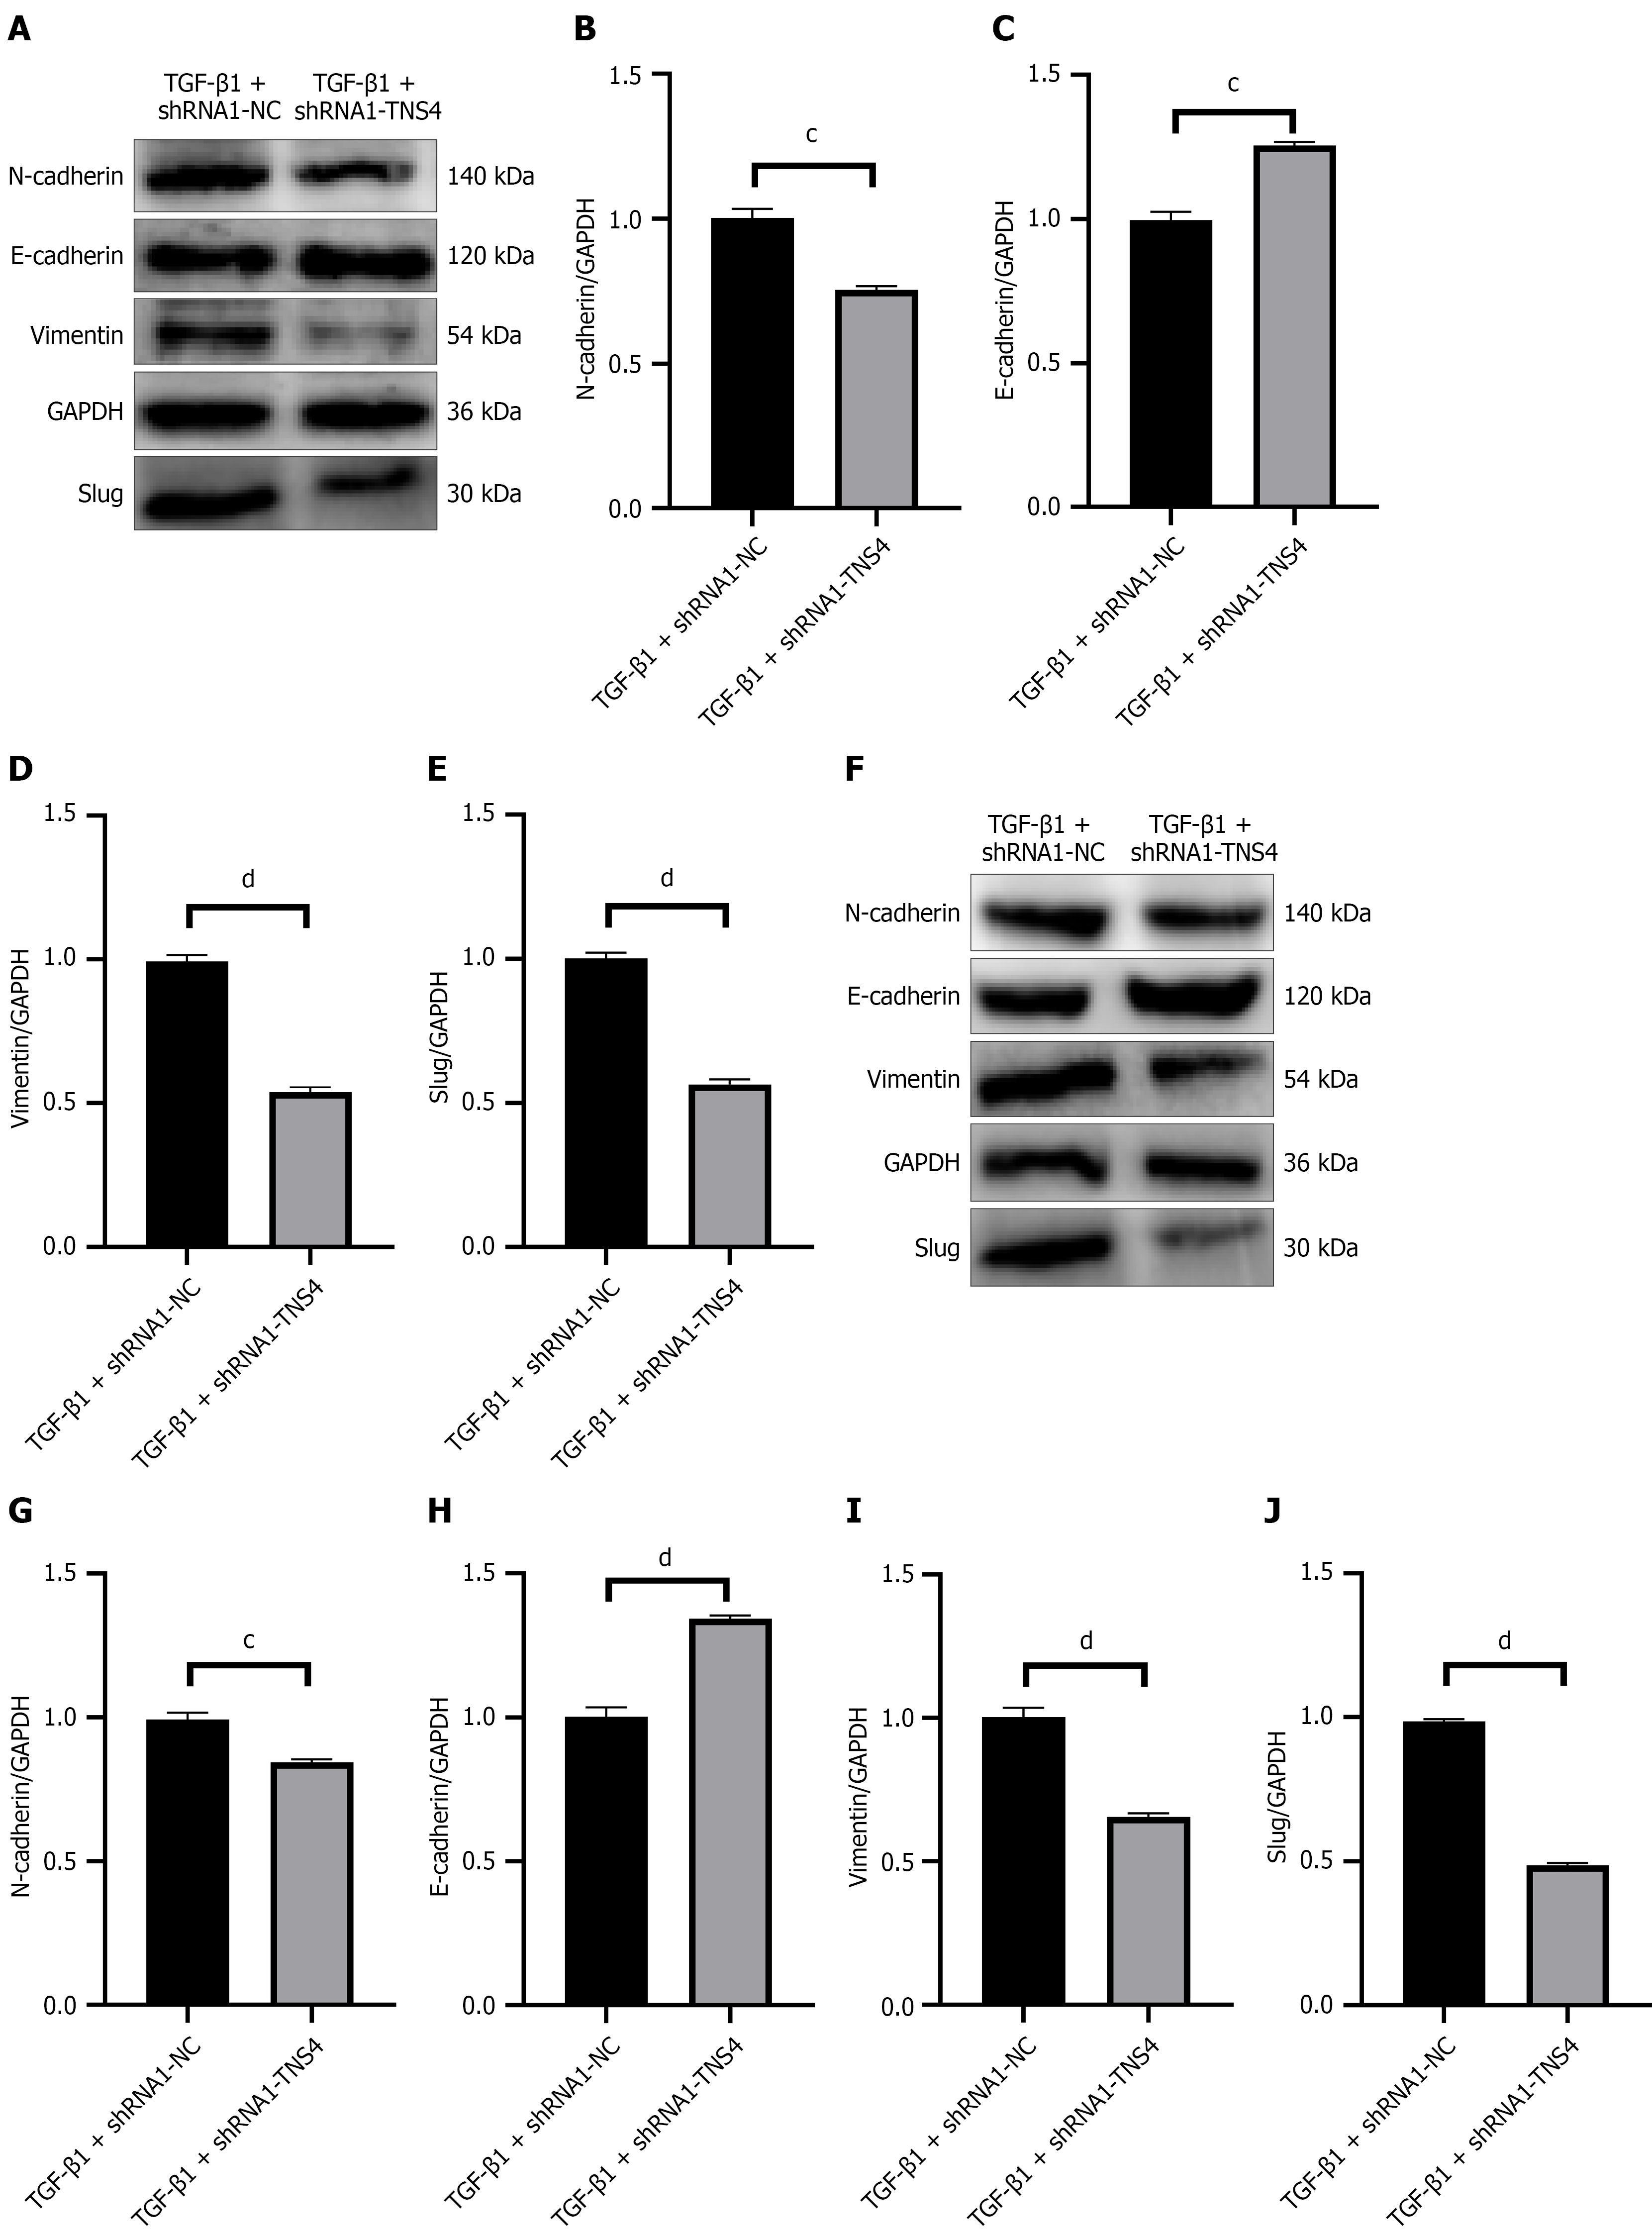
Figure 8 Effects of transforming growth factor-β1 + shRNA-tensin 4 on epithelial-mesenchymal transition-related protein expression in HepG2 and PLC cells.
A: Influence of transforming growth factor (TGF)-β1 + shRNA-tensin (TNS) 4 on epithelial-mesenchymal transition (EMT)-related protein expression in HepG2 cells, measured by western blotting; B-E: TGF-β1 + shRNA1-TNS4 significantly downregulated expression of N-cadherin, vimentin and Slug, and upregulated E-cadherin expression in HepG2 cells; F: Influence of TGF-β1 + shRNA-TNS4 on EMT-related protein expression in PLC cells, measured by western blotting; G-J: TGF-β1 + shRNA1-TNS4 exerted consistent regulatory effects on the aforementioned EMT-related proteins in PLC cells. cP < 0.001, dP < 0.0001. TGF-β1: Transforming growth factor-β1; NC: Normal control; TNS4: Tensin 4.
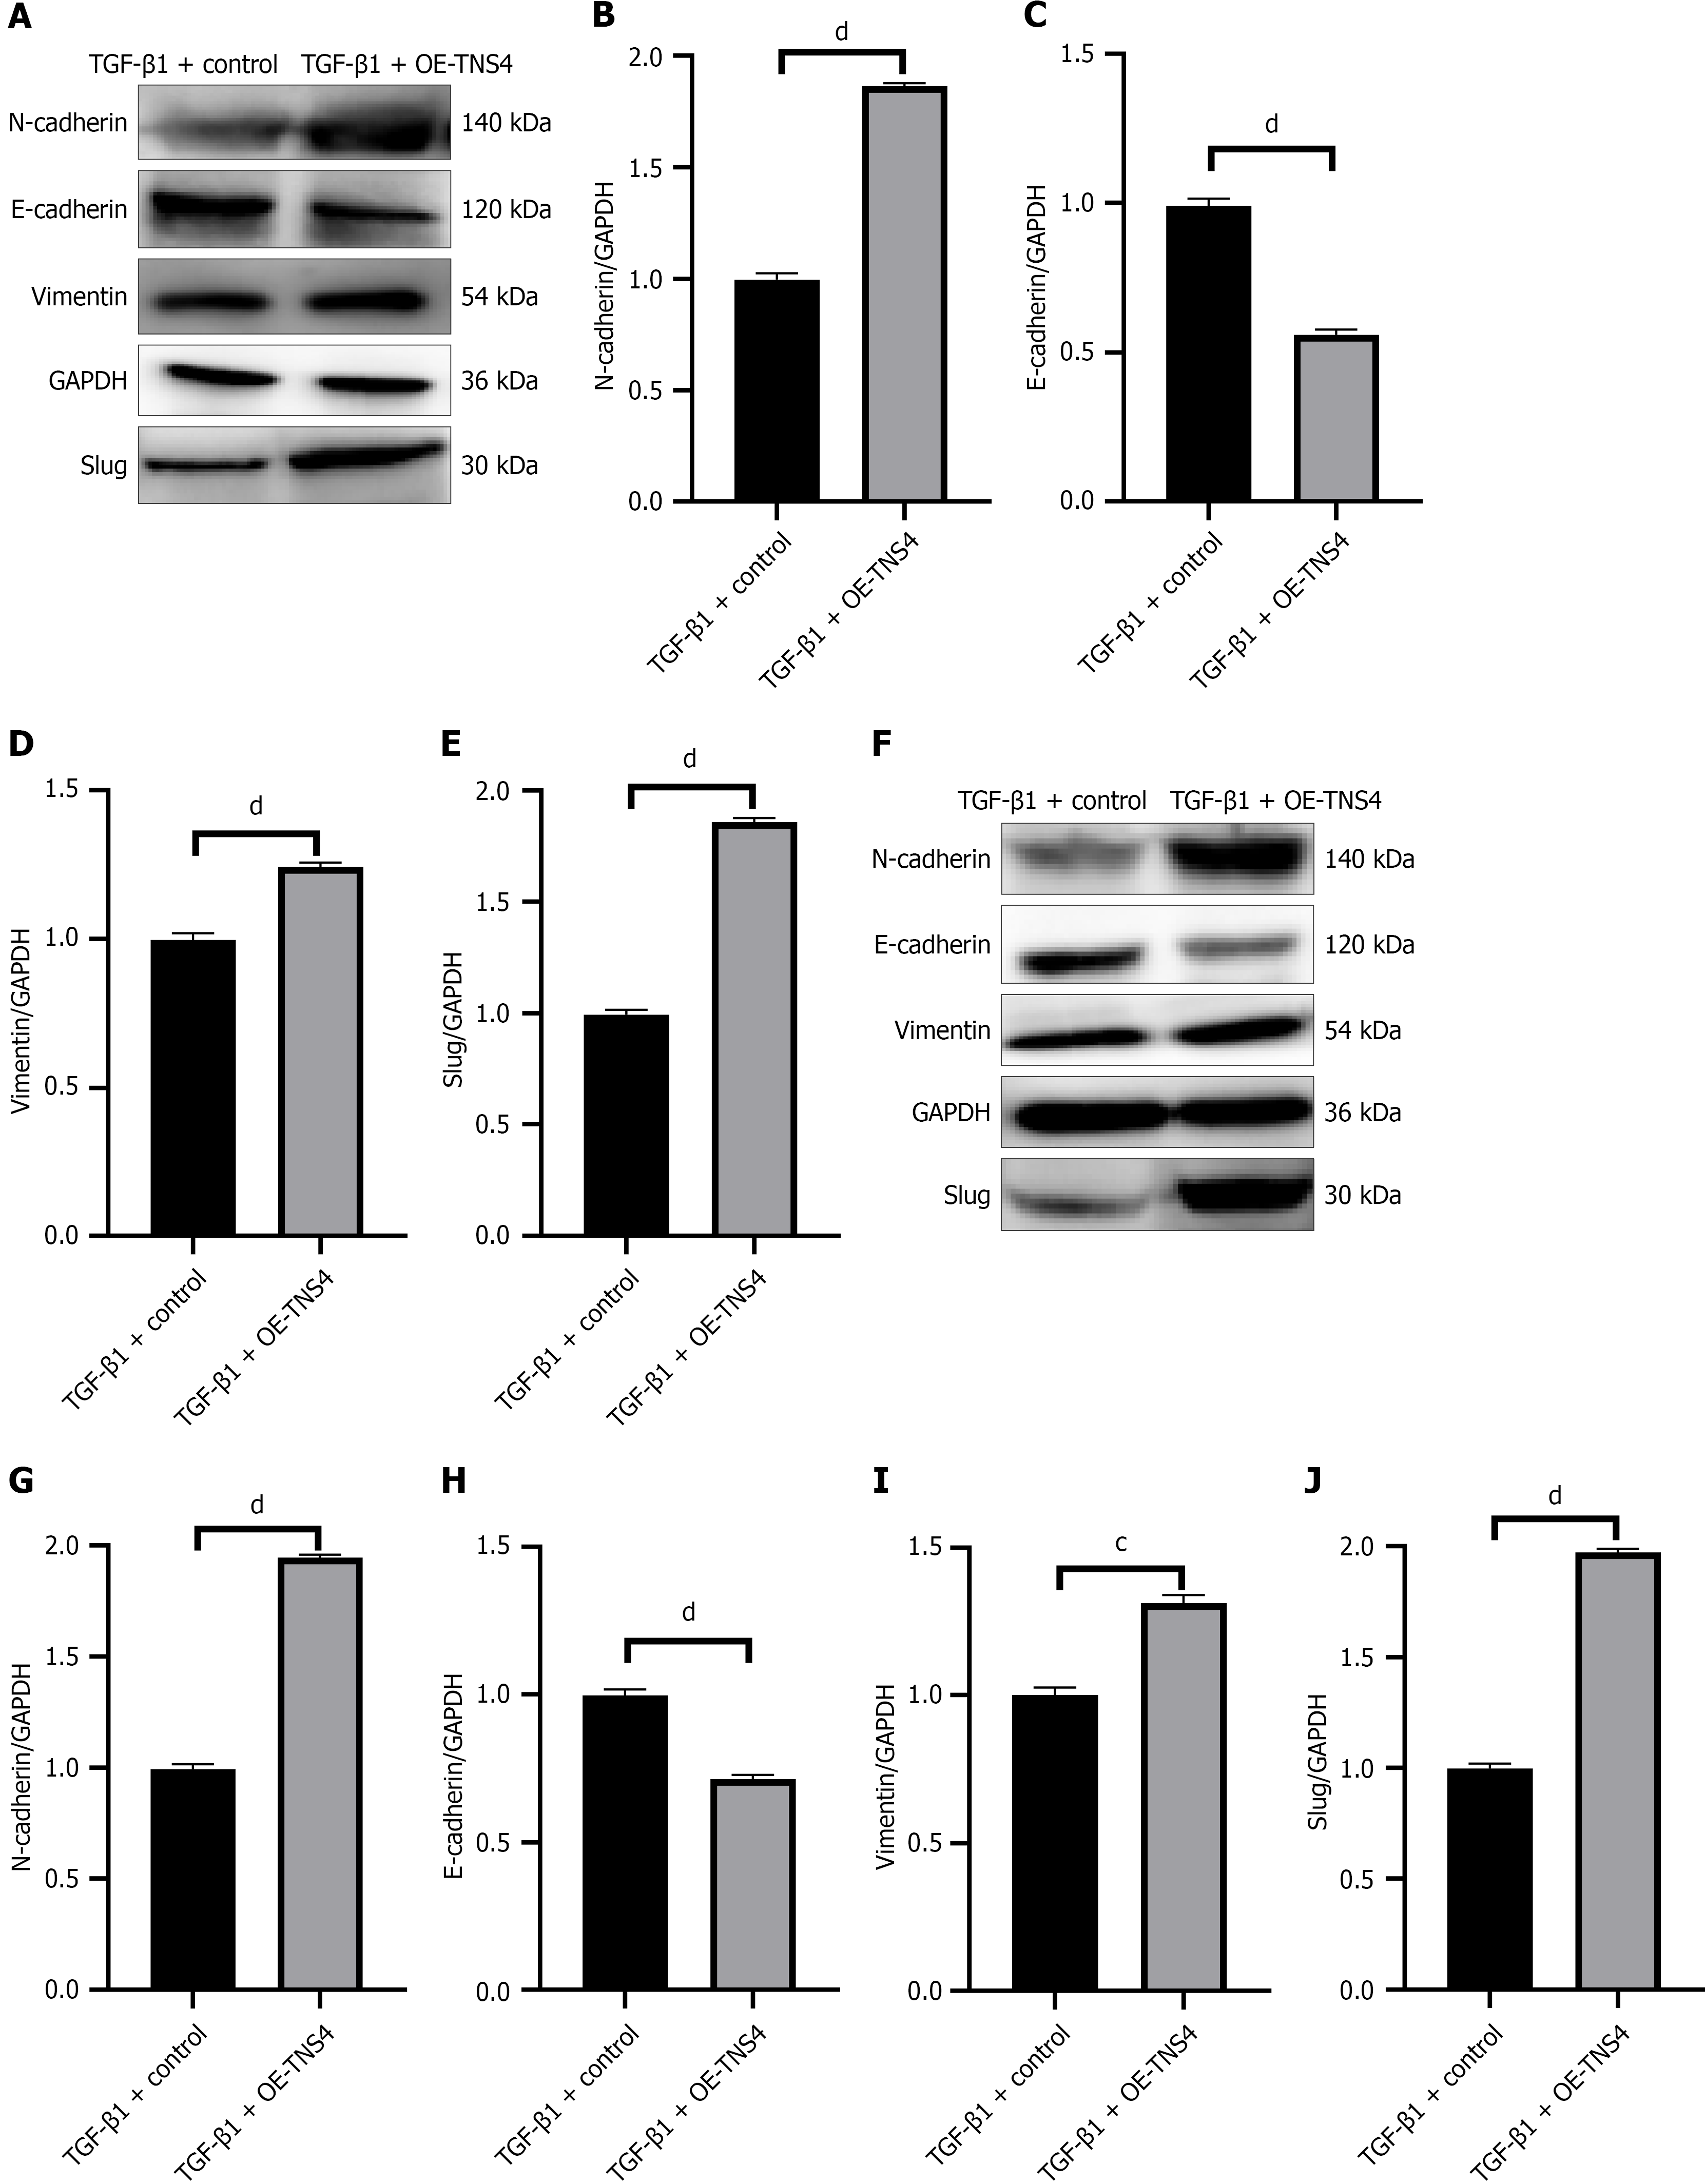
Figure 9 Effects of transforming growth factor-β1+ overexpression of tensin 4 on epithelial-mesenchymal transition-related protein expression in HepG2 and PLC cells.
A: Effect of transforming growth factor (TGF)-β1 + overexpression (OE) of tensin (TNS) 4 on epithelial-mesenchymal transition (EMT)-related protein expression in HepG2 cells, measured by western blotting; B-E: TGF-β1 + OE significantly upregulated expression of N-cadherin, vimentin and Slug, and downregulated E-cadherin expression in HepG2 cells; F: Effect of TGF-β1 + OE of TNS4 on EMT-related protein expression in PLC cells, measured by western blotting; G-J: TGF-β1 + OE exerted consistent regulatory effects on the aforementioned EMT-related proteins in PLC cells. cP < 0.001, dP < 0.0001. TGF-β1: Transforming growth factor-β1; OE: Overexpression; TNS4: Tensin 4.
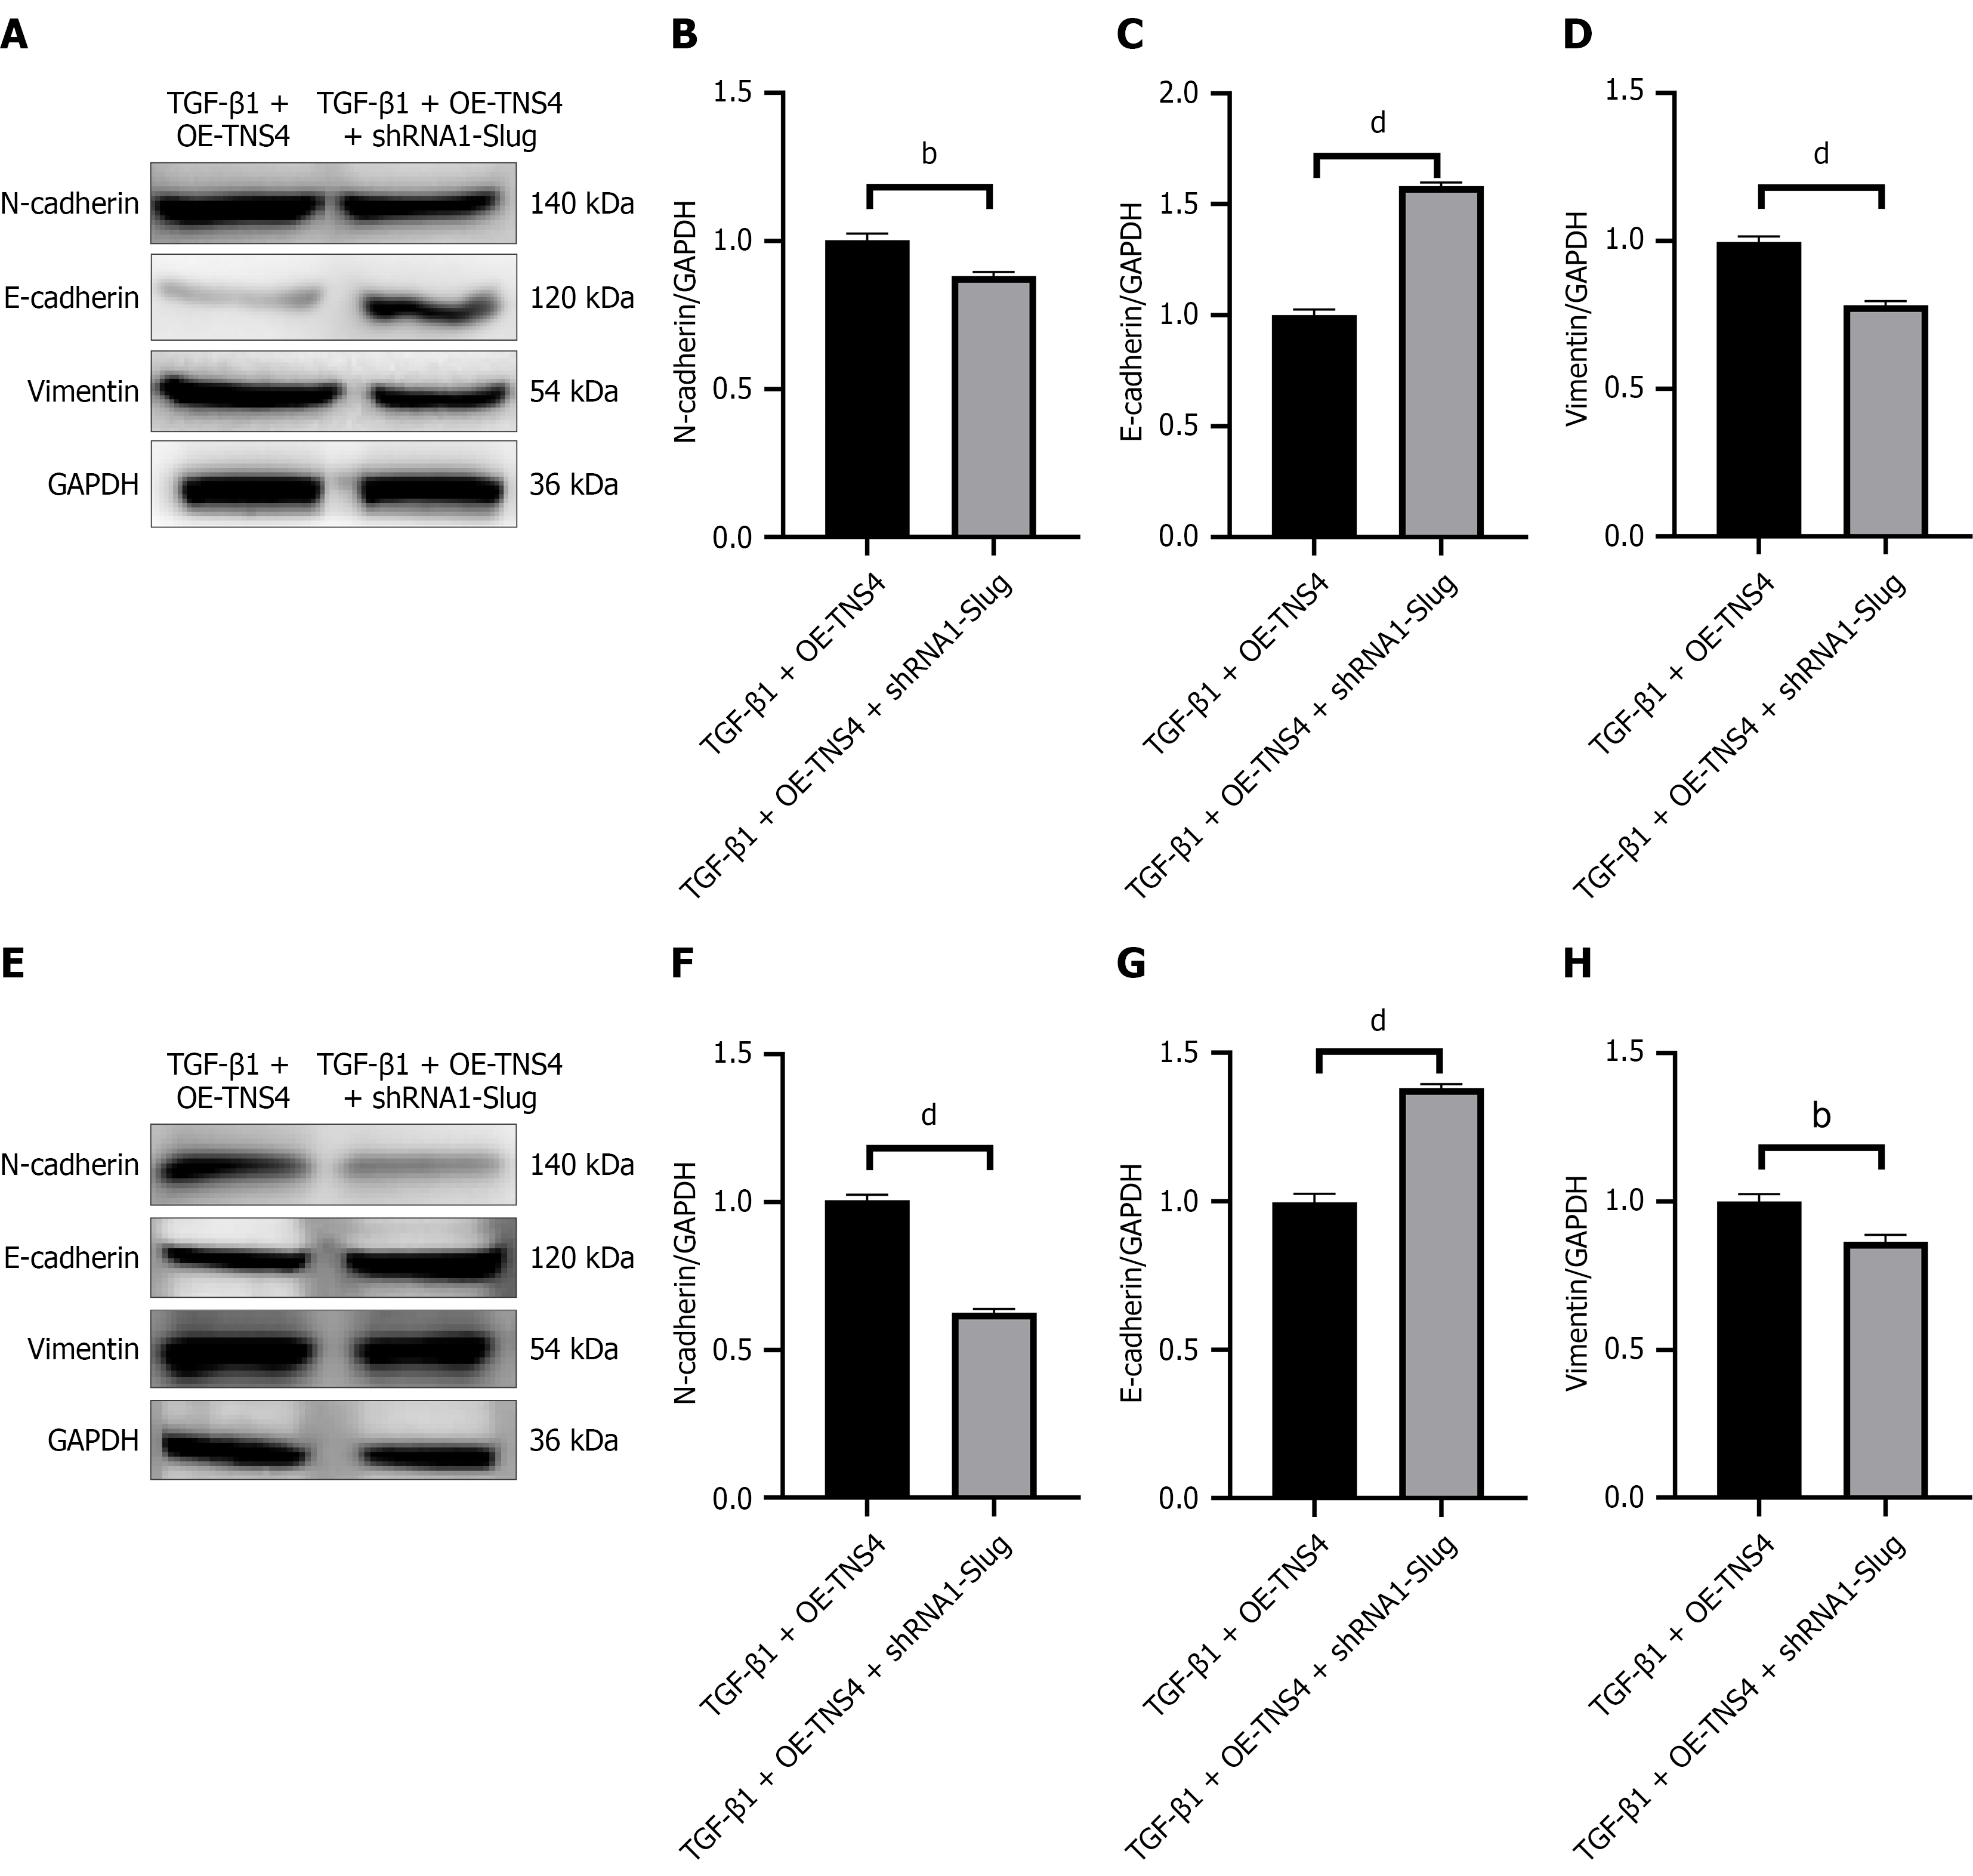
Figure 10 Relationship between Slug knockdown after overexpression of tensin 4 and epithelial-mesenchymal transition of HepG2 and PLC cell lines.
A: Relationship between Slug knockdown after tensin (TNS) 4 overexpression (OE) and epithelial-mesenchymal transition in HepG2 cells; B-D: After OE of TNS4, Slug knockdown significantly upregulated expression of E-cadherin, and significantly downregulated expression of N-cadherin and vimentin in HepG2 cells; E: Relationship between Slug knockdown after TNS4 OE and epithelial-mesenchymal transition in PLC cells line; F-H: After OE of TNS4, Slug knockdown significantly upregulated expression of E-cadherin, and significantly downregulated expression of N-cadherin and vimentin in PLC cells. bP < 0.01, dP < 0.0001. TGF-β1: Transforming growth factor-β1; OE: Overexpression; TNS4: Tensin 4.
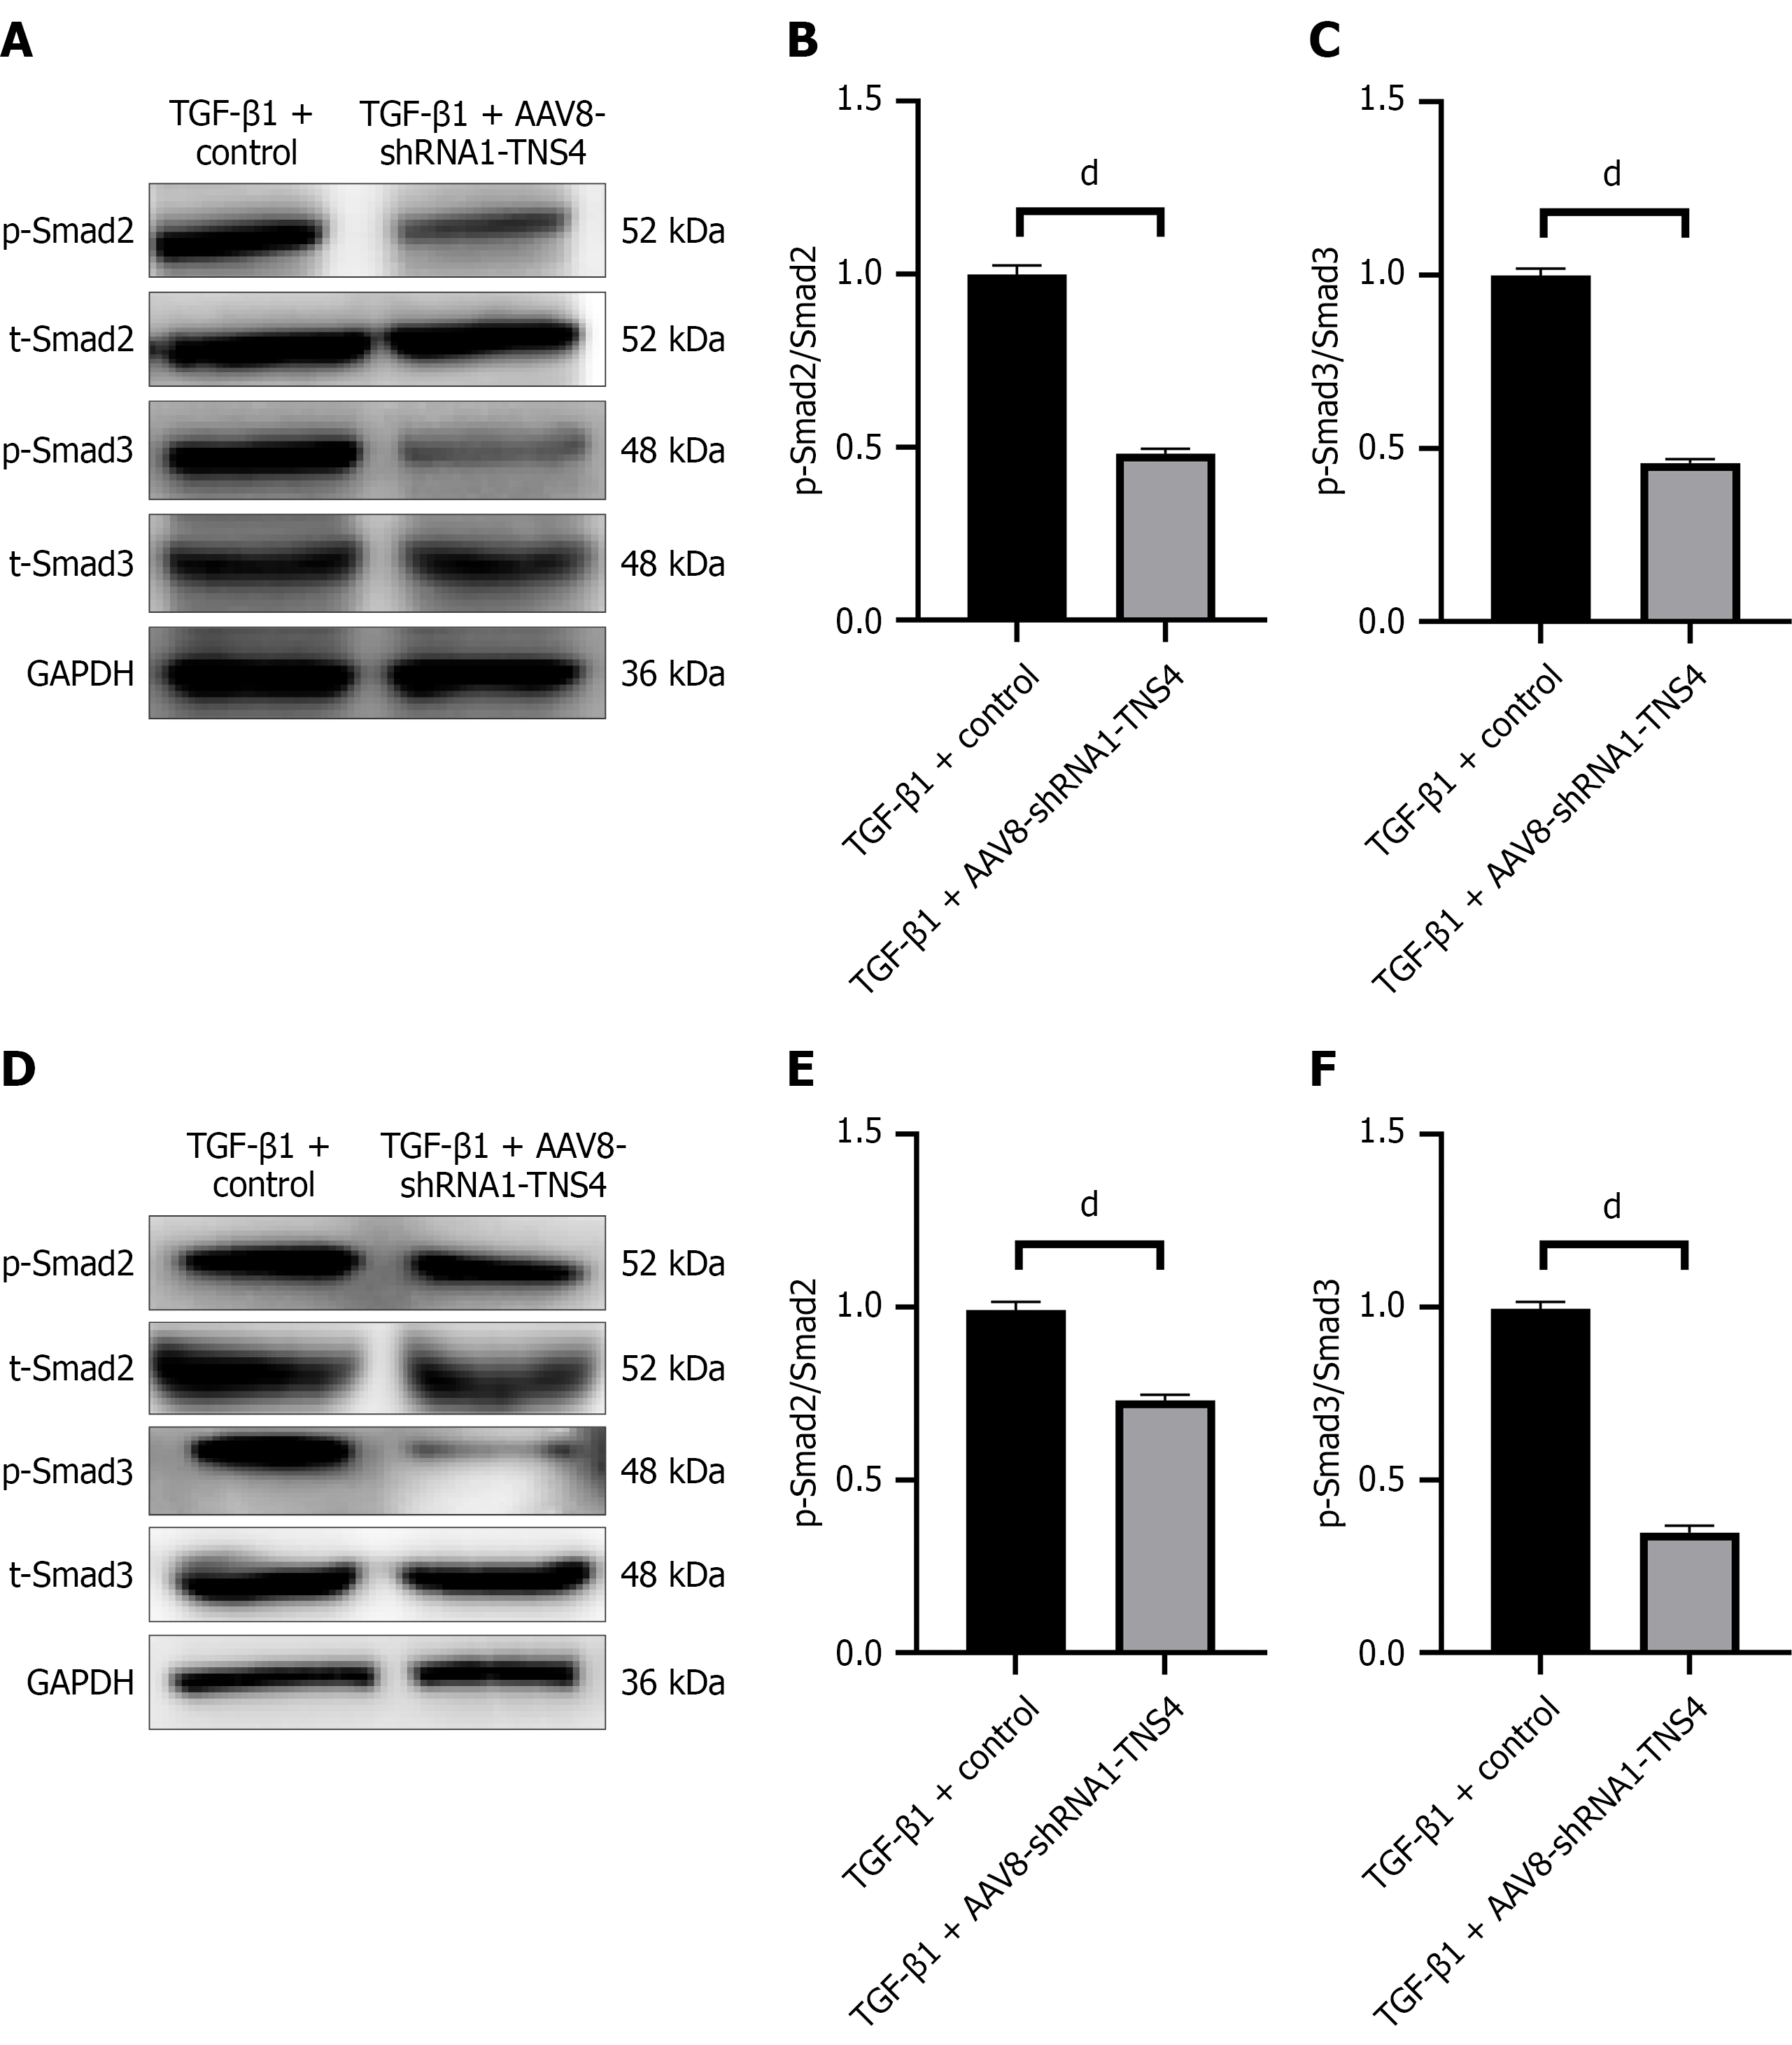
Figure 11 Effects of shRNA-tensin 4 on transforming growth factor-β1/Smad signaling pathway in HepG2 and PLC cells.
A: Transforming growth factor (TGF)-β1/Smad signaling pathway-related protein expression in HepG2 cells, measured by western blotting; B and C: TGF-β1 + adeno-associated virus-shRNA1-TNS4 significantly downregulated expression of p-Smad2/Smad2 and p-Smad3/Smad3 in HepG2 cells; D: TGF-β1/Smad signaling pathway-related protein expression in PLC cells, measured by western blotting; E and F: TGF-β1 + adeno-associated virus-shRNA1-TNS4 significantly downregulated expression of p-Smad2/Smad2 and p-Smad3/Smad3 in PLC cells. dP < 0.0001. TGF-β1: Transforming growth factor-β1; TNS4: Tensin 4; AAV8: Adeno-associated virus 8.
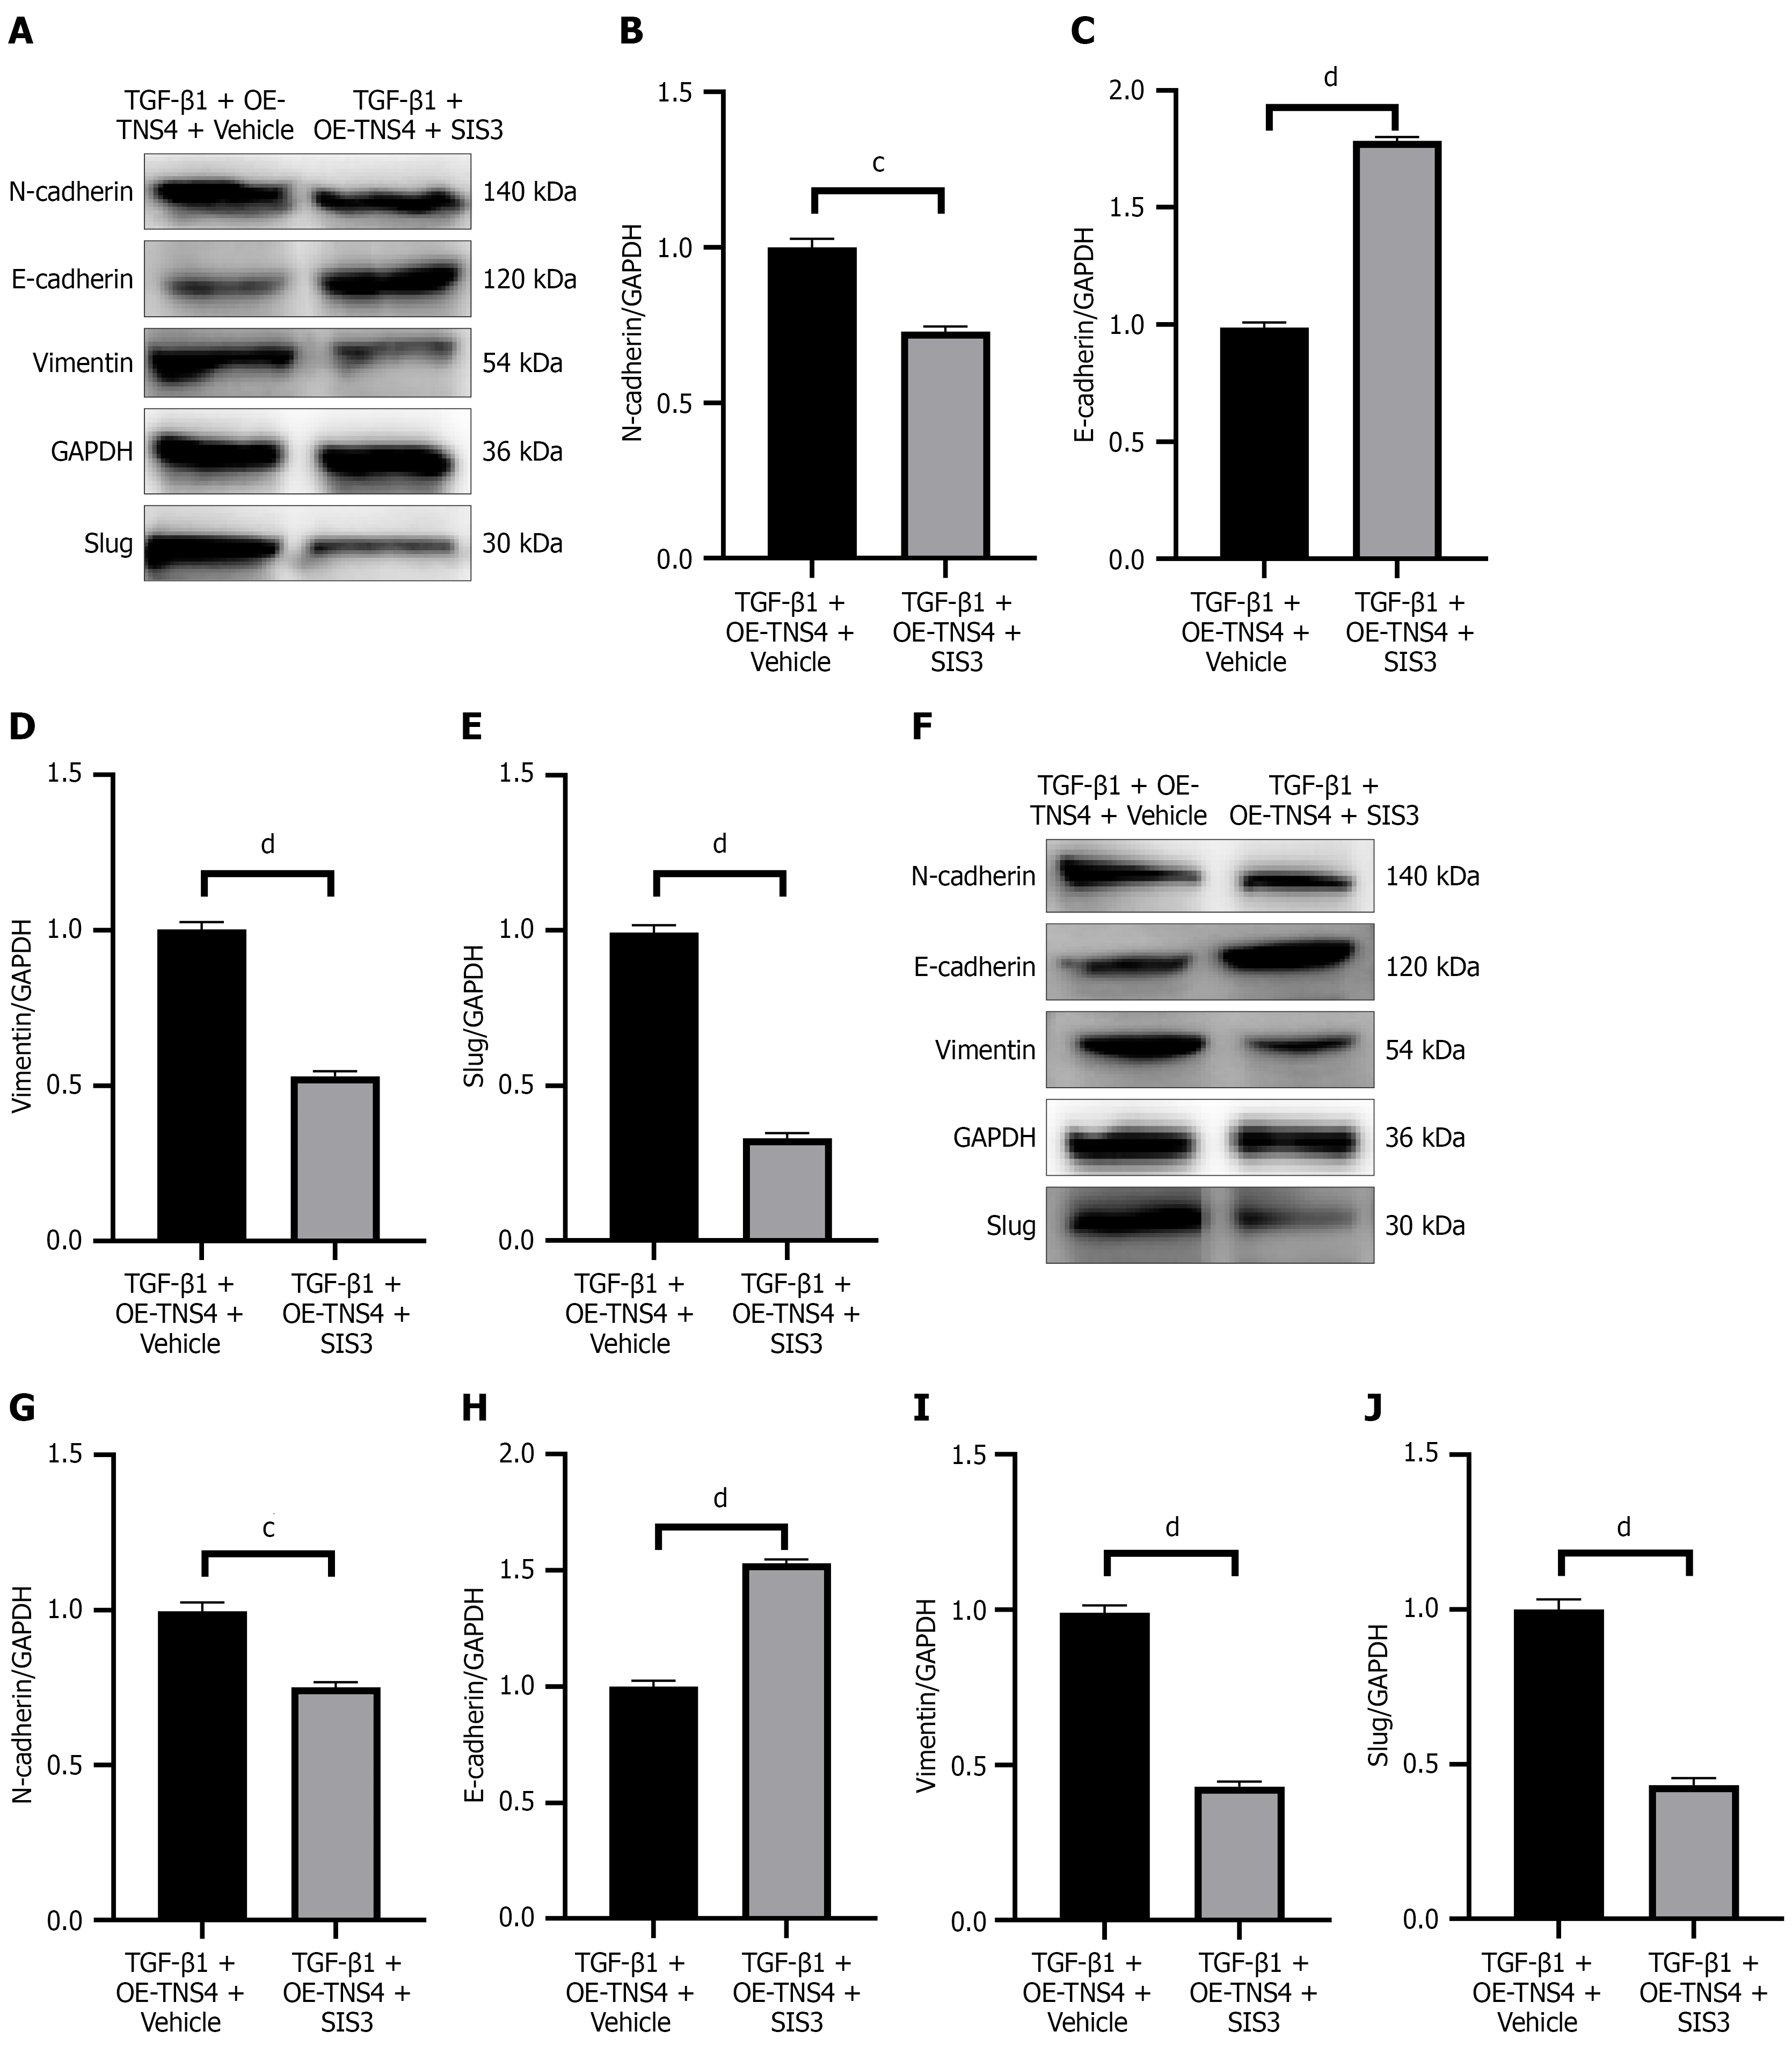
Figure 12 Effects of transforming growth factor-β1/Smad pathway inhibitor small-molecule inhibitor of Smad3 on epithelial-mesen
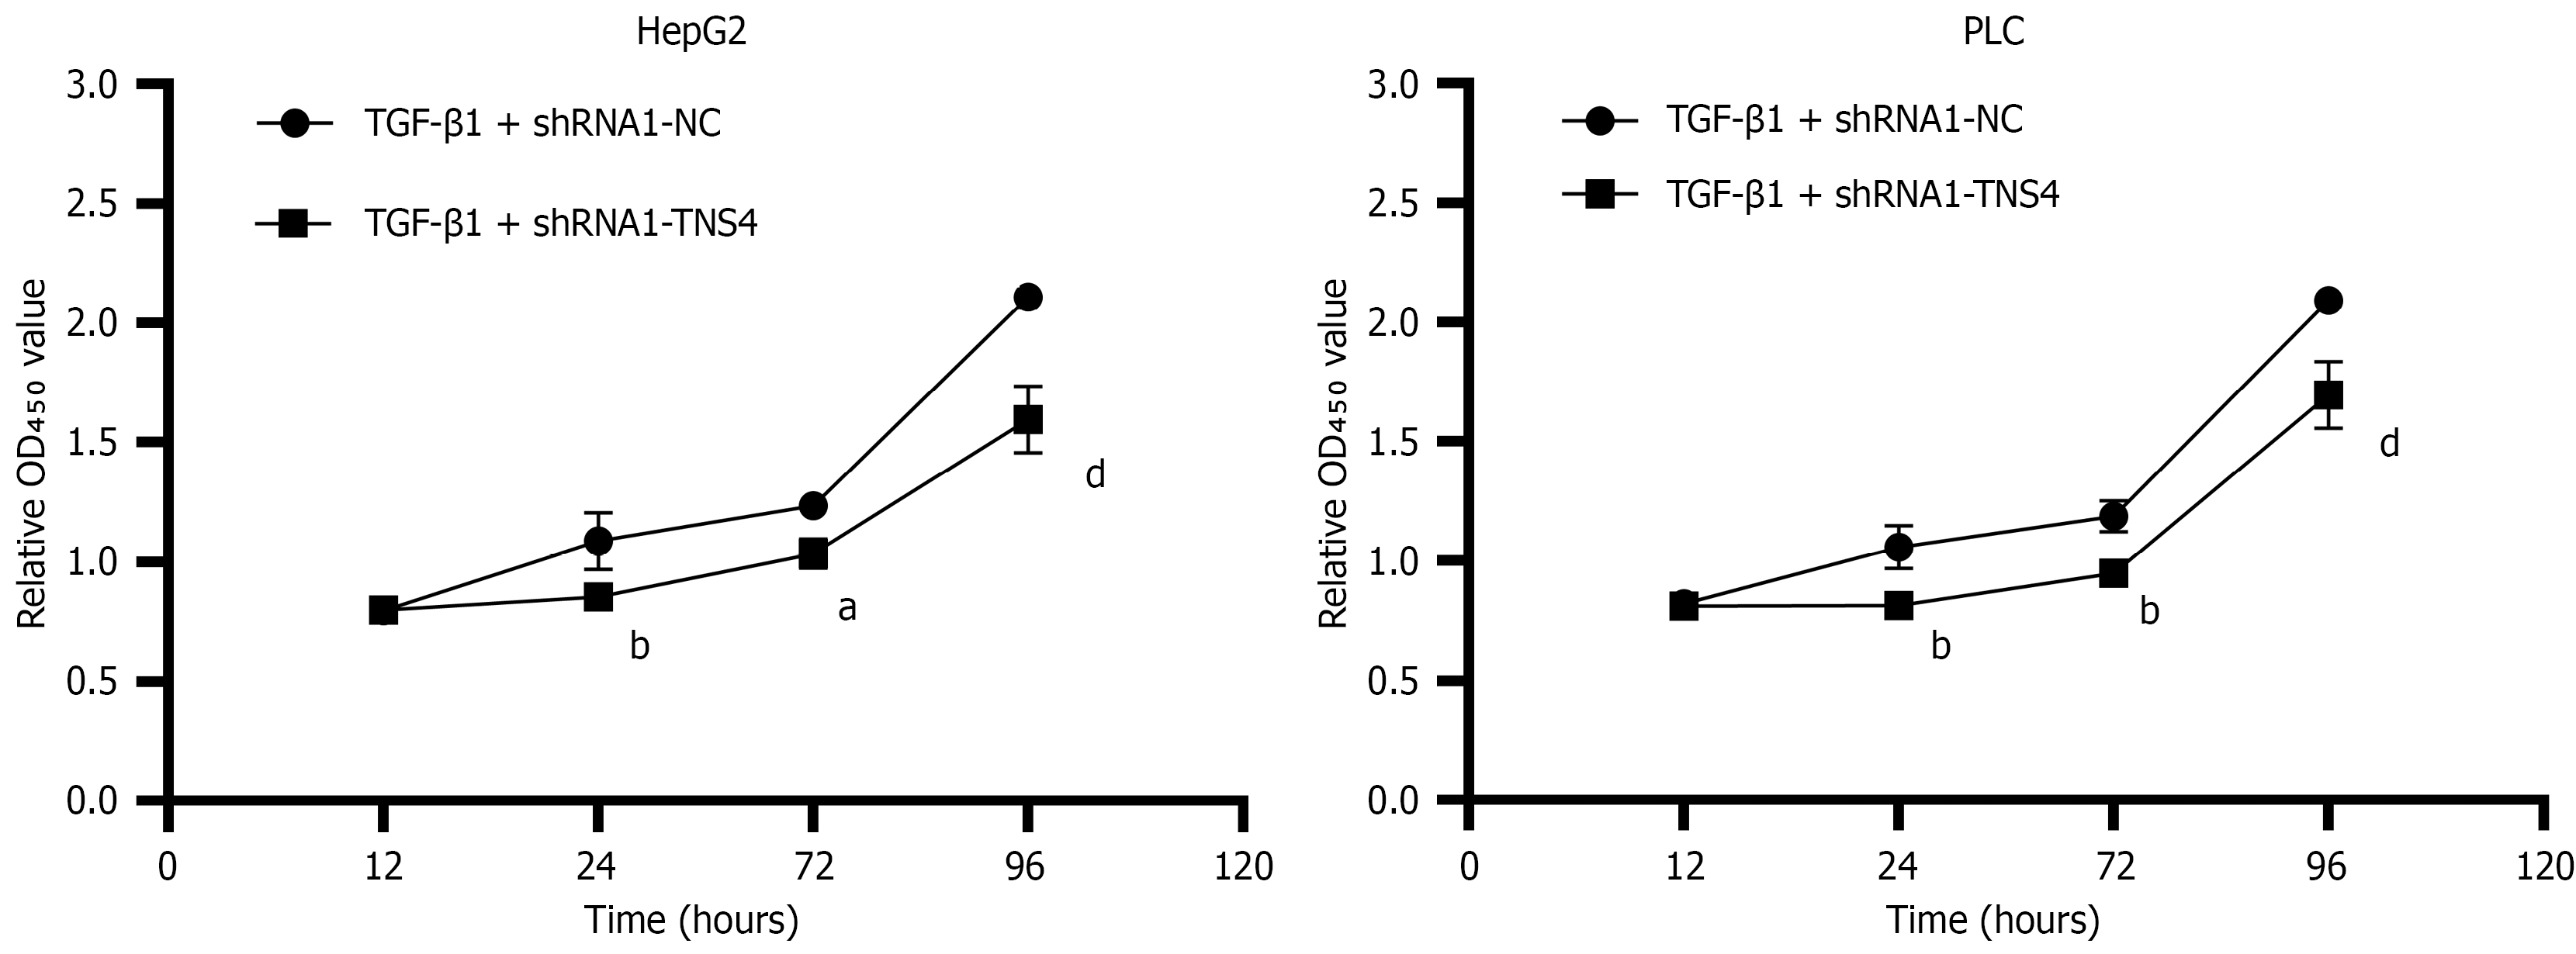
Figure 13 Tensin 4-shRNA1 significantly inhibited proliferation of HepG2 and PLC cells.
aP < 0.05, bP < 0.01, dP < 0.0001. TGF-β1: Transforming growth factor-β1; TNS4: Tensin 4; NC: Normal control.
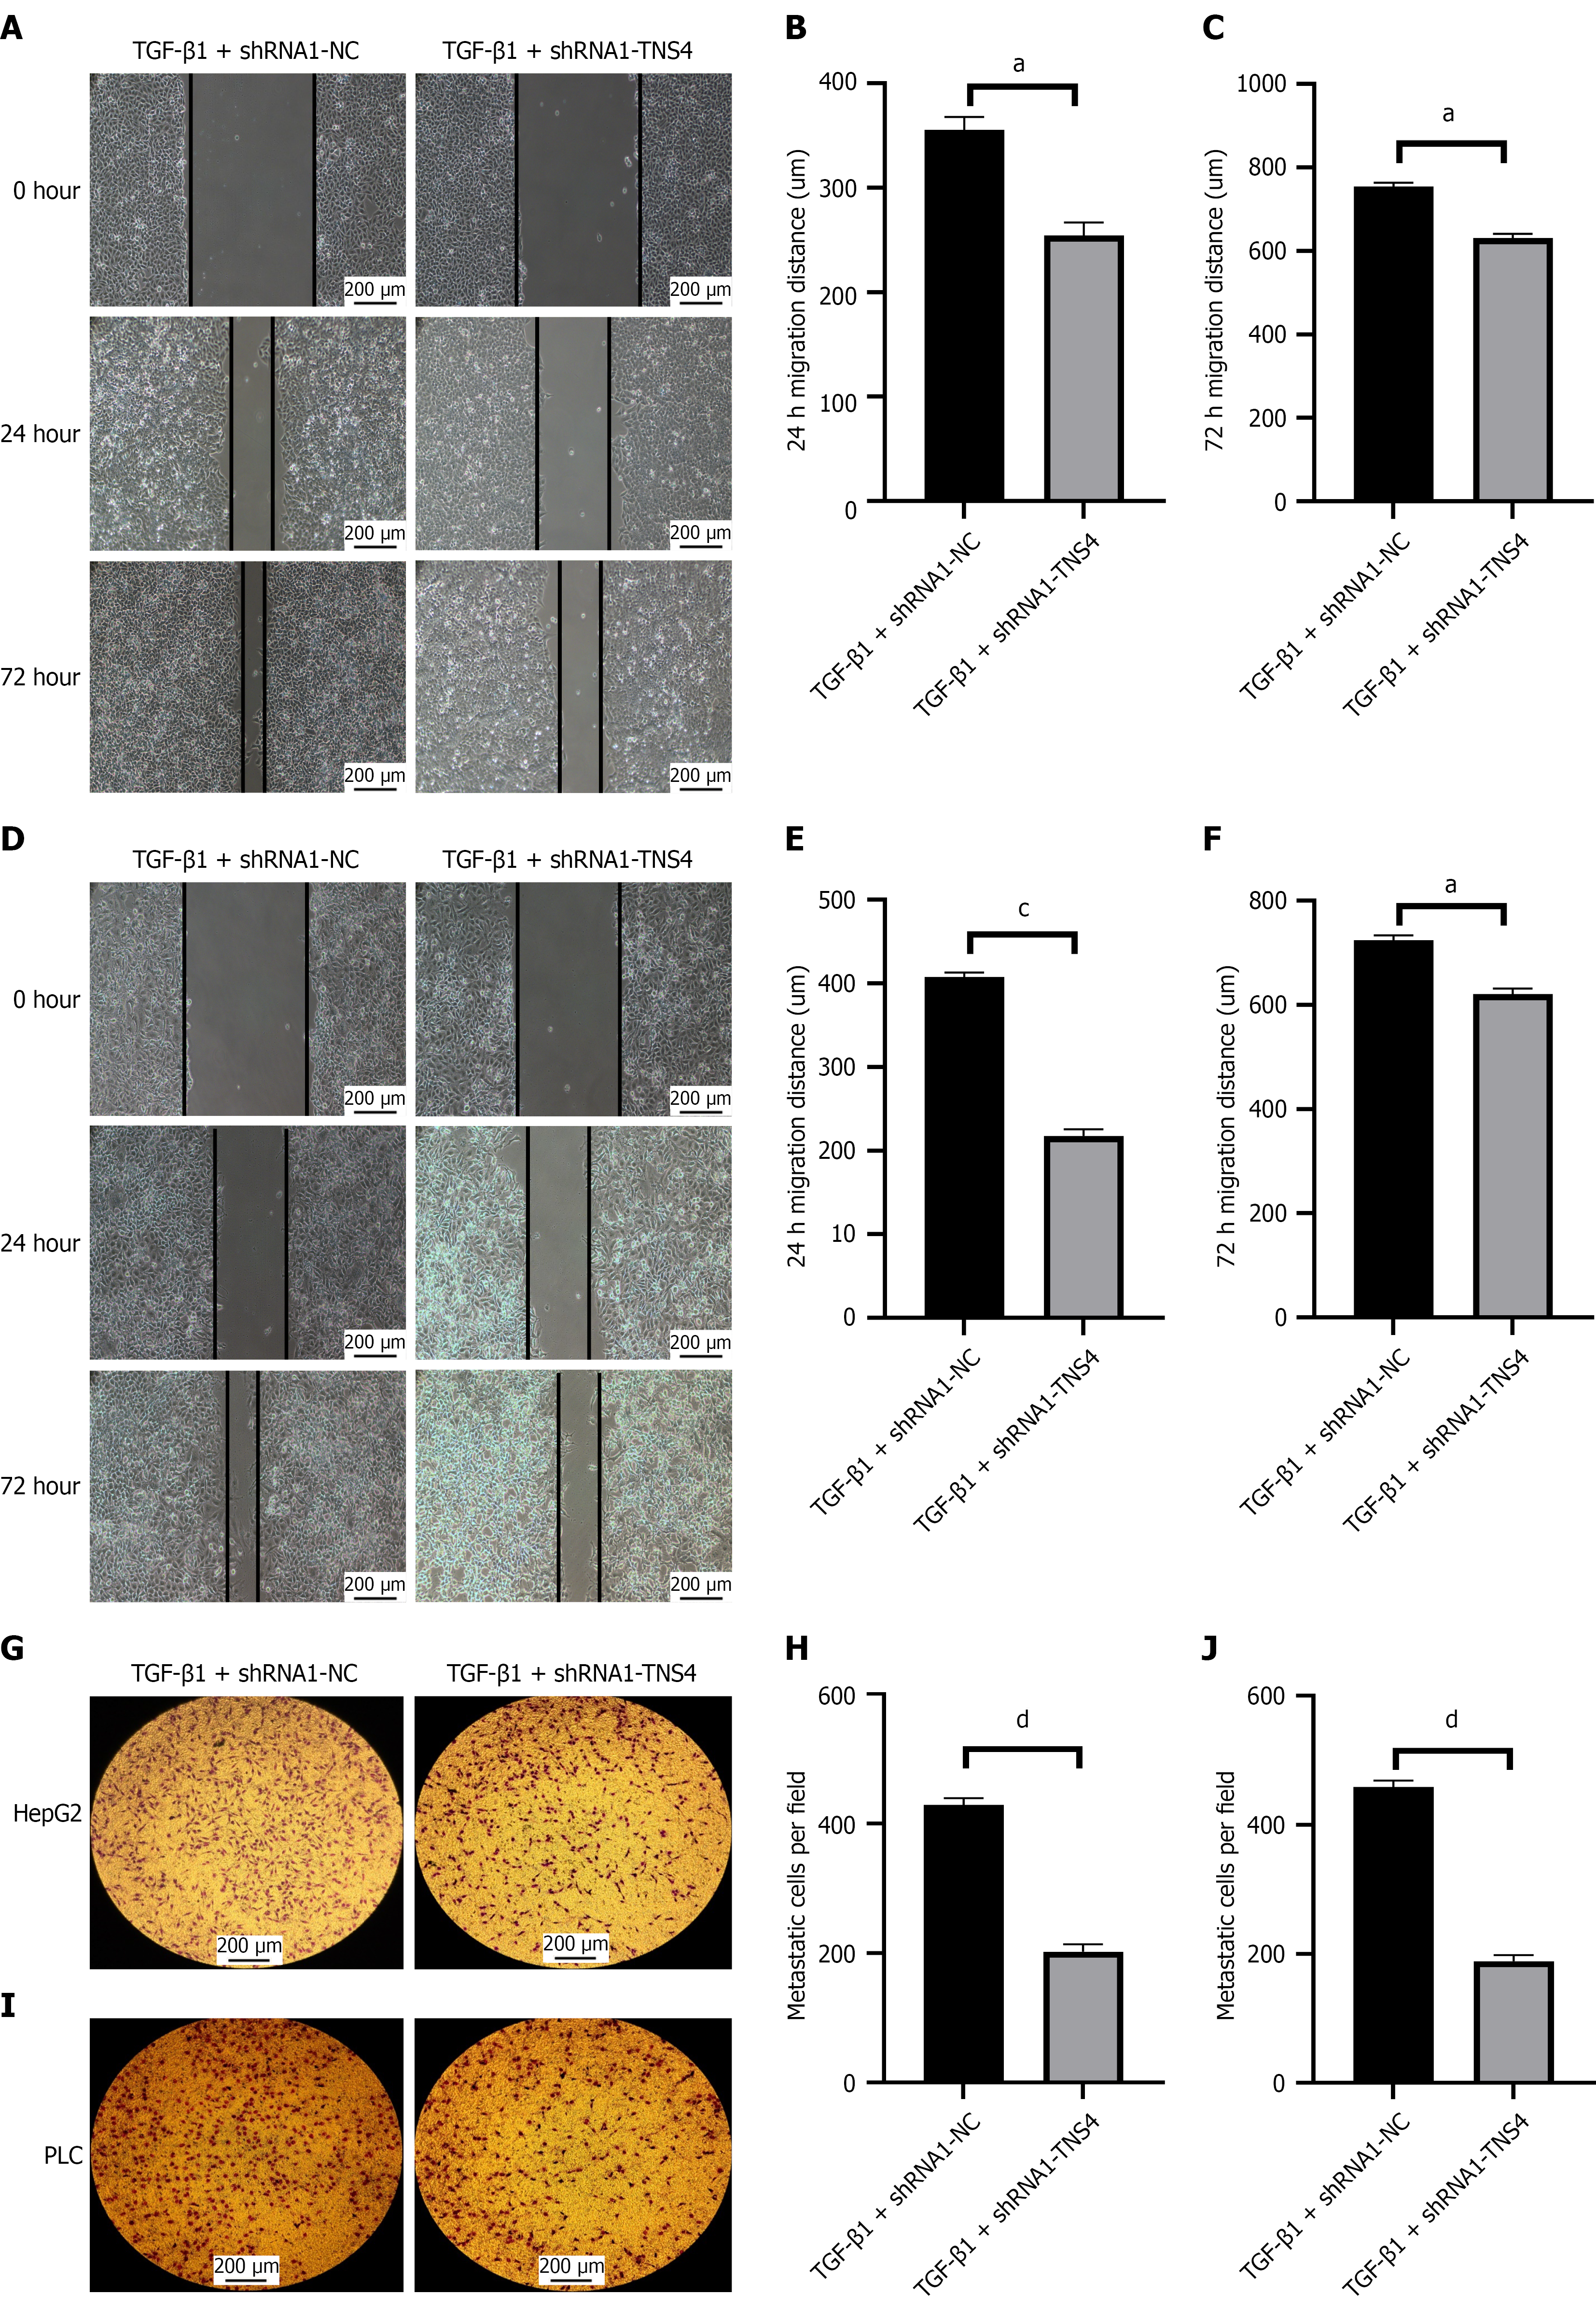
Figure 14 Effects of tensin 4-shRNA on migration and invasiveness of HepG2 and PLC cells induced by transforming growth factor-β1.
A-C: Effect of tensin (TNS)4-shRNA on the migration ability of HepG2 cells induced by transforming growth factor (TGF)-β1 detected by scratch assay. TNS4-shRNA1 significantly inhibited migration of HepG2 cells after 24 hours and 72 hours; D-F: Effect of TNS4-shRNA on migration of PLC cells induced by TGF-β1 detected by scratch assay. TNS4-shRNA1 significantly inhibited migration of PLC cells after 24 hours and 72 hours; G-J: Effect of TNS4-shRNA on the invasiveness of HepG2 and PLC cells induced by TGF-β1 detected by Transwell. TNS4-shRNA1 significantly inhibited invasiveness of HepG2 and PLC cells. aP < 0.05, cP < 0.001, dP < 0.0001. TGF-β1: Transforming growth factor-β1; TNS4: Tensin 4; NC: Normal control.
- Citation: Chen GL, Liu JH. Expression of tensin 4 in hepatocellular carcinoma and its role in epithelial-mesenchymal transformation. World J Gastrointest Oncol 2026; 18(8): 123710
- URL: https://www.wjgnet.com/1948-5204/full/v18/i8/123710.htm
- DOI: https://dx.doi.org/10.4251/wjgo.123710