
















Copyright: ©Author(s) 2026.
World J Gastrointest Oncol. Aug 15, 2026; 18(8): 122057
Published online Aug 15, 2026. doi: 10.4251/wjgo.122057
Published online Aug 15, 2026. doi: 10.4251/wjgo.122057
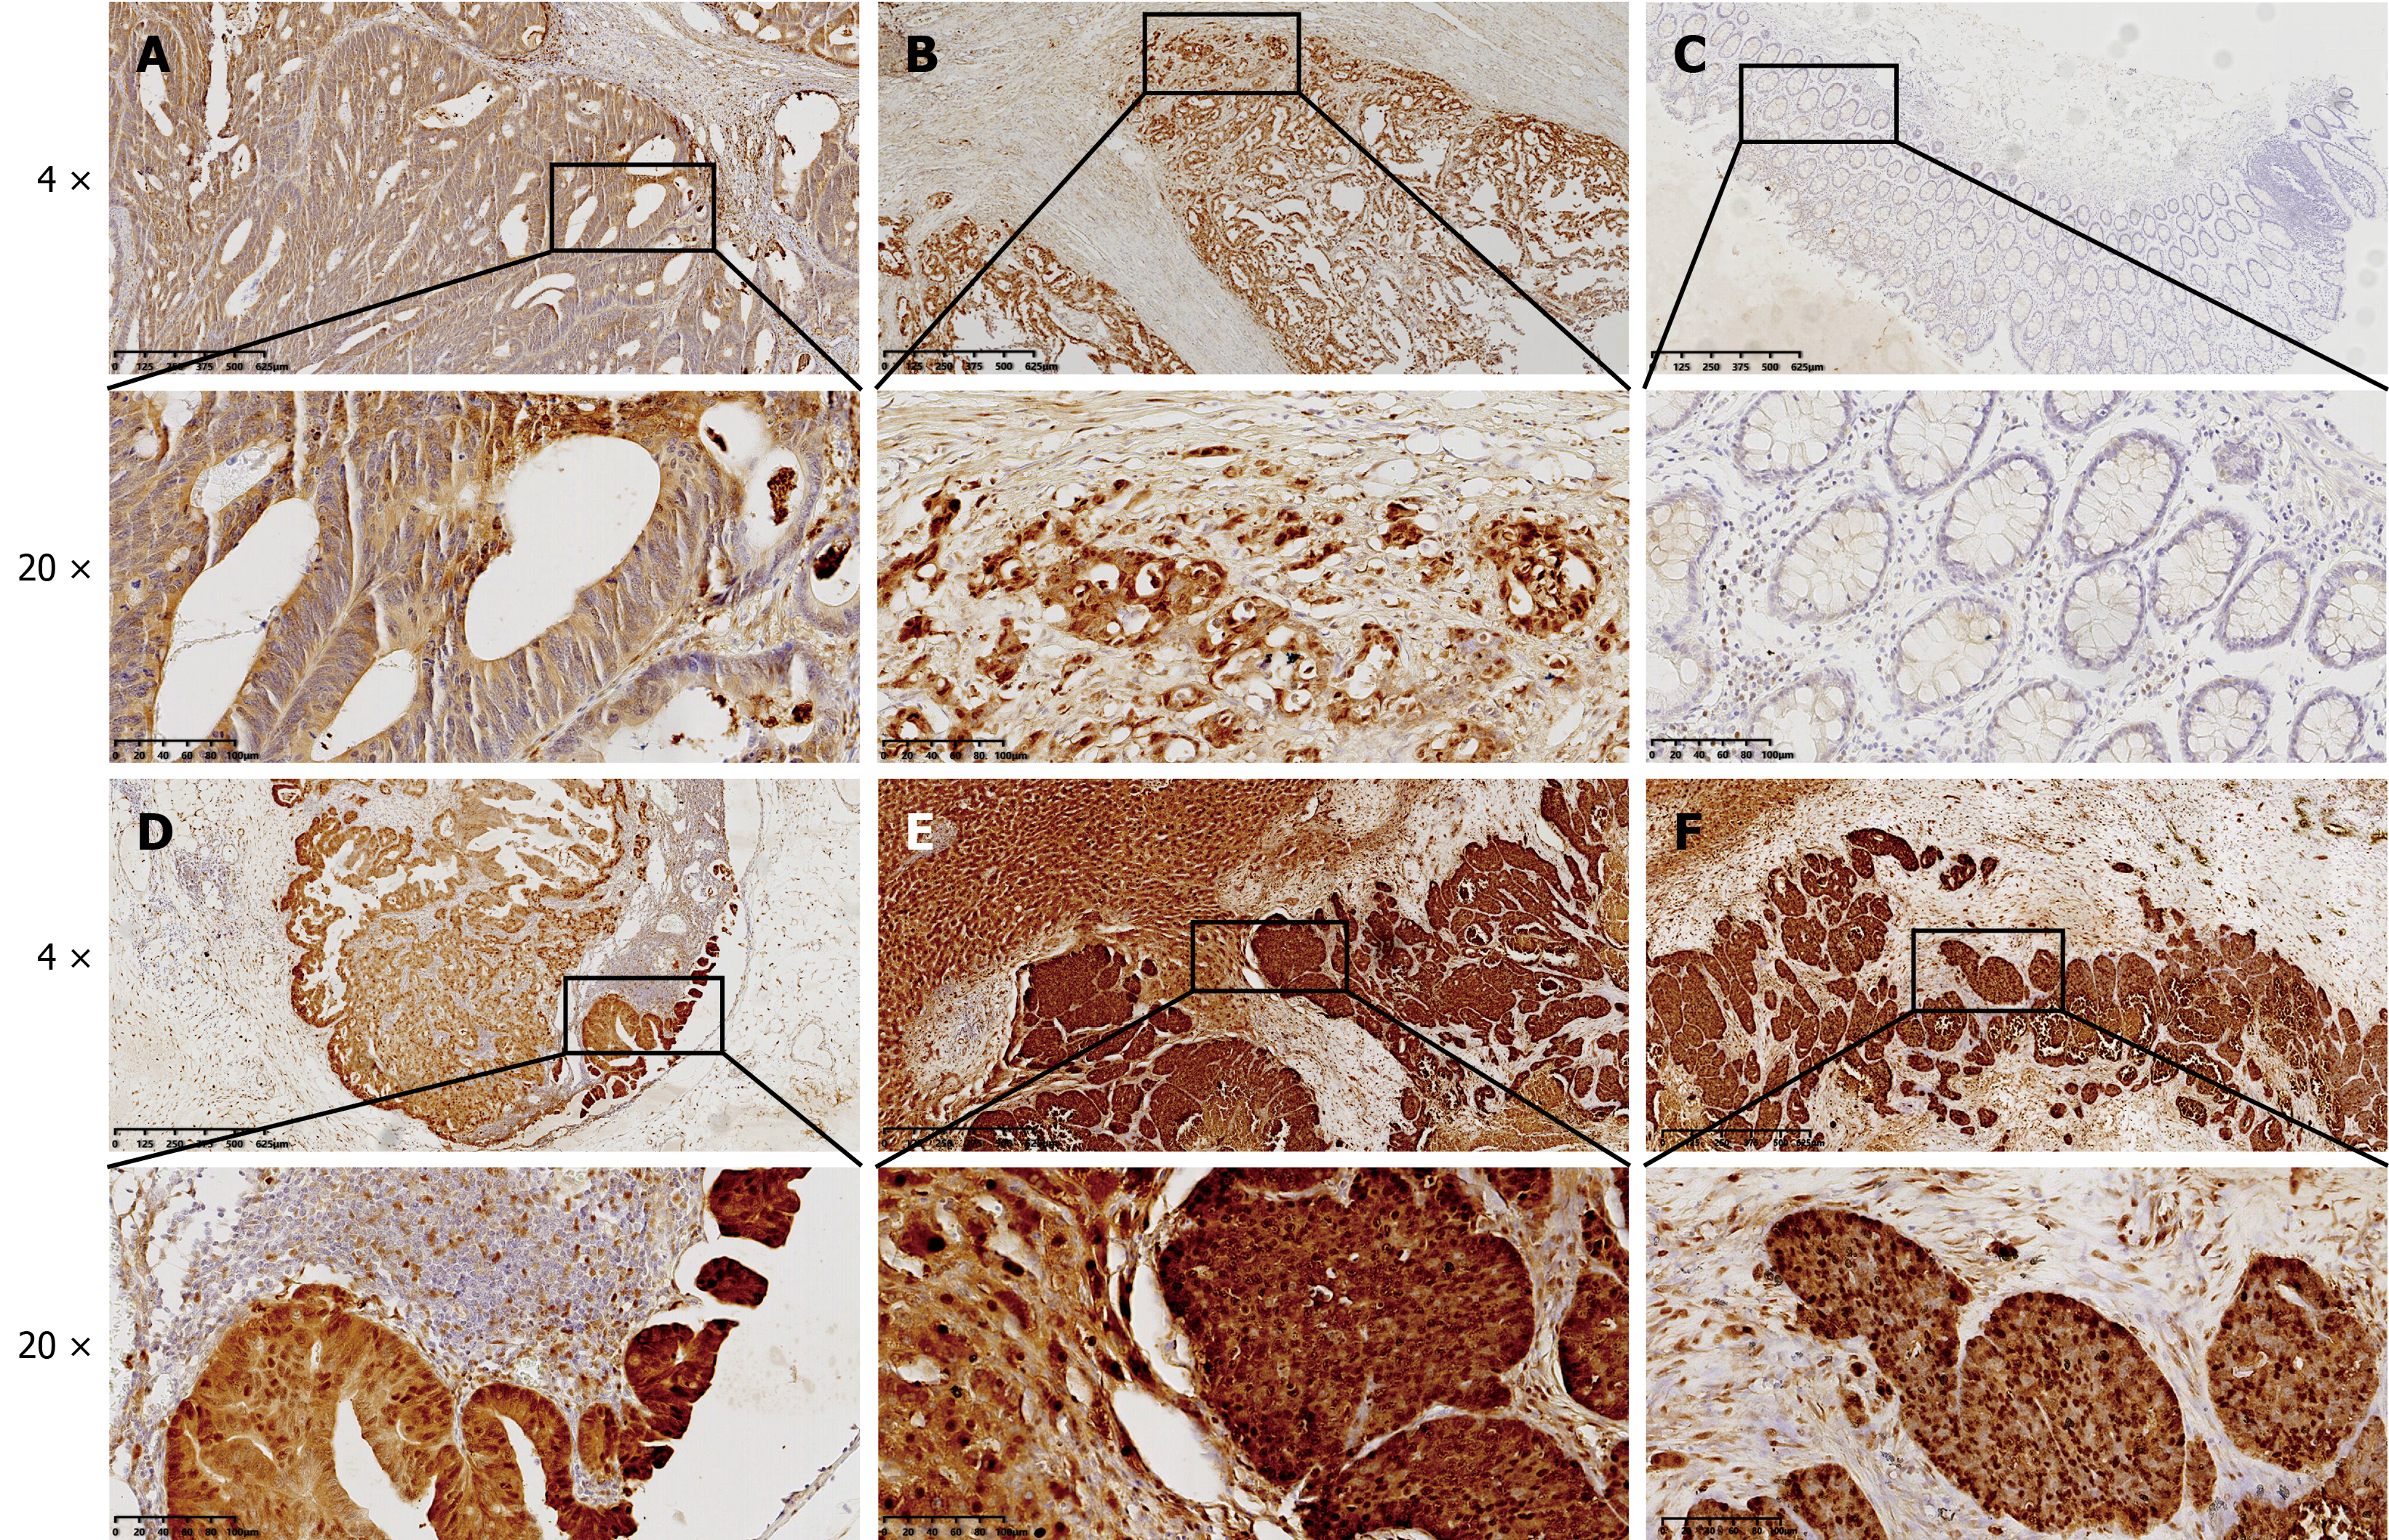
Figure 1 Immunohistochemical detection of proteasome subunit beta 5 protein expression in colorectal cancer tissues.
A: Well to moderately differentiated primary carcinoma; B: Poorly differentiated primary carcinoma; C: Peritumoral mucosa tissue; D: Lymph node metastasis; E and F: Liver metastasis (two representative cases). Scale bars: 200 μm (4 ×) and 50 μm (20 ×).
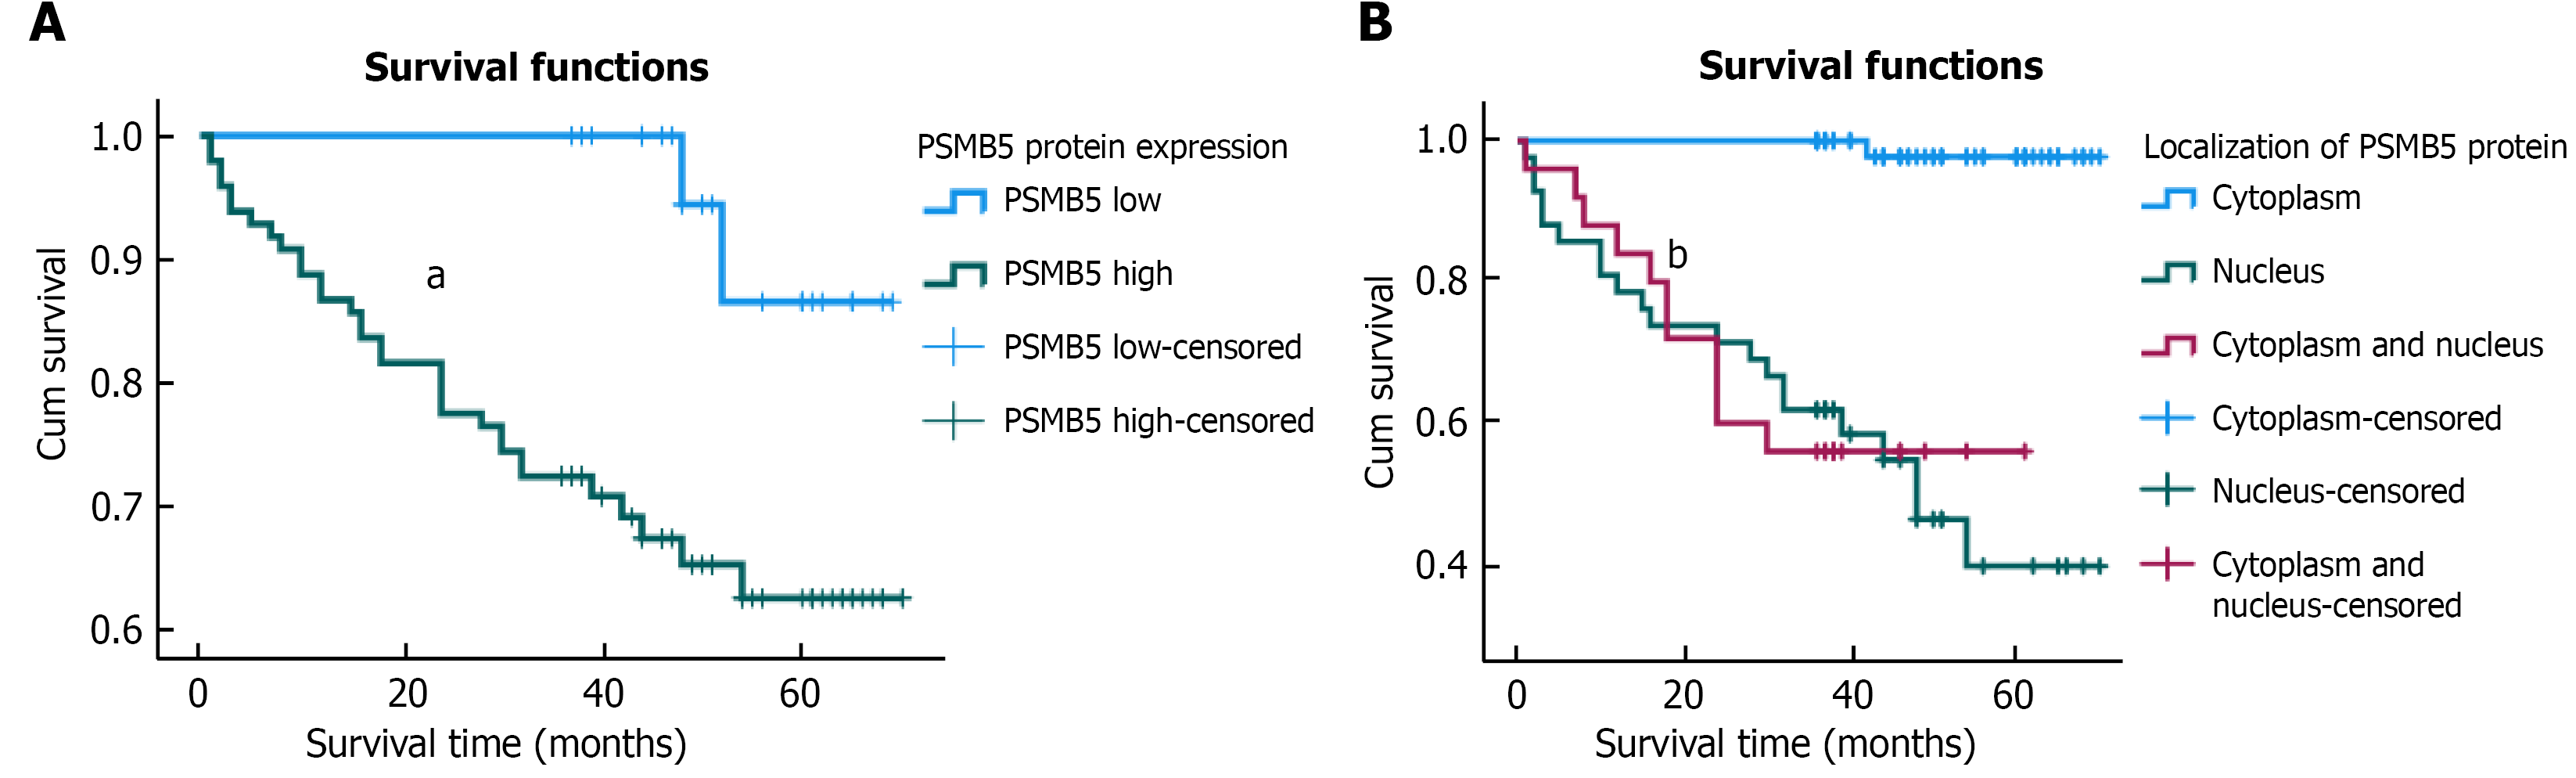
Figure 2 Kaplan-Meier survival analysis of proteasome subunit beta 5 expression level, subcellular localization, and prognosis in colorectal cancer patients.
A: Overall survival of colorectal cancer patients stratified by proteasome subunit beta 5 expression levels; B: Overall survival of colorectal cancer patients stratified by proteasome subunit beta 5 subcellular localization patterns. aP < 0.01 and bP < 0.001, for the comparison in A and for comparisons of the cytoplasm-only group vs the other two groups in B, respectively. PSMB5: Proteasome subunit beta 5.
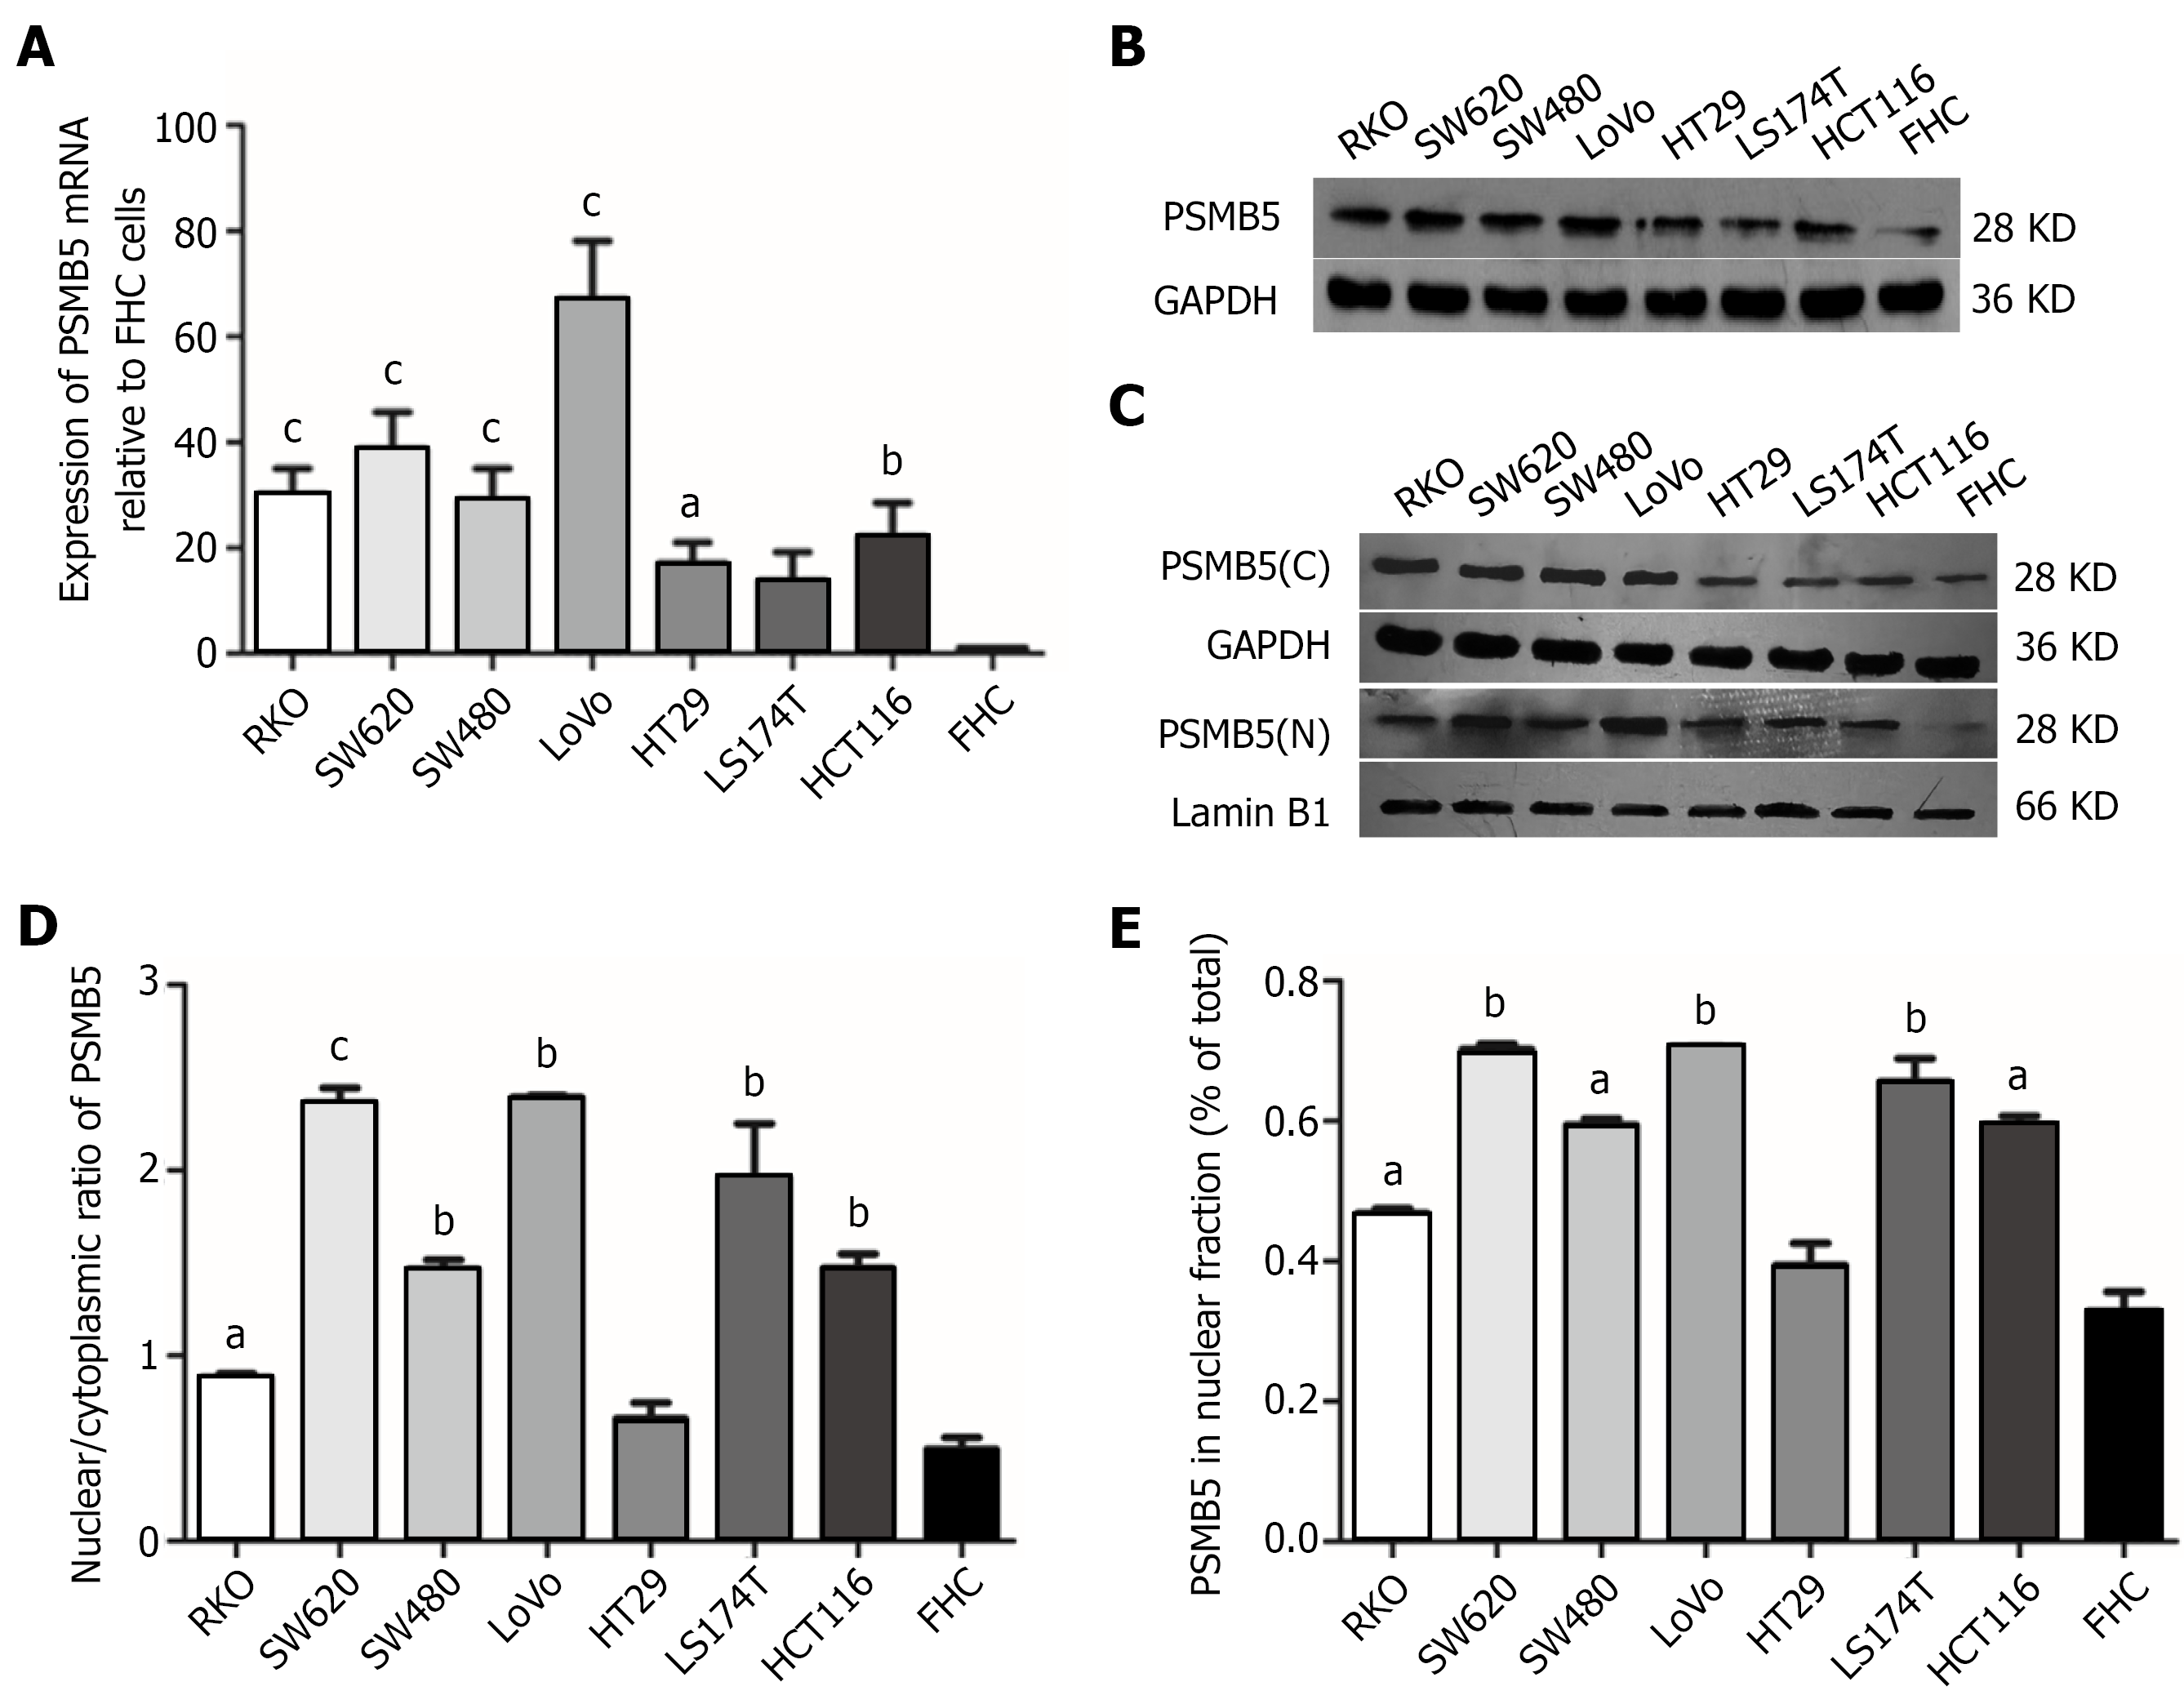
Figure 3 Proteasome subunit beta 5 is overexpressed and nuclear-enriched in metastatic colorectal cancer cell lines.
A: Relative proteasome subunit beta 5 (PSMB5) mRNA levels in a panel of colorectal cancer cell lines compared to the normal colonic epithelial cell line FHC, determined by quantitative real-time polymerase chain reaction. Data are mean ± SD (n = 3). aP < 0.05 vs FHC, bP < 0.01 vs FHC, cP < 0.001 vs FHC; B: Western blot analysis of total PSMB5 protein in whole-cell lysates from the indicated cell lines. GAPDH serves as a loading control; C-E: Subcellular distribution of PSMB5 protein. Western blot analysis of PSMB5 in cytoplasmic and nuclear fractions extracted from the indicated cell lines, GAPDH and Lamin B1 serve as compartment-specific loading controls for cytoplasm and nucleus, respectively. Due to the limited number of lanes per gel, samples were analyzed across multiple independent blots (C); quantitative analysis of PSMB5 nuclear enrichment, nuclear-to-cytoplasmic ratio of PSMB5 in each cell line (D); percentage of total PSMB5 protein localized to the nucleus (E). Data are derived from densitometric analysis of three independent subcellular fractionation experiments and are presented as mean ± SD. aP < 0.05, bP < 0.01, cP < 0.001, CRC cell lines (RKO, SW620, SW480, LoVo, HT29, LS174T, HCT116) vs FHC. PSMB5: Proteasome subunit beta 5; GAPDH: Glyceraldehyde-3-phosphate dehydrogenase; C: Cytoplasmic; N: Nuclear.
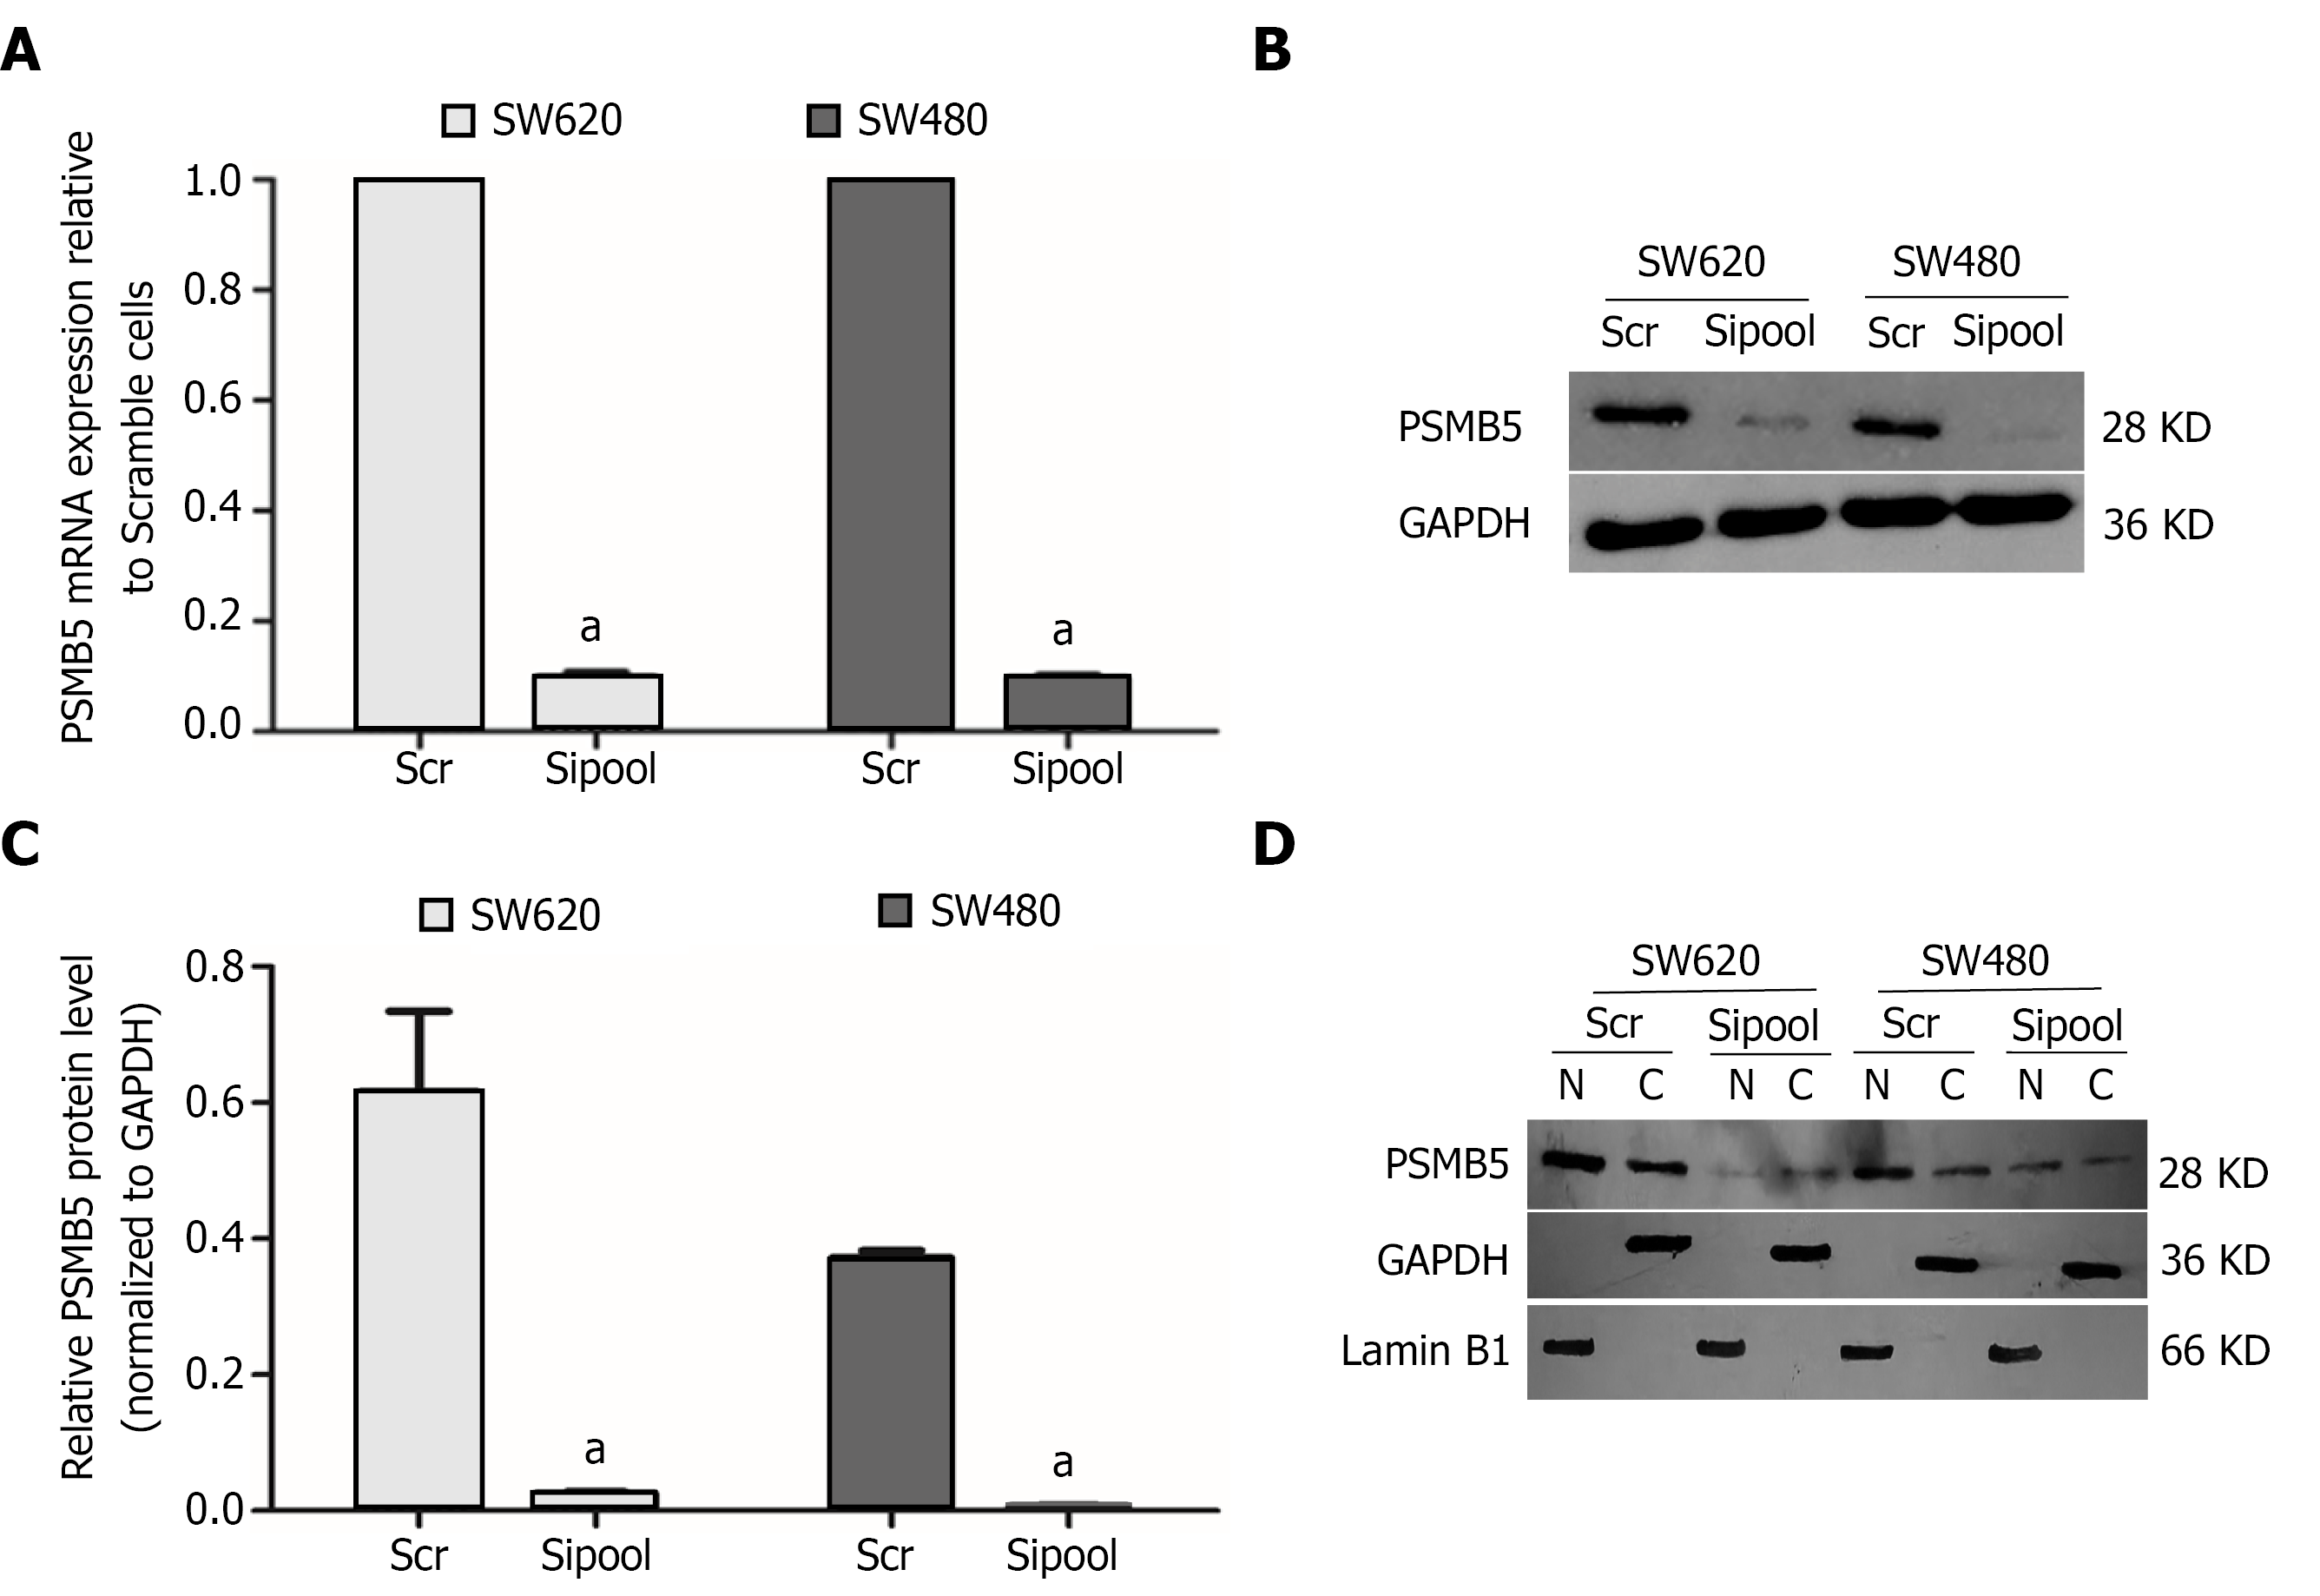
Figure 4 Efficient knockdown of proteasome subunit beta 5 in colorectal cancer cells.
A: PSMB5 mRNA levels. SW620 and SW480 cells were transfected with a PSMB5-targeting small interfering RNA (siRNA) pool or non-targeting control siRNA. PSMB5 mRNA was significantly reduced by PSMB5-targeting siRNA pool in both cell lines. Gene expression was normalized to GAPDH and is presented relative to non-targeting control siRNA (set as 1). Data are mean ± SD from three independent experiments. aP < 0.001 vs non-targeting control siRNA; B and C: PSMB5 protein levels. Whole-cell lysates were analyzed by Western blot (B) with quantitative analysis (C). GAPDH served as a loading control. Data are mean ± SD from three independent experiments. aP < 0.001 vs Scr; D: Subcellular distribution. Cytoplasmic and nuclear fractions from SW620 and SW480 cells transfected with PSMB5-targeting siRNA pool or non-targeting control siRNA were analyzed by western blot. Purity of fractions was confirmed using GAPDH (cytoplasmic marker) and Lamin B1 (nuclear marker). Scr: Non-targeting control small interfering RNA; sipool: Proteasome subunit beta 5-targeting small interfering RNA pool; PSMB5: Proteasome subunit beta 5; GAPDH: Glyceraldehyde-3-phosphate dehydrogenase; C: Cytoplasmic; N: Nuclear.
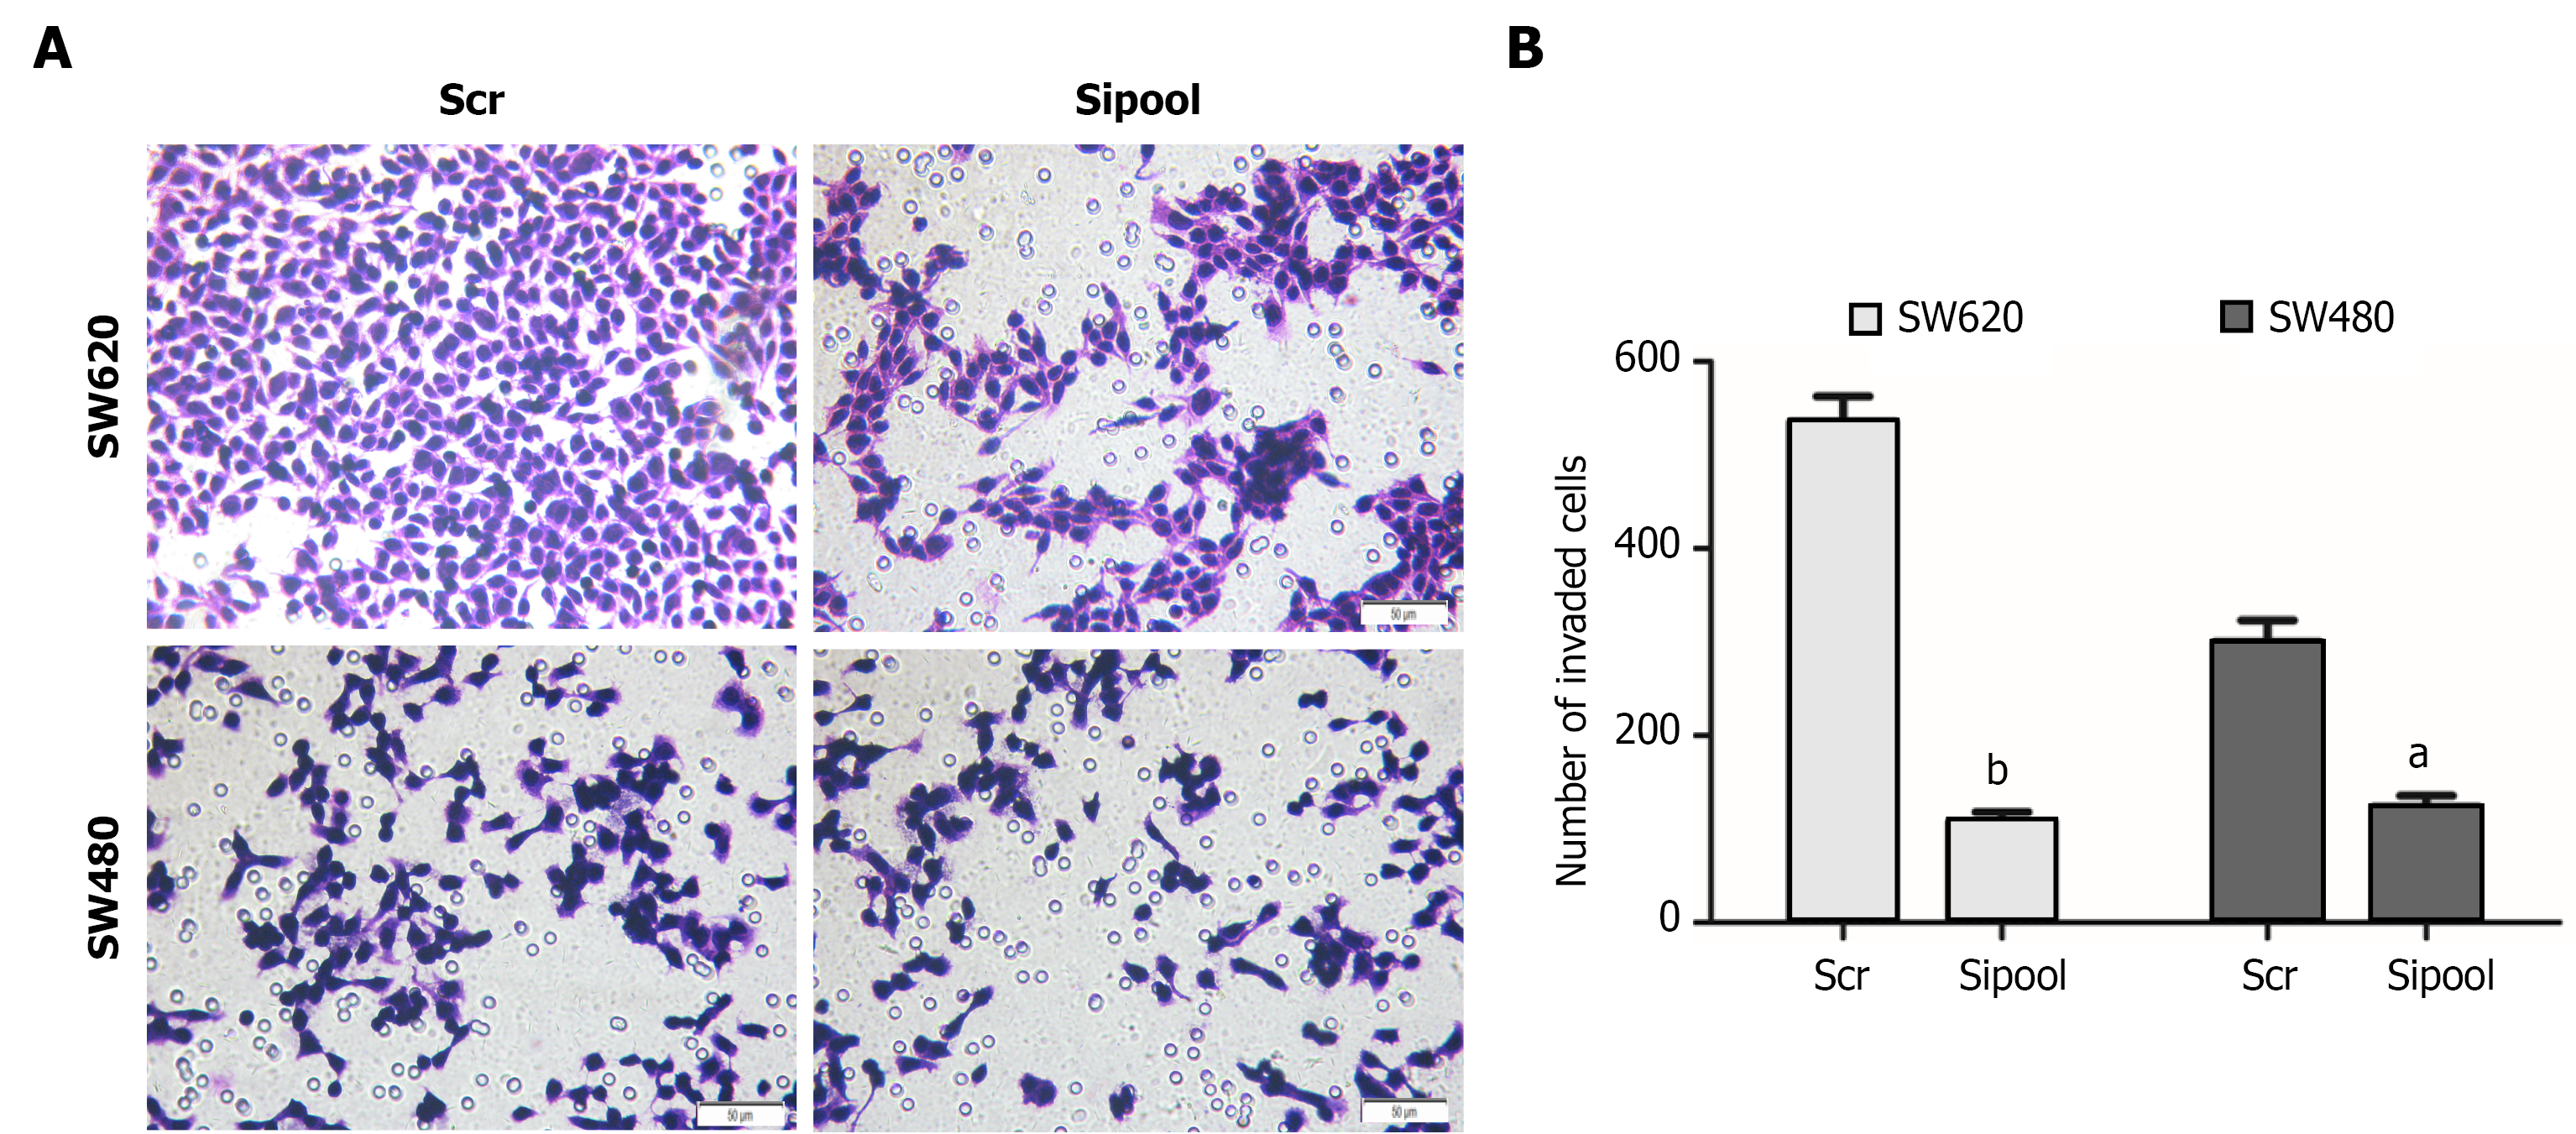
Figure 5 Effect of proteasome subunit beta 5 knockdown on the invasion of colorectal cancer cells assessed by Transwell assay.
A: Representative images of invading SW620 and SW480 cells, respectively, after proteasome subunit beta 5 knockdown; B: Quantitative analysis of invasion for SW480 and SW620 cells transfected with a proteasome subunit beta 5 small interfering RNA pool or non-targeting control mall interfering RNA. Data are presented as mean ± SD; aP < 0.05, bP < 0.01 vs non-targeting control small interfering RNA group. Scr: Non-targeting control small interfering RNA; sipool: Proteasome subunit beta 5-targeting small interfering RNA pool.
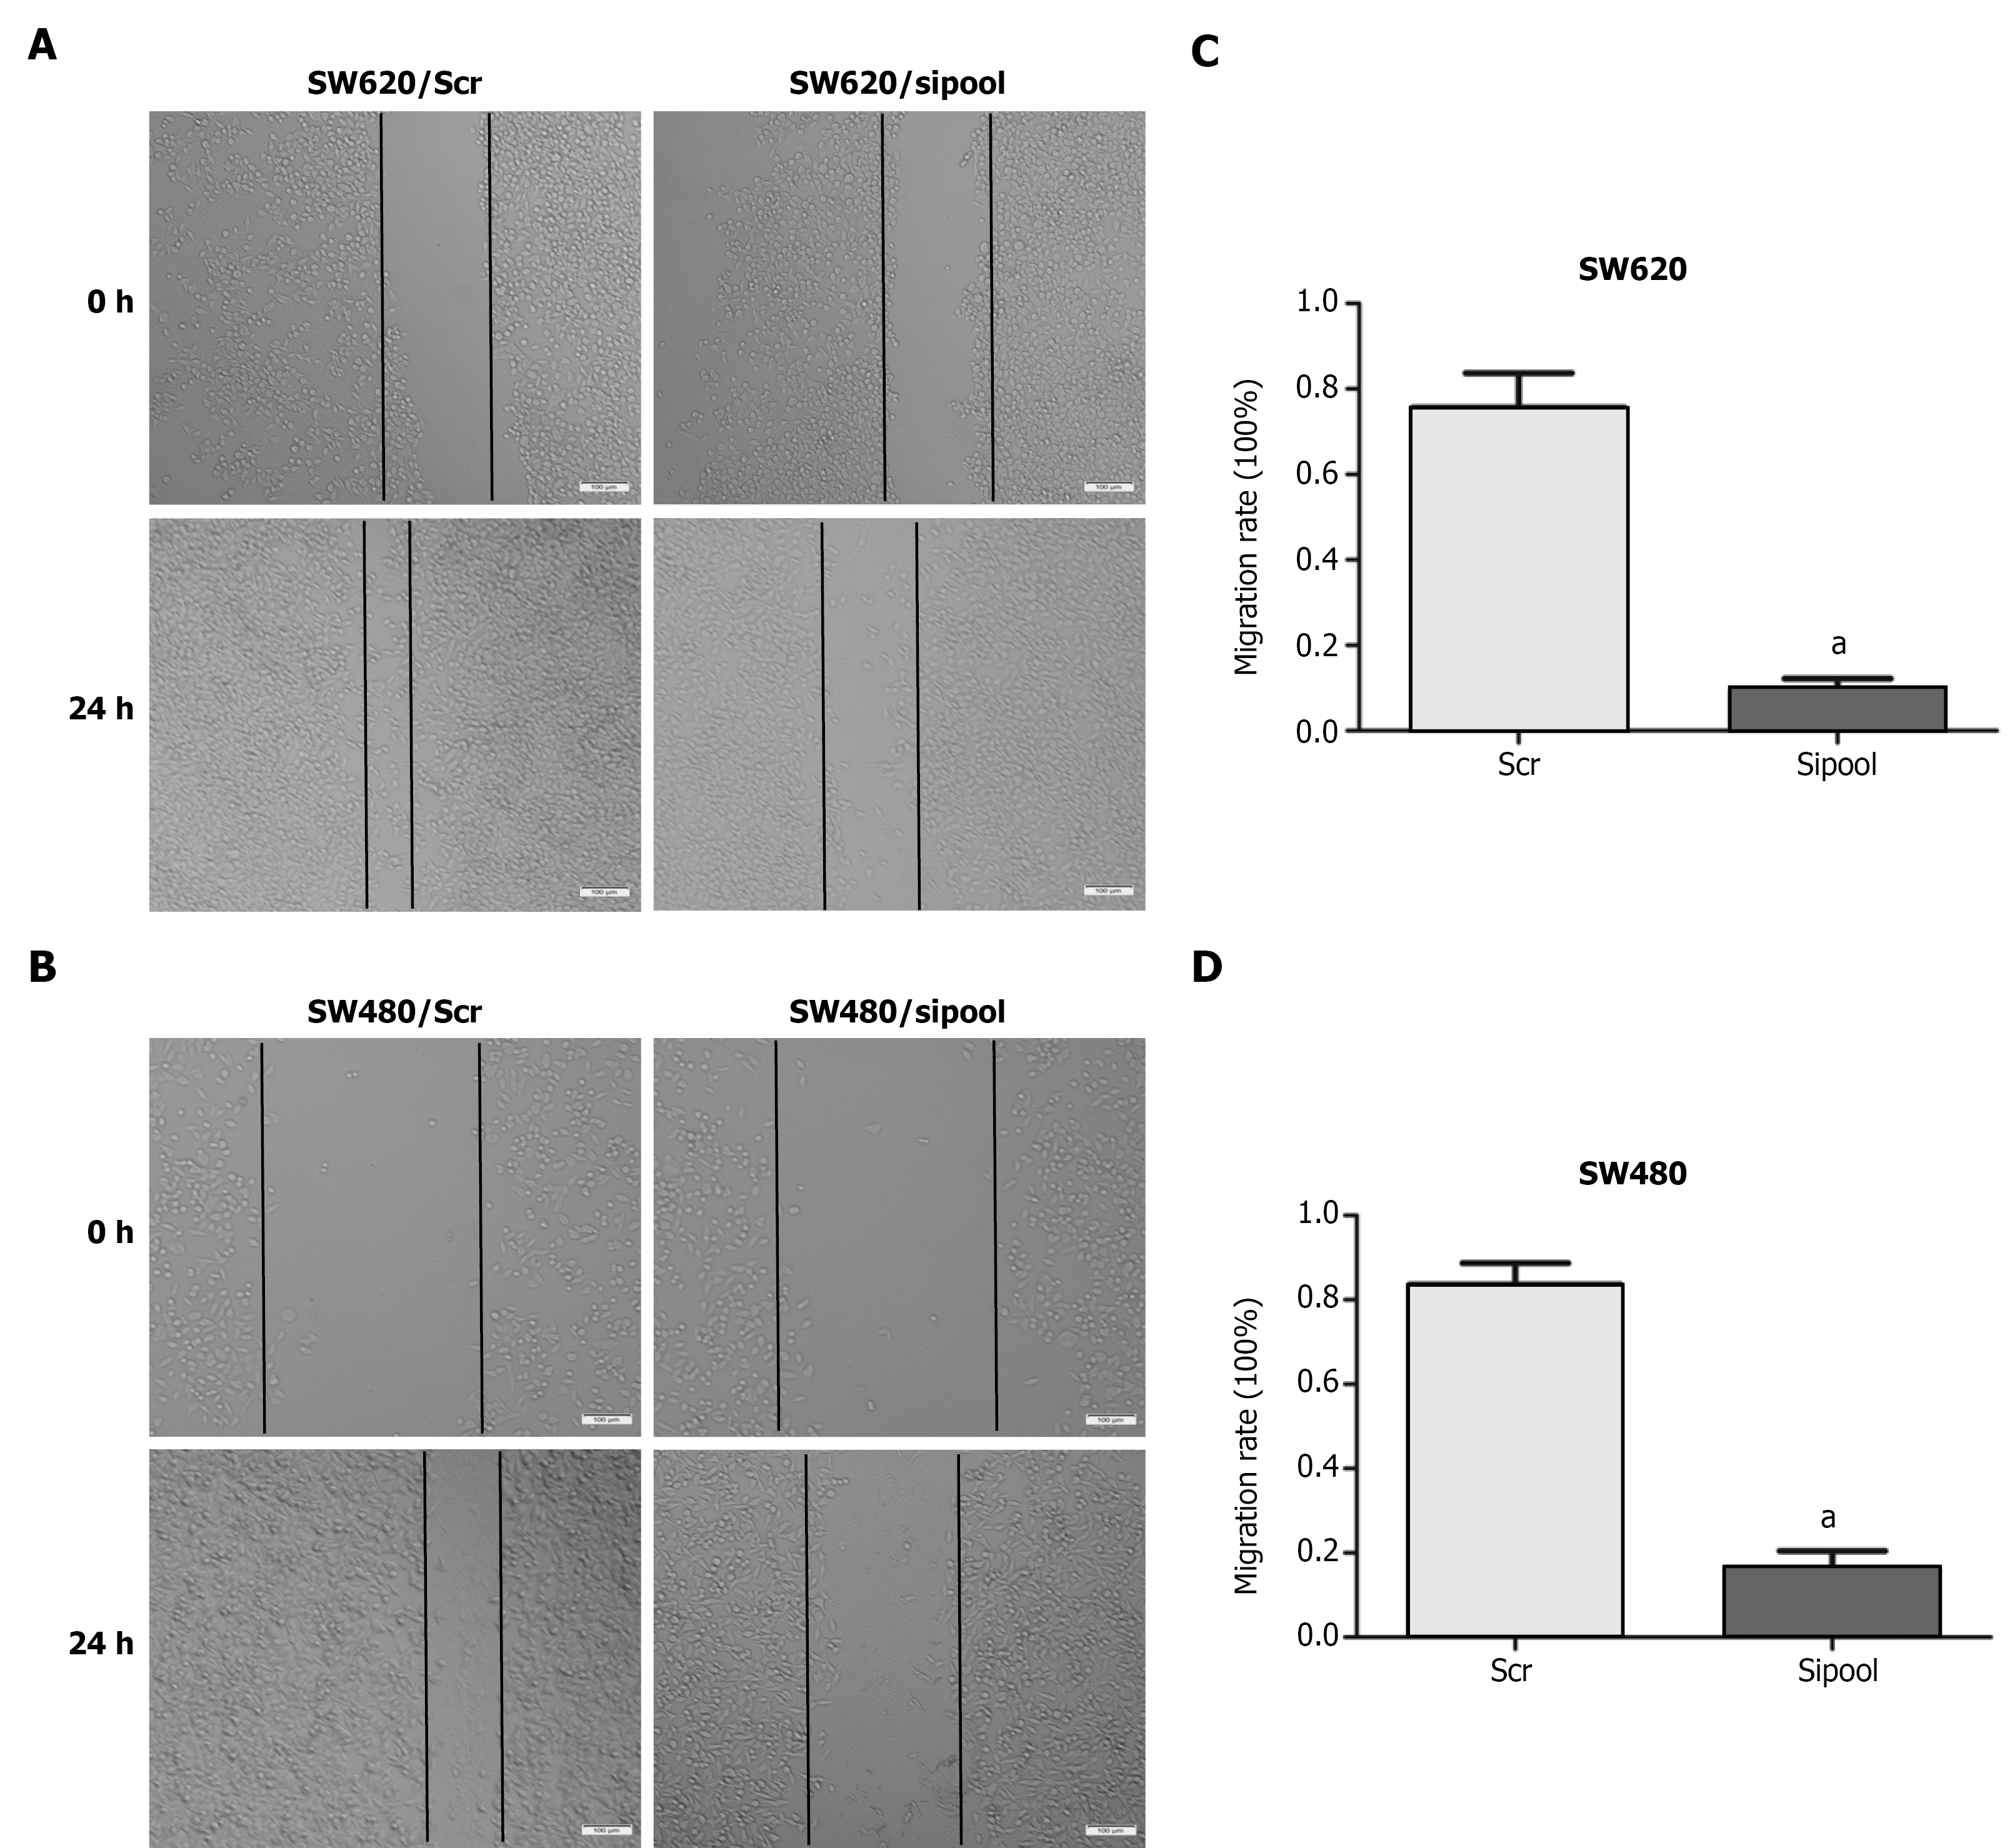
Figure 6 Impact of proteasome subunit beta 5 knockdown on colorectal cancer cell migration assessed by scratch assay.
A and B: Representative scratch assay images of SW620 and SW480 cells following proteasome subunit beta 5 silencing; C and D: Quantification of wound closure for SW620 and SW480 cells transfected with a proteasome subunit beta 5 small interfering RNA pool vs non-targeting control mall interfering RNA. Data are presented as mean ± SD; aP < 0.001 vs non-targeting control small interfering RNA group. Scr: Non-targeting control small interfering RNA; sipool: Proteasome subunit beta 5-targeting small interfering RNA pool.
- Citation: Xu AP, She SP, Xiao YS, Lang J, Yuan JF, Zeng YF. Nuclear localization of proteasome subunit beta 5 serves as an independent prognostic biomarker and promotes invasion in colorectal cancer. World J Gastrointest Oncol 2026; 18(8): 122057
- URL: https://www.wjgnet.com/1948-5204/full/v18/i8/122057.htm
- DOI: https://dx.doi.org/10.4251/wjgo.122057