
















Copyright: ©Author(s) 2026.
World J Gastrointest Oncol. Aug 15, 2026; 18(8): 120096
Published online Aug 15, 2026. doi: 10.4251/wjgo.v18.i8.120096
Published online Aug 15, 2026. doi: 10.4251/wjgo.v18.i8.120096
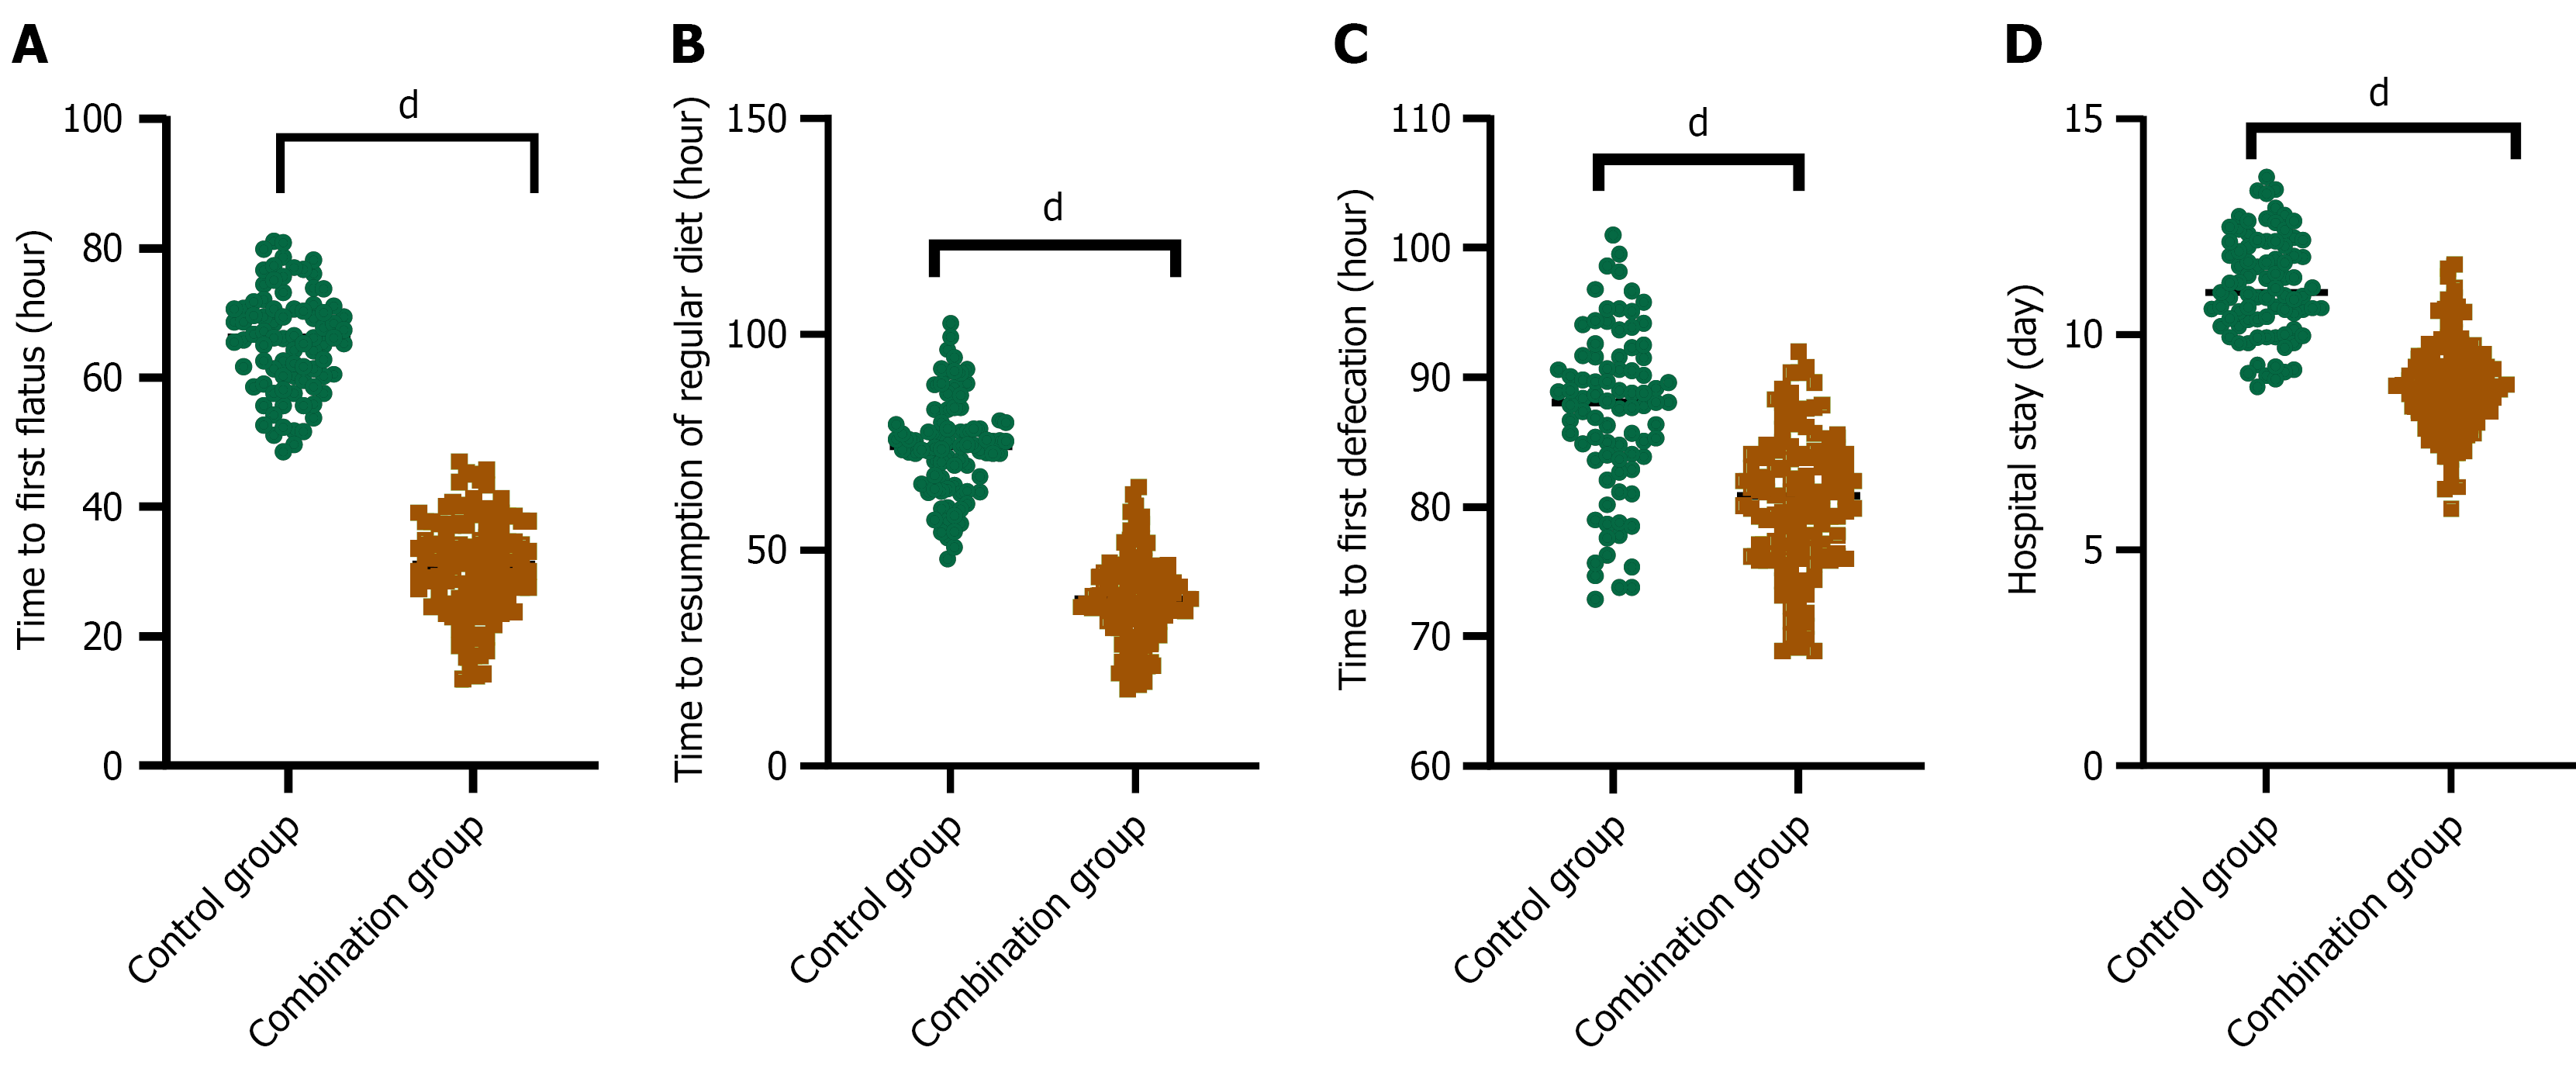
Figure 1 Comparison of postoperative recovery indices.
A: Time to first flatus; B: Time to resumption of regular diet; C: Time to first defecation; D: Hospital stay. dP < 0.0001.
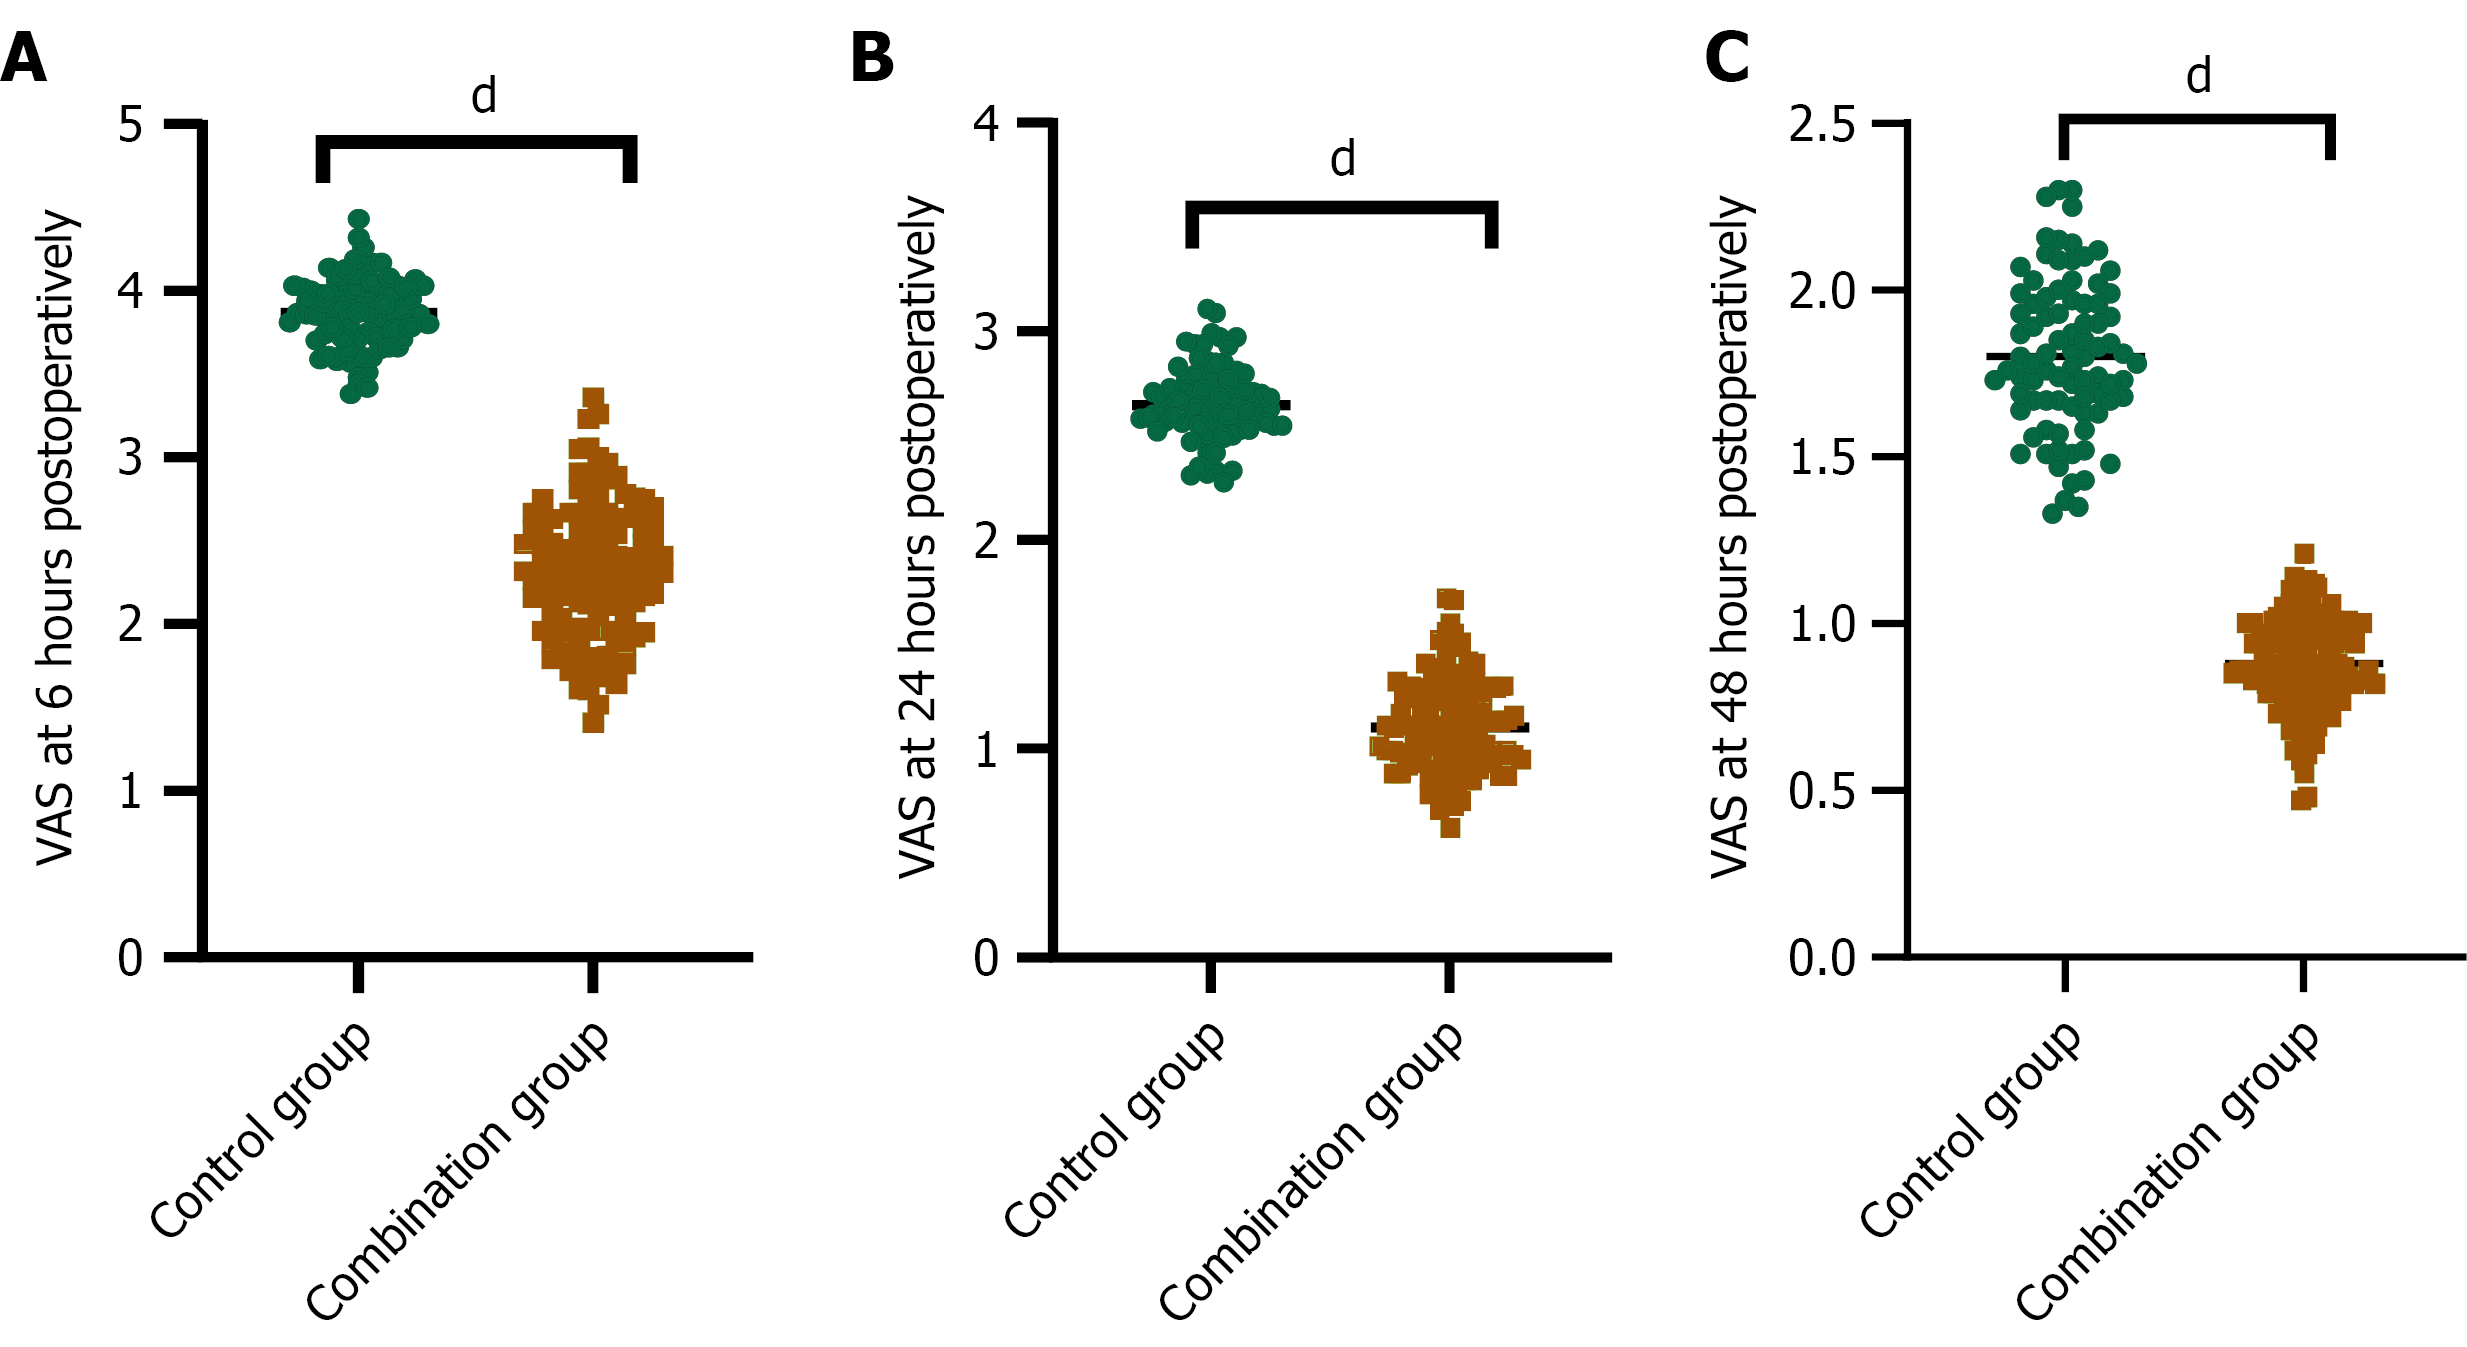
Figure 2 Comparison of visual analog scale scores between the two groups.
A: 6 hours; B: 24 hours; C: 48 hours. dP < 0.0001. VAS: Visual analog scale.
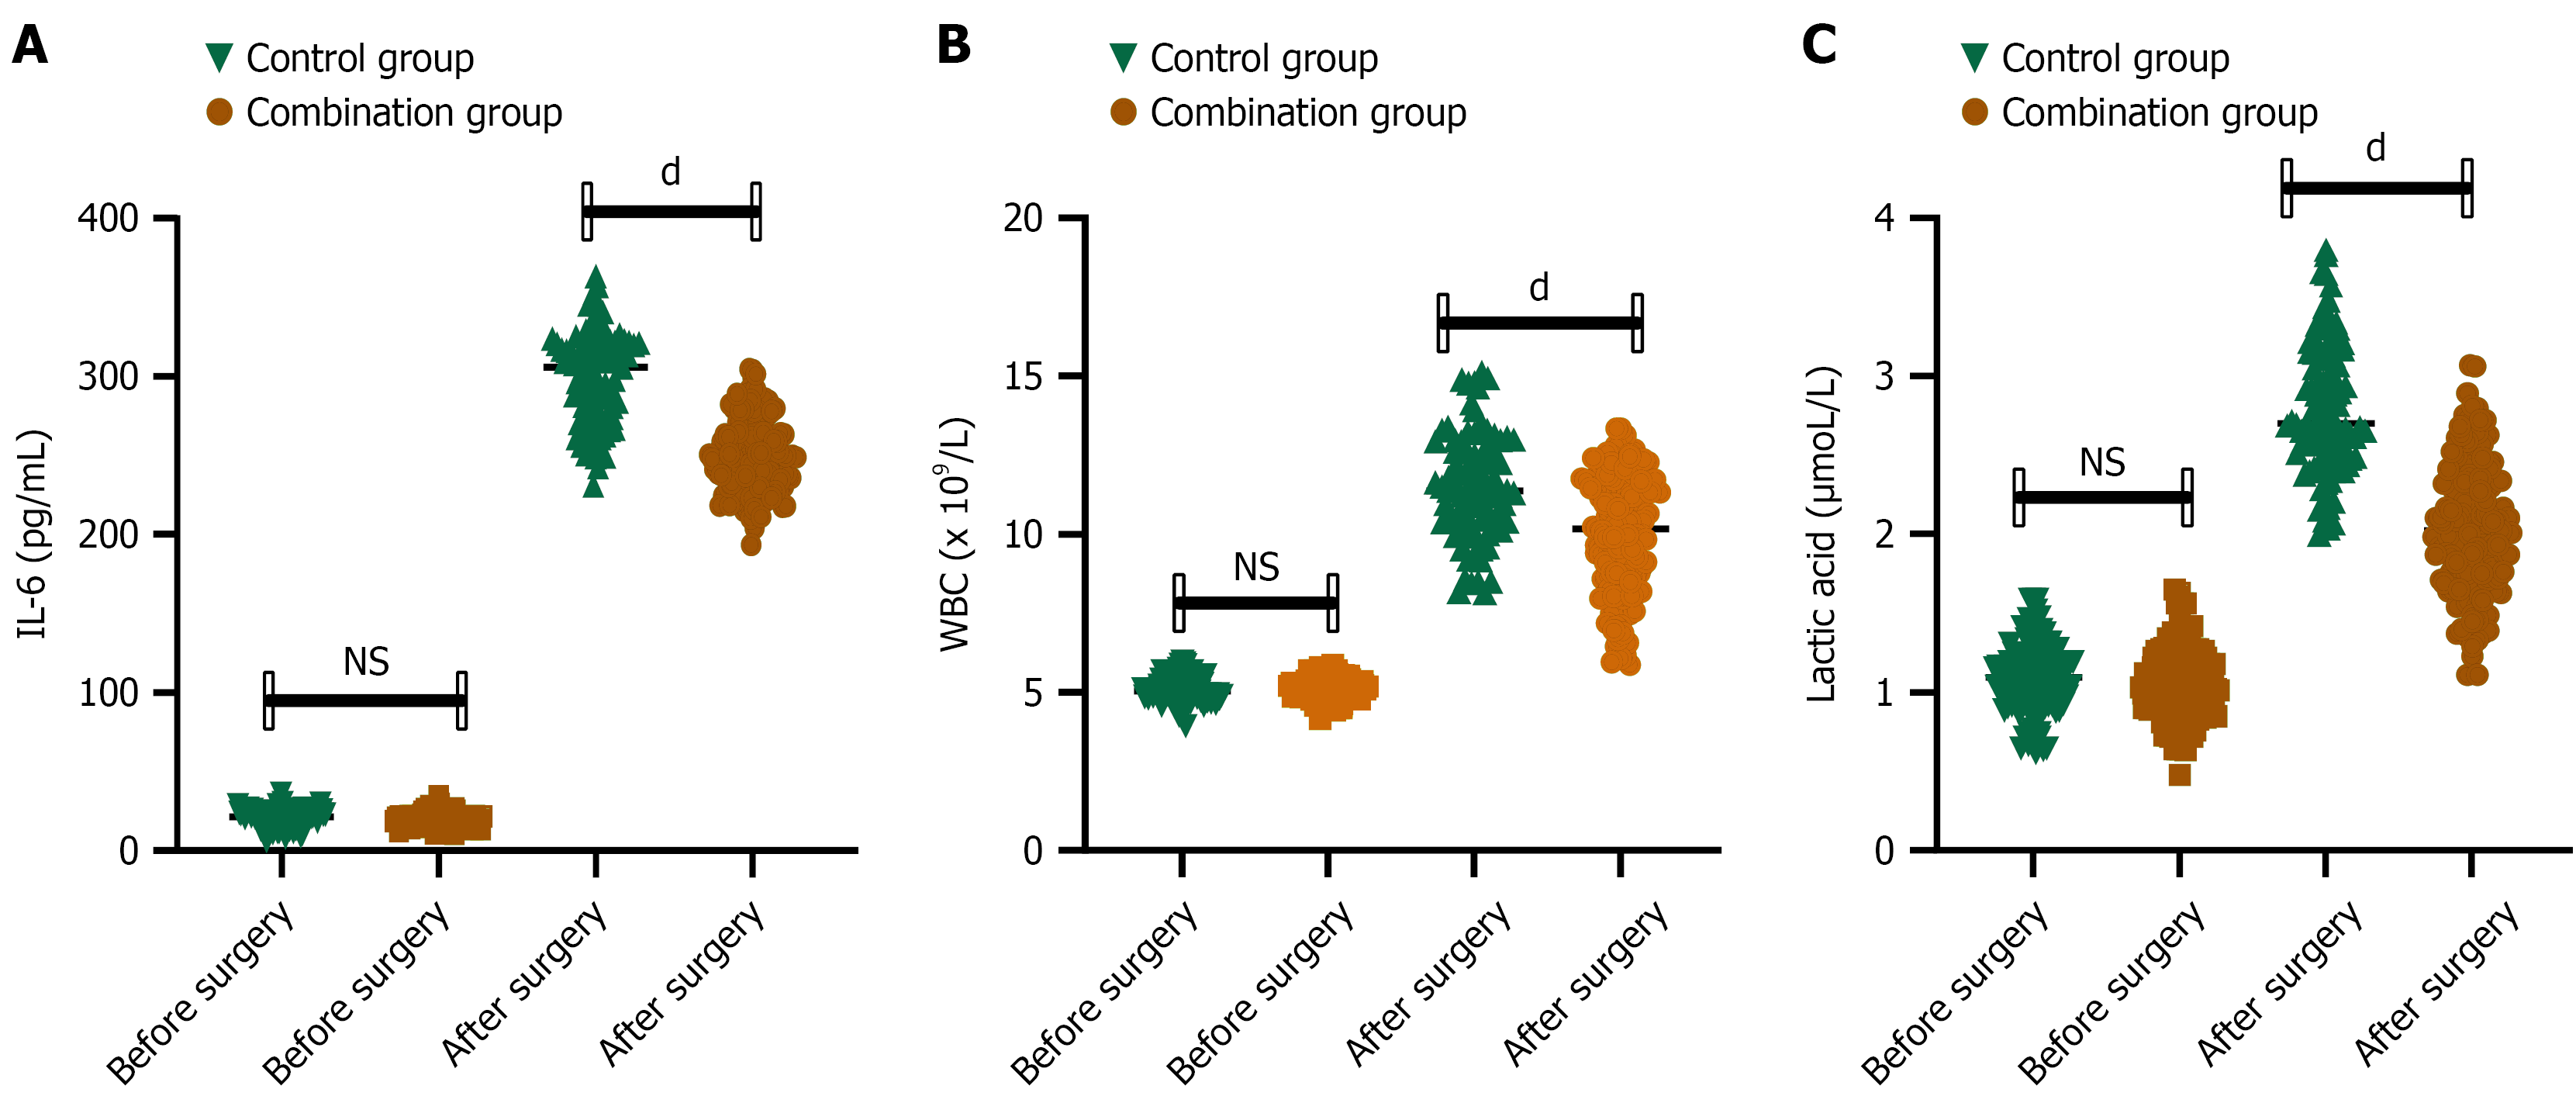
Figure 3 Comparison of pre- and post-operative inflammatory and stress indices.
A: Interleukin-6; B: White blood cell; C: Lactate. dP < 0.0001. NS: Not significant; IL-6: Interleukin-6; WBC: White blood cell.
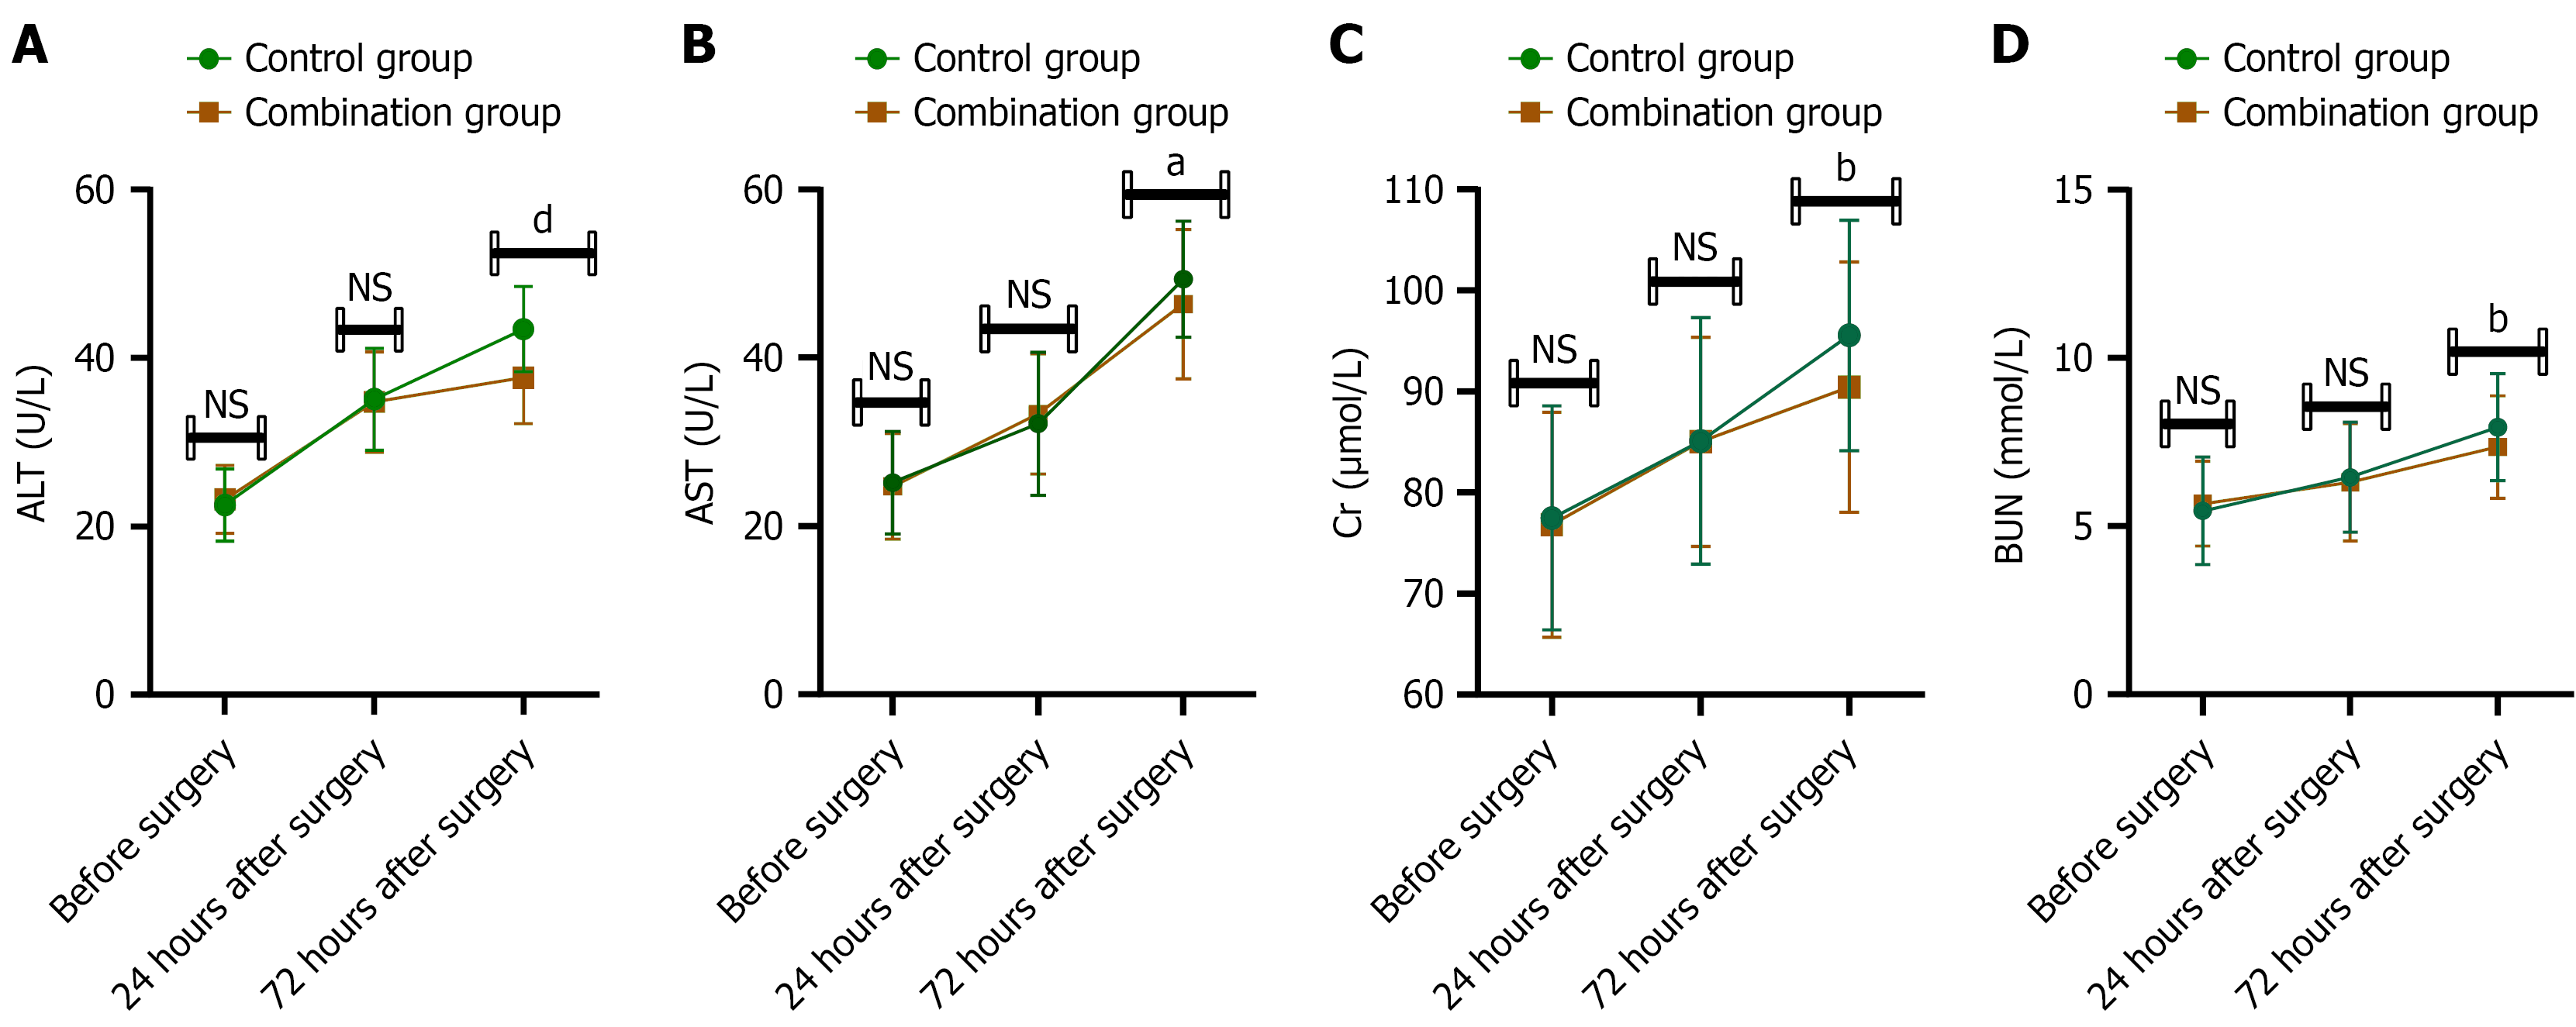
Figure 4 Comparison of pre- and post-operative liver and kidney function indices.
A: Alanine aminotransferase; B: Aspartate aminotransferase; C: Serum creatinine; D: Blood urea nitrogen. aP < 0.05; bP < 0.01; dP < 0.0001. NS: Not significant; ALT: Alanine aminotransferase; AST: Aspartate aminotransferase; Cr: Creatinine; BUN: Blood urea nitrogen.
- Citation: Pei WM, Ye Y, Liu J, Tan HL, Tang YX, Liu JT. Effects of general anesthesia plus ropivacaine transversus abdominis plane block on analgesia and organ protection in colorectal cancer surgery. World J Gastrointest Oncol 2026; 18(8): 120096
- URL: https://www.wjgnet.com/1948-5204/full/v18/i8/120096.htm
- DOI: https://dx.doi.org/10.4251/wjgo.v18.i8.120096