
















Copyright: ©Author(s) 2026.
World J Gastrointest Oncol. Aug 15, 2026; 18(8): 119834
Published online Aug 15, 2026. doi: 10.4251/wjgo.119834
Published online Aug 15, 2026. doi: 10.4251/wjgo.119834
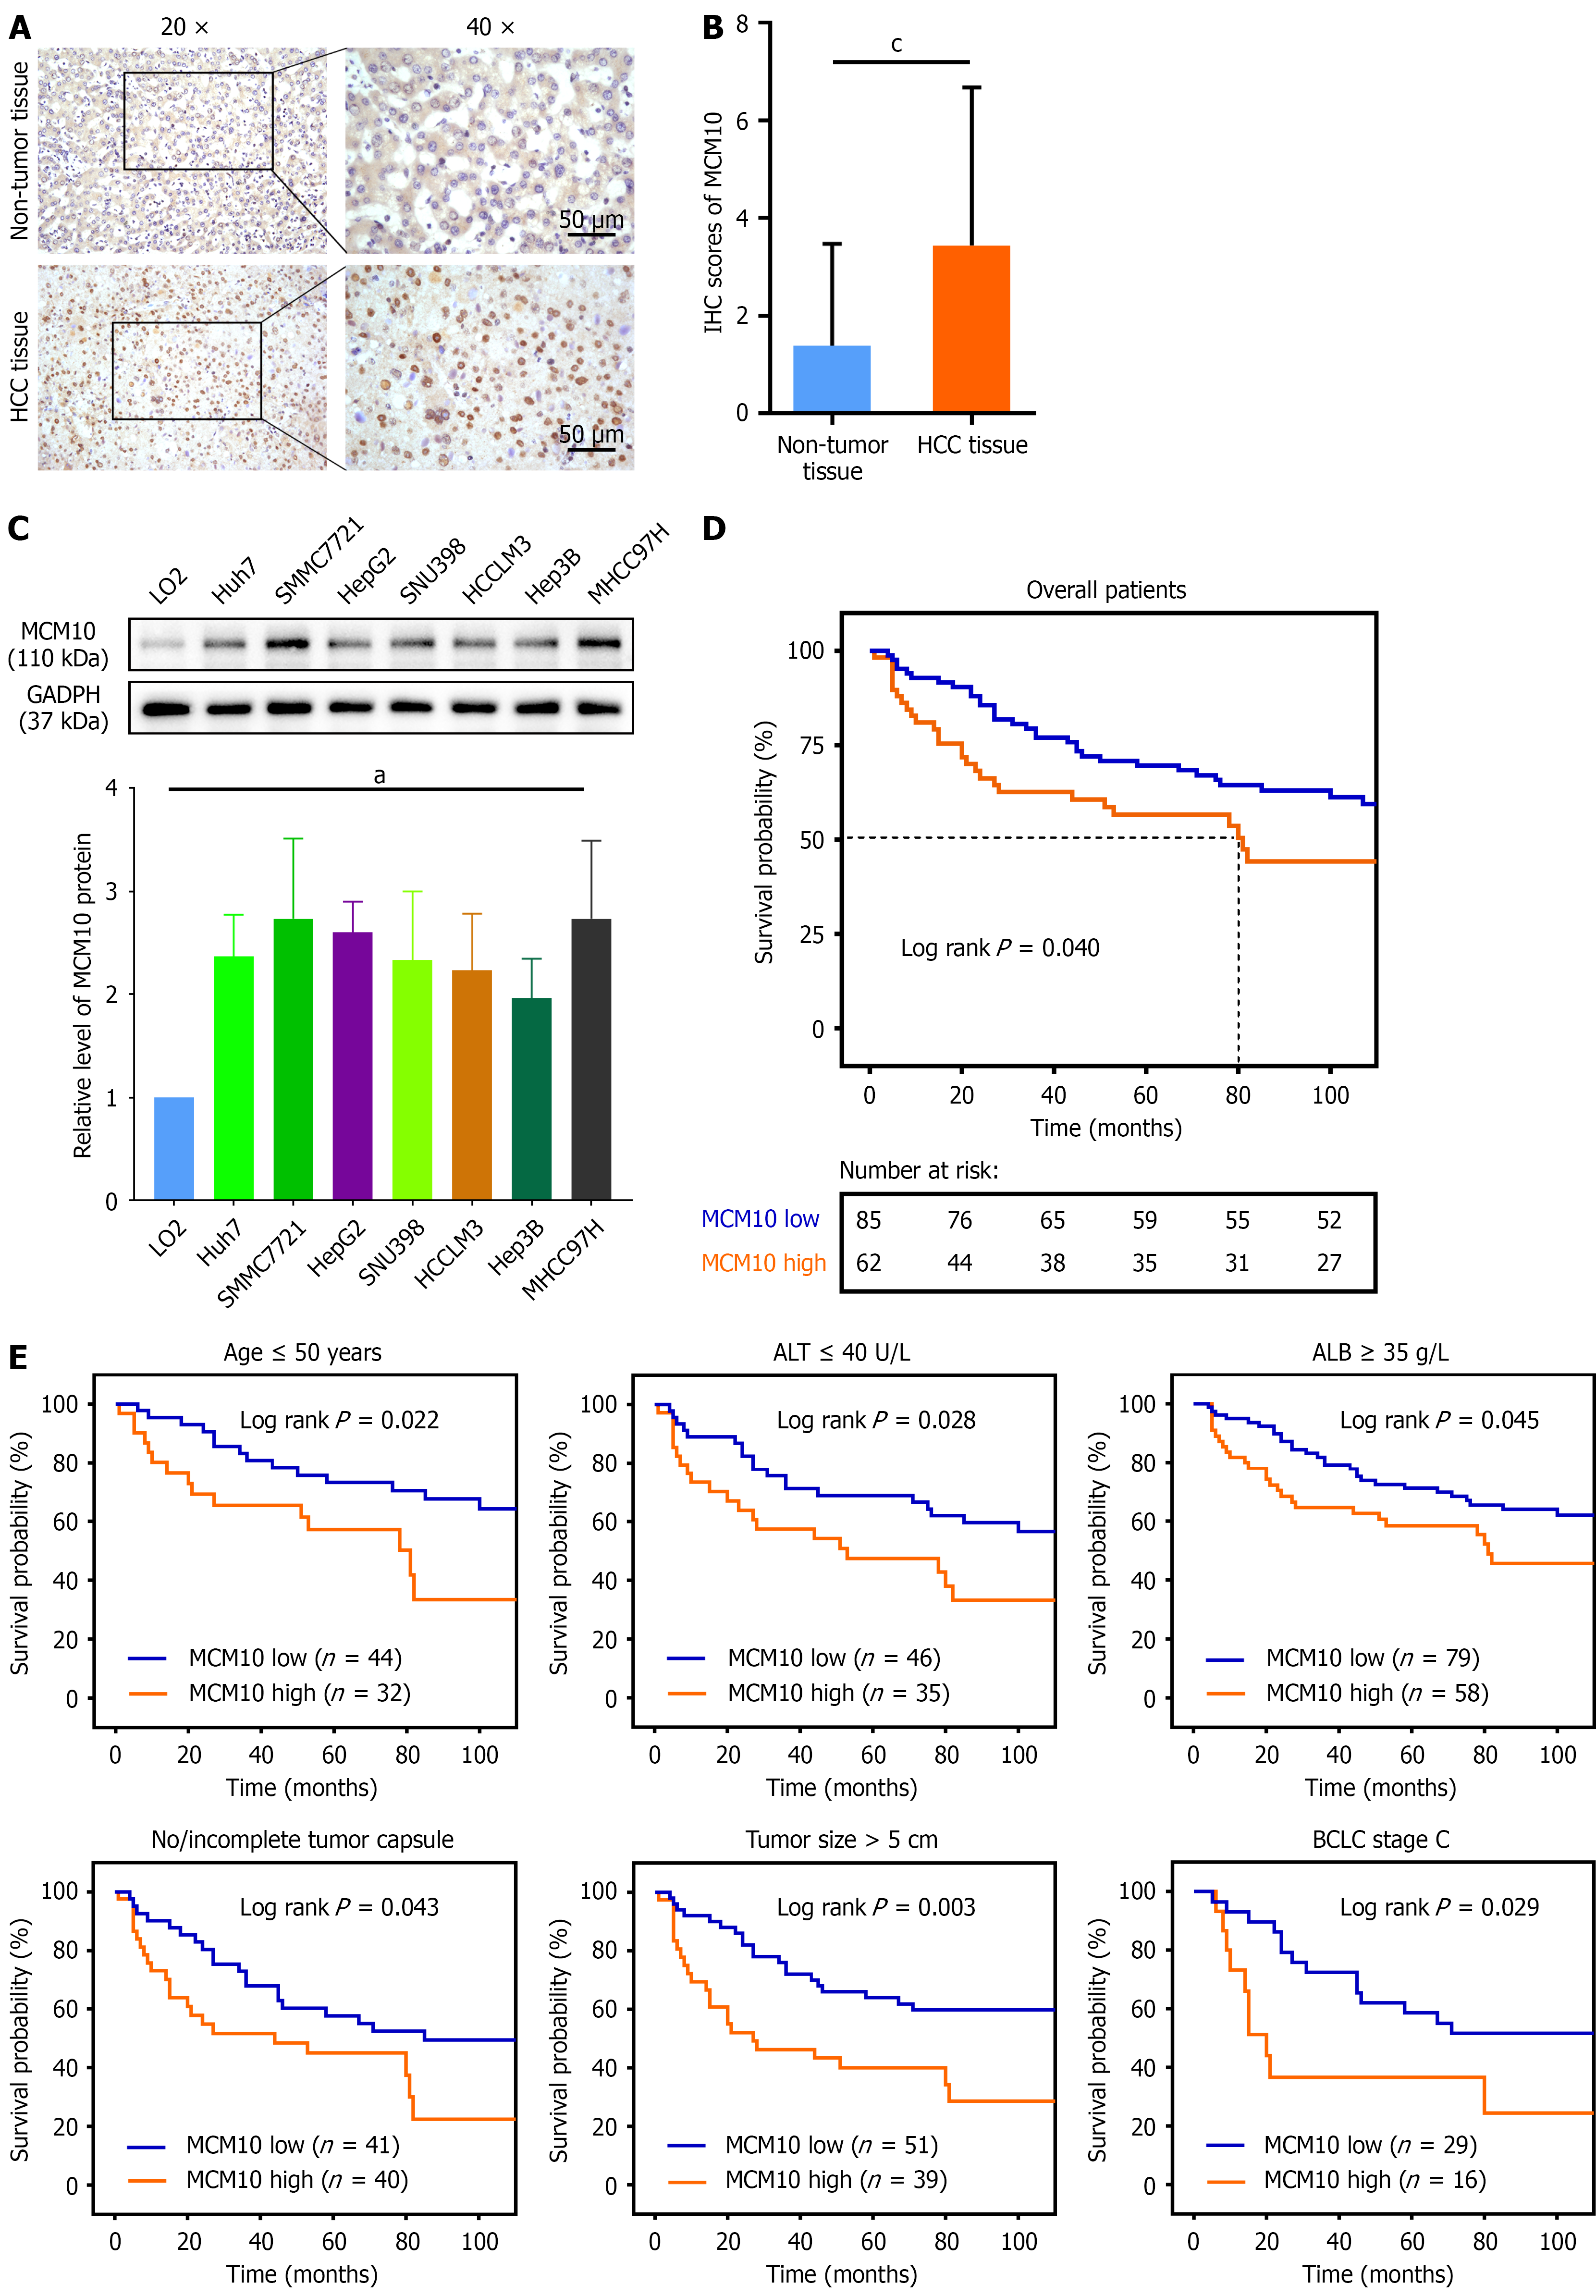
Figure 1 MCM10 expression is significantly upregulated in hepatocellular carcinoma and indicates poor prognosis.
A: Representative immunohistochemistry (IHC) images of MCM10 in human hepatocellular carcinoma (HCC) and nontumor tissues; B: The IHC scores of MCM10 in HCC and nontumor tissues; C: Expression of MCM10 in the immortalized hepatocyte cell line LO2 and seven HCC cell lines (Huh7, Hep3B, HCCLM3, SNU398, HepG2, SMMC7721, and MHCC97H) analyzed by quantitative real-time PCR and western blotting; D and E: The cumulative overall survival differences between patients with low and high MCM10 expression in all patients and different subgroups. aP < 0.05, cP < 0.001. HCC: Hepatocellular carcinoma; ALT: Alanine aminotransferase; BCLC: Barcelona Clinic Liver Cancer; ALB: Albumin.
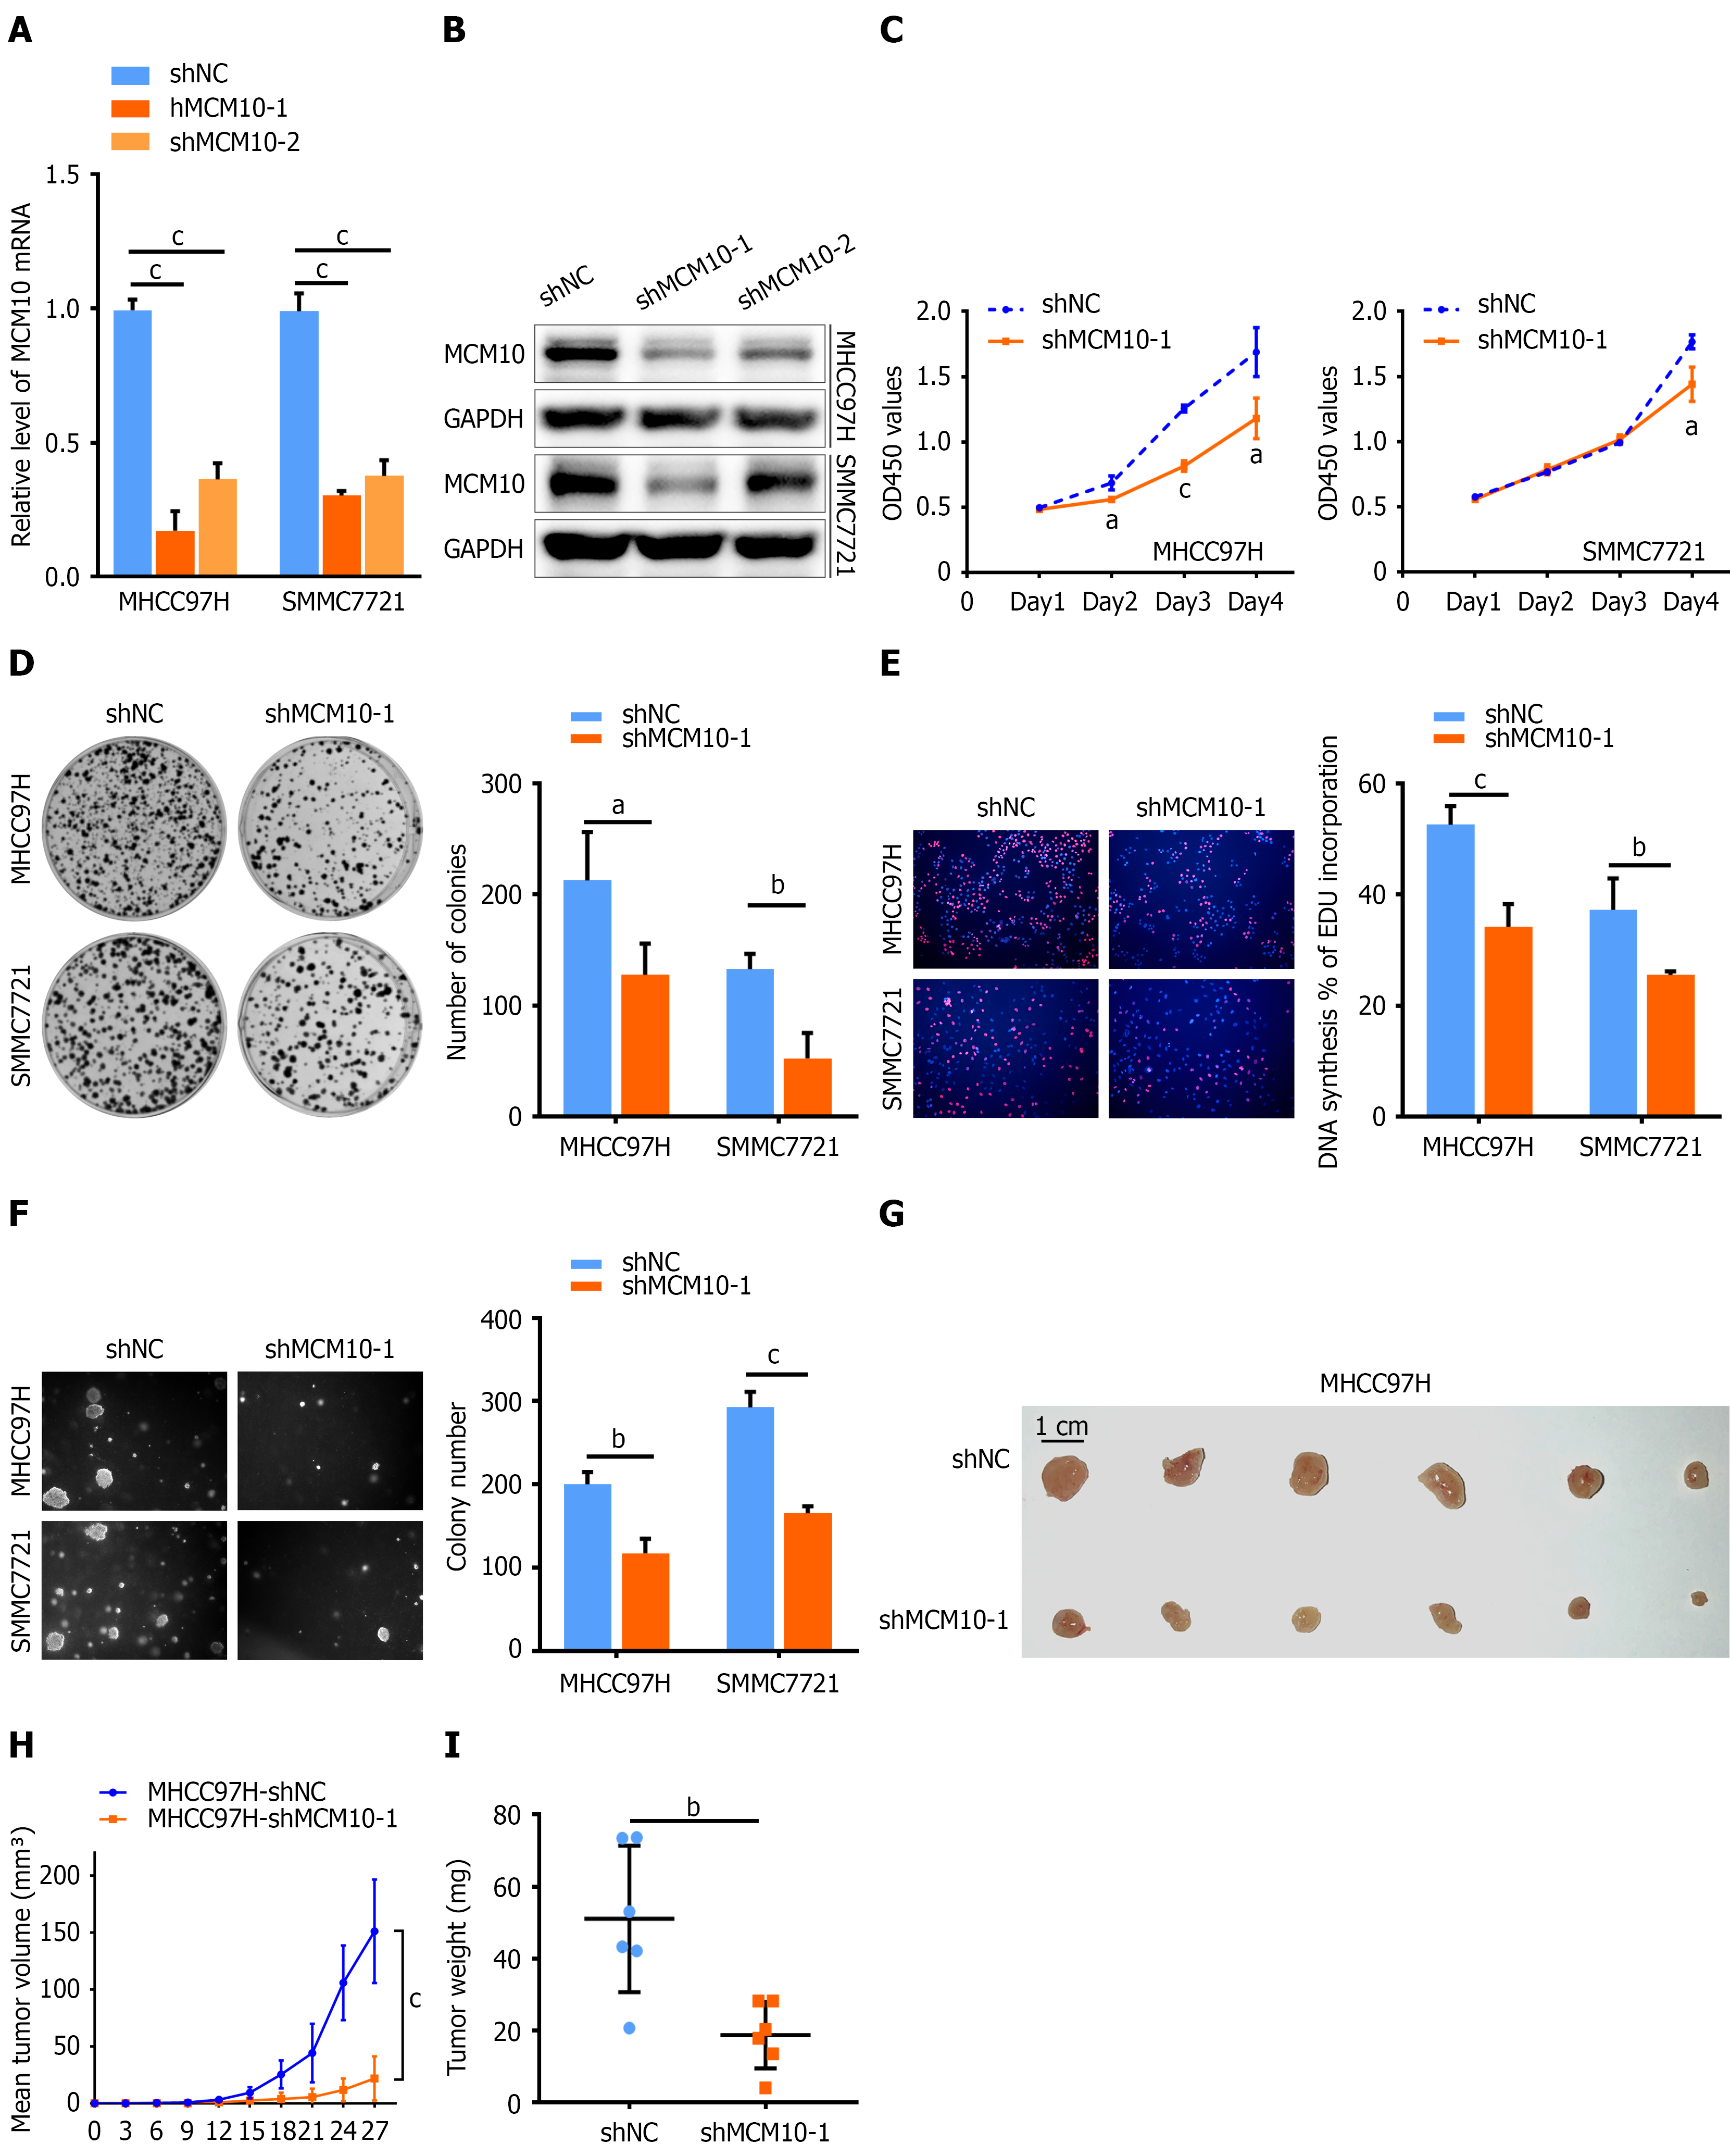
Figure 2 MCM10 knockdown inhibits hepatocellular carcinoma tumorigenesis in vitro and in vivo.
A and B: The mRNA and protein levels of MCM10-knockdown hepatocellular carcinoma cells and corresponding control cells; C: Cell viability was detected by Cell Counting Kit-8 assay in MCM10-knockdown cells (MHCC97H and SMMC7721); D: Representative images and summary of foci formation in MCM10-knockdown cells (MHCC97H and SMMC7721); E: Cell proliferation was detected by EdU assay in MCM10-knockdown cells (MHCC97H and SMMC7721); F: Representative images and summary of soft agar colony formation in MCM10-knockdown cells (MHCC97H and SMMC7721); G: Subcutaneous tumors formed in nude mice of MHCC97H-shMCM10-1 and shNC cells (n = 6); H: Tumor growth curves were summarized in the line chart between MCM10-knockdown cells and control cells; I: The tumor weight of xenografts was obtained in nude mice. aP < 0.05, bP < 0.01, cP < 0.001.
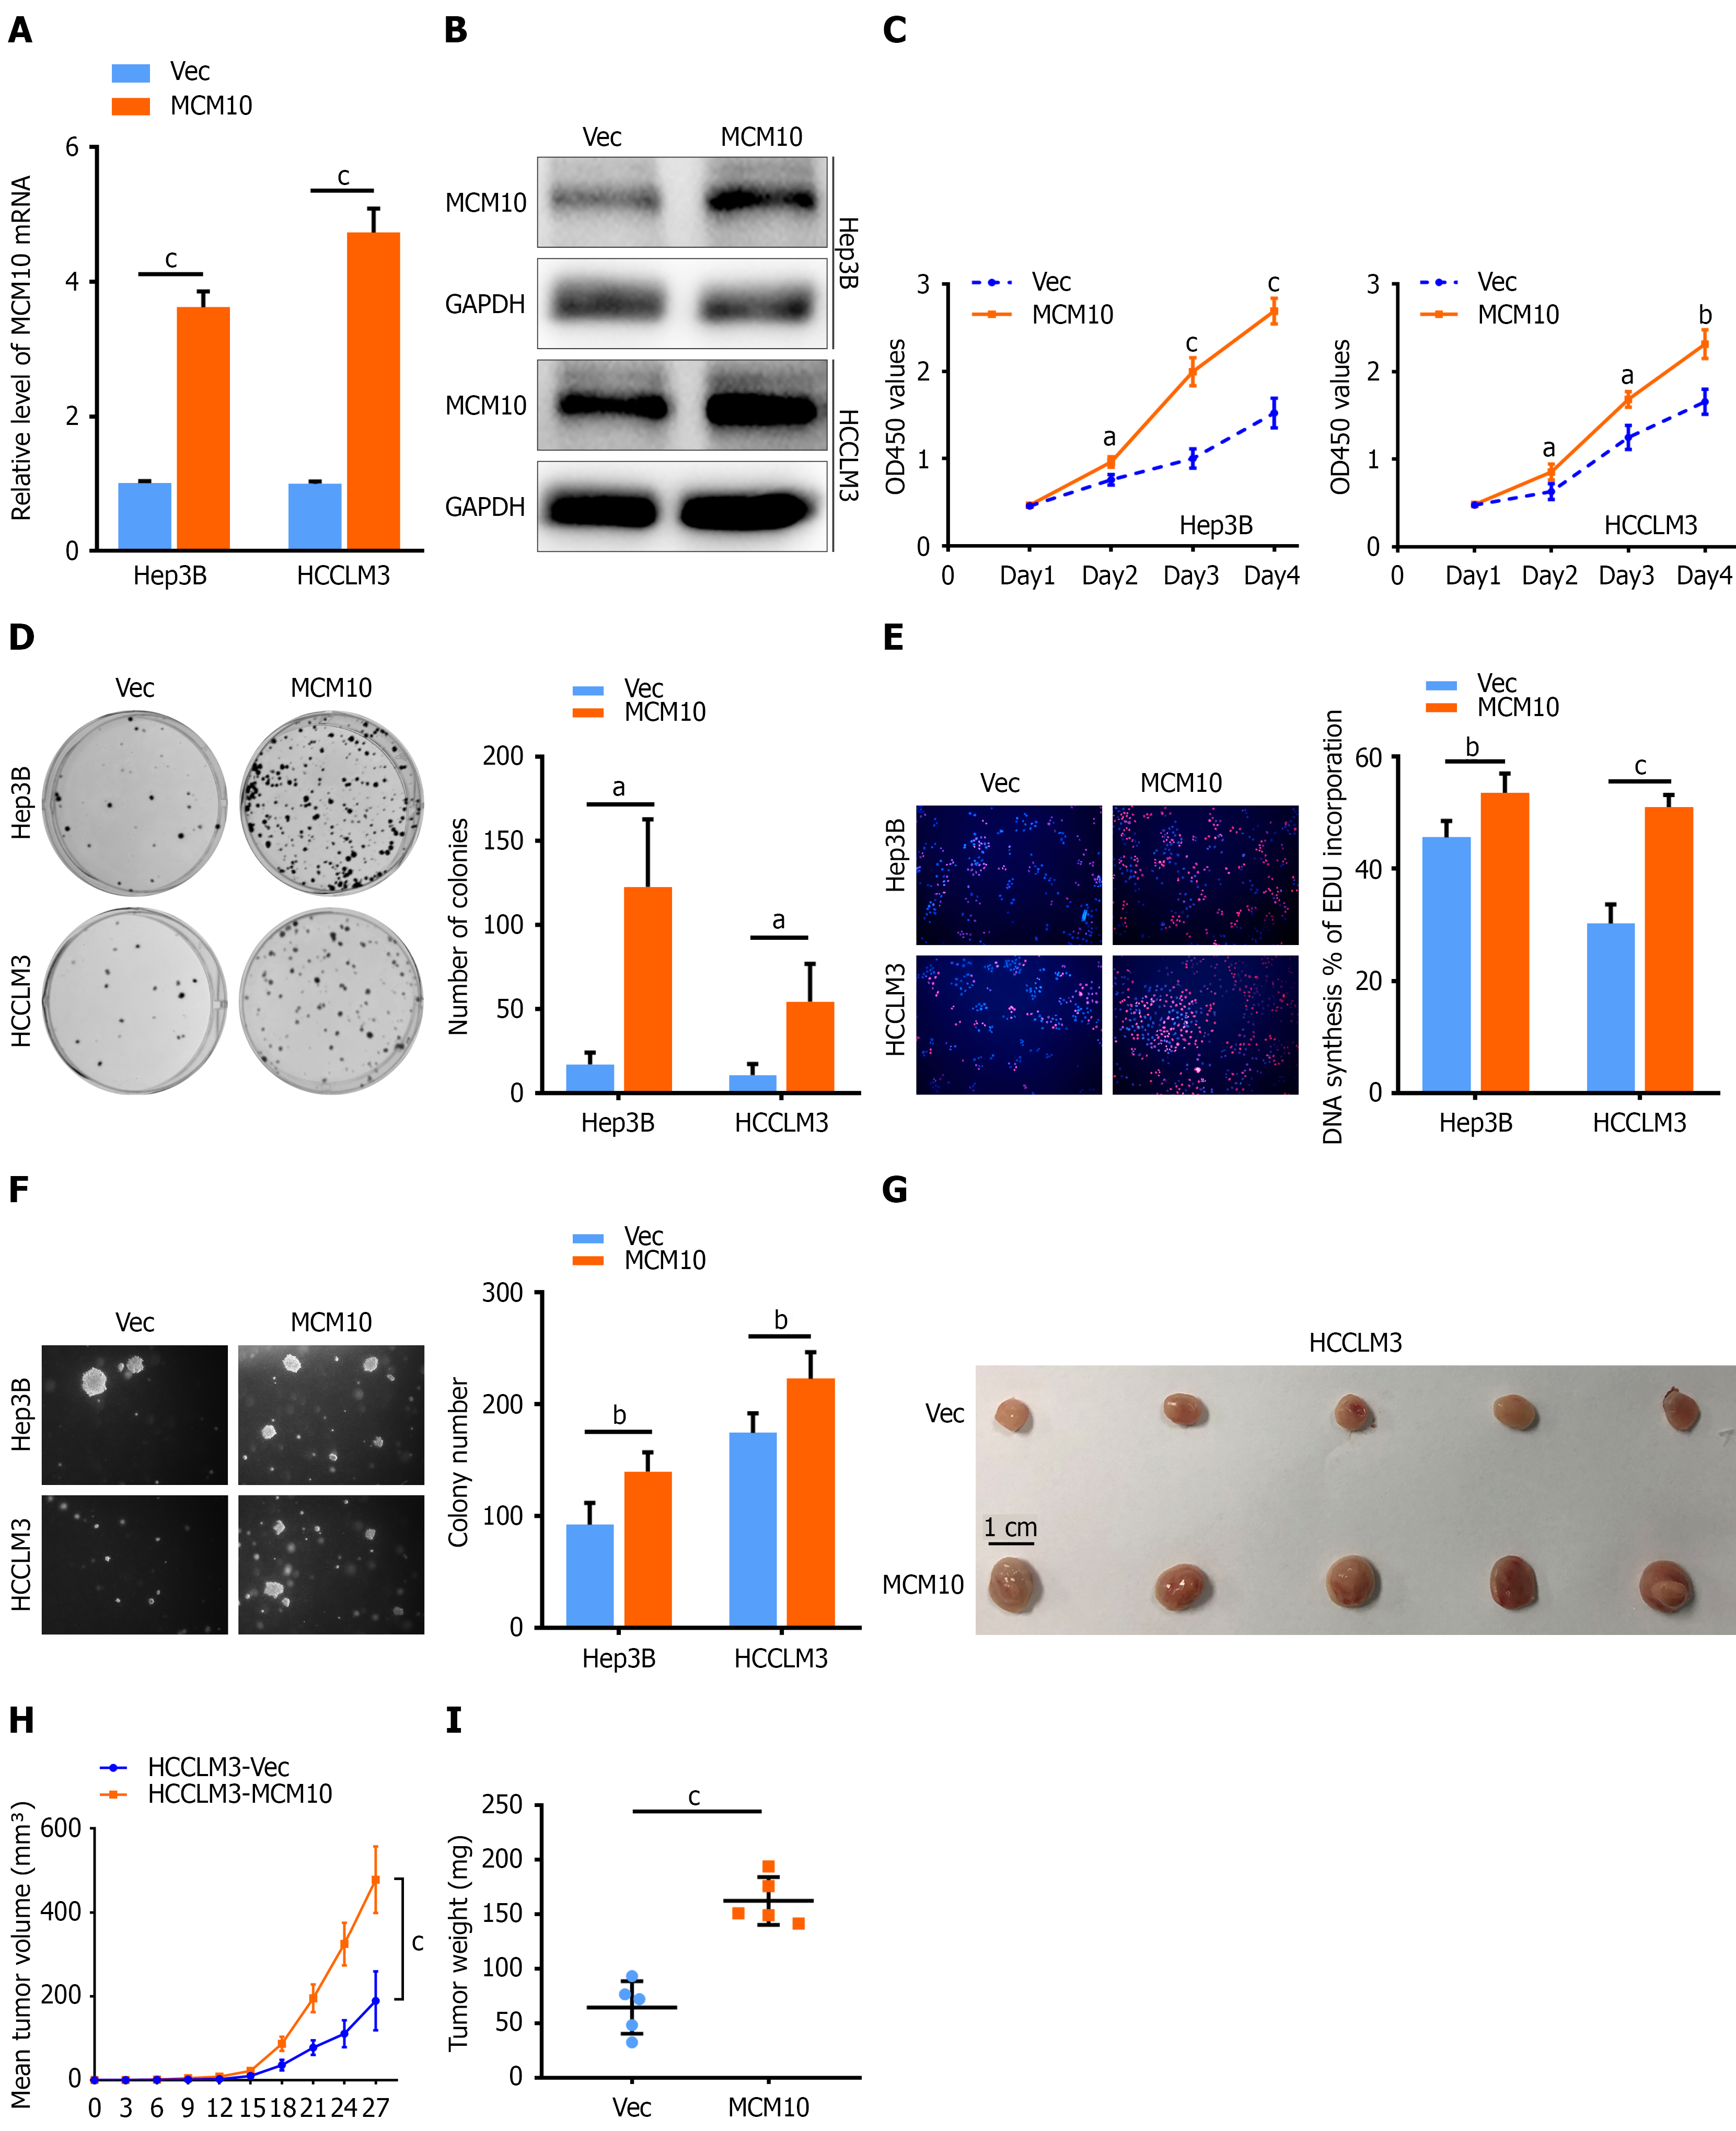
Figure 3 MCM10 overexpression promotes hepatocellular carcinoma tumorigenesis in vitro and in vivo.
A and B: The mRNA and protein levels of MCM10-overexpressed hepatocellular carcinoma cells and corresponding control cells; C: Cell viability was detected by Cell Counting Kit-8 assay in MCM10-overexpressed cells (Hep3B and HCCLM3); D: Representative images and summary of foci formation in MCM10-overexpressed cells (Hep3B and HCCLM3); E: Cell proliferation was detected by EdU assay in MCM10-overexpressed cells (Hep3B and HCCLM3); F: Representative images and summary of soft agar colony formation in MCM10-overexpressing cells (Hep3B and HCCLM3); G: Subcutaneous tumors formed in nude mice of HCCLM3-MCM10 and control cells (n = 5); H: Tumor growth curves were summarized in the line chart between MCM10-overexpressing cells and control cells; I: The tumor weight of xenografts in nude mice. aP < 0.05, bP < 0.01, cP < 0.001.
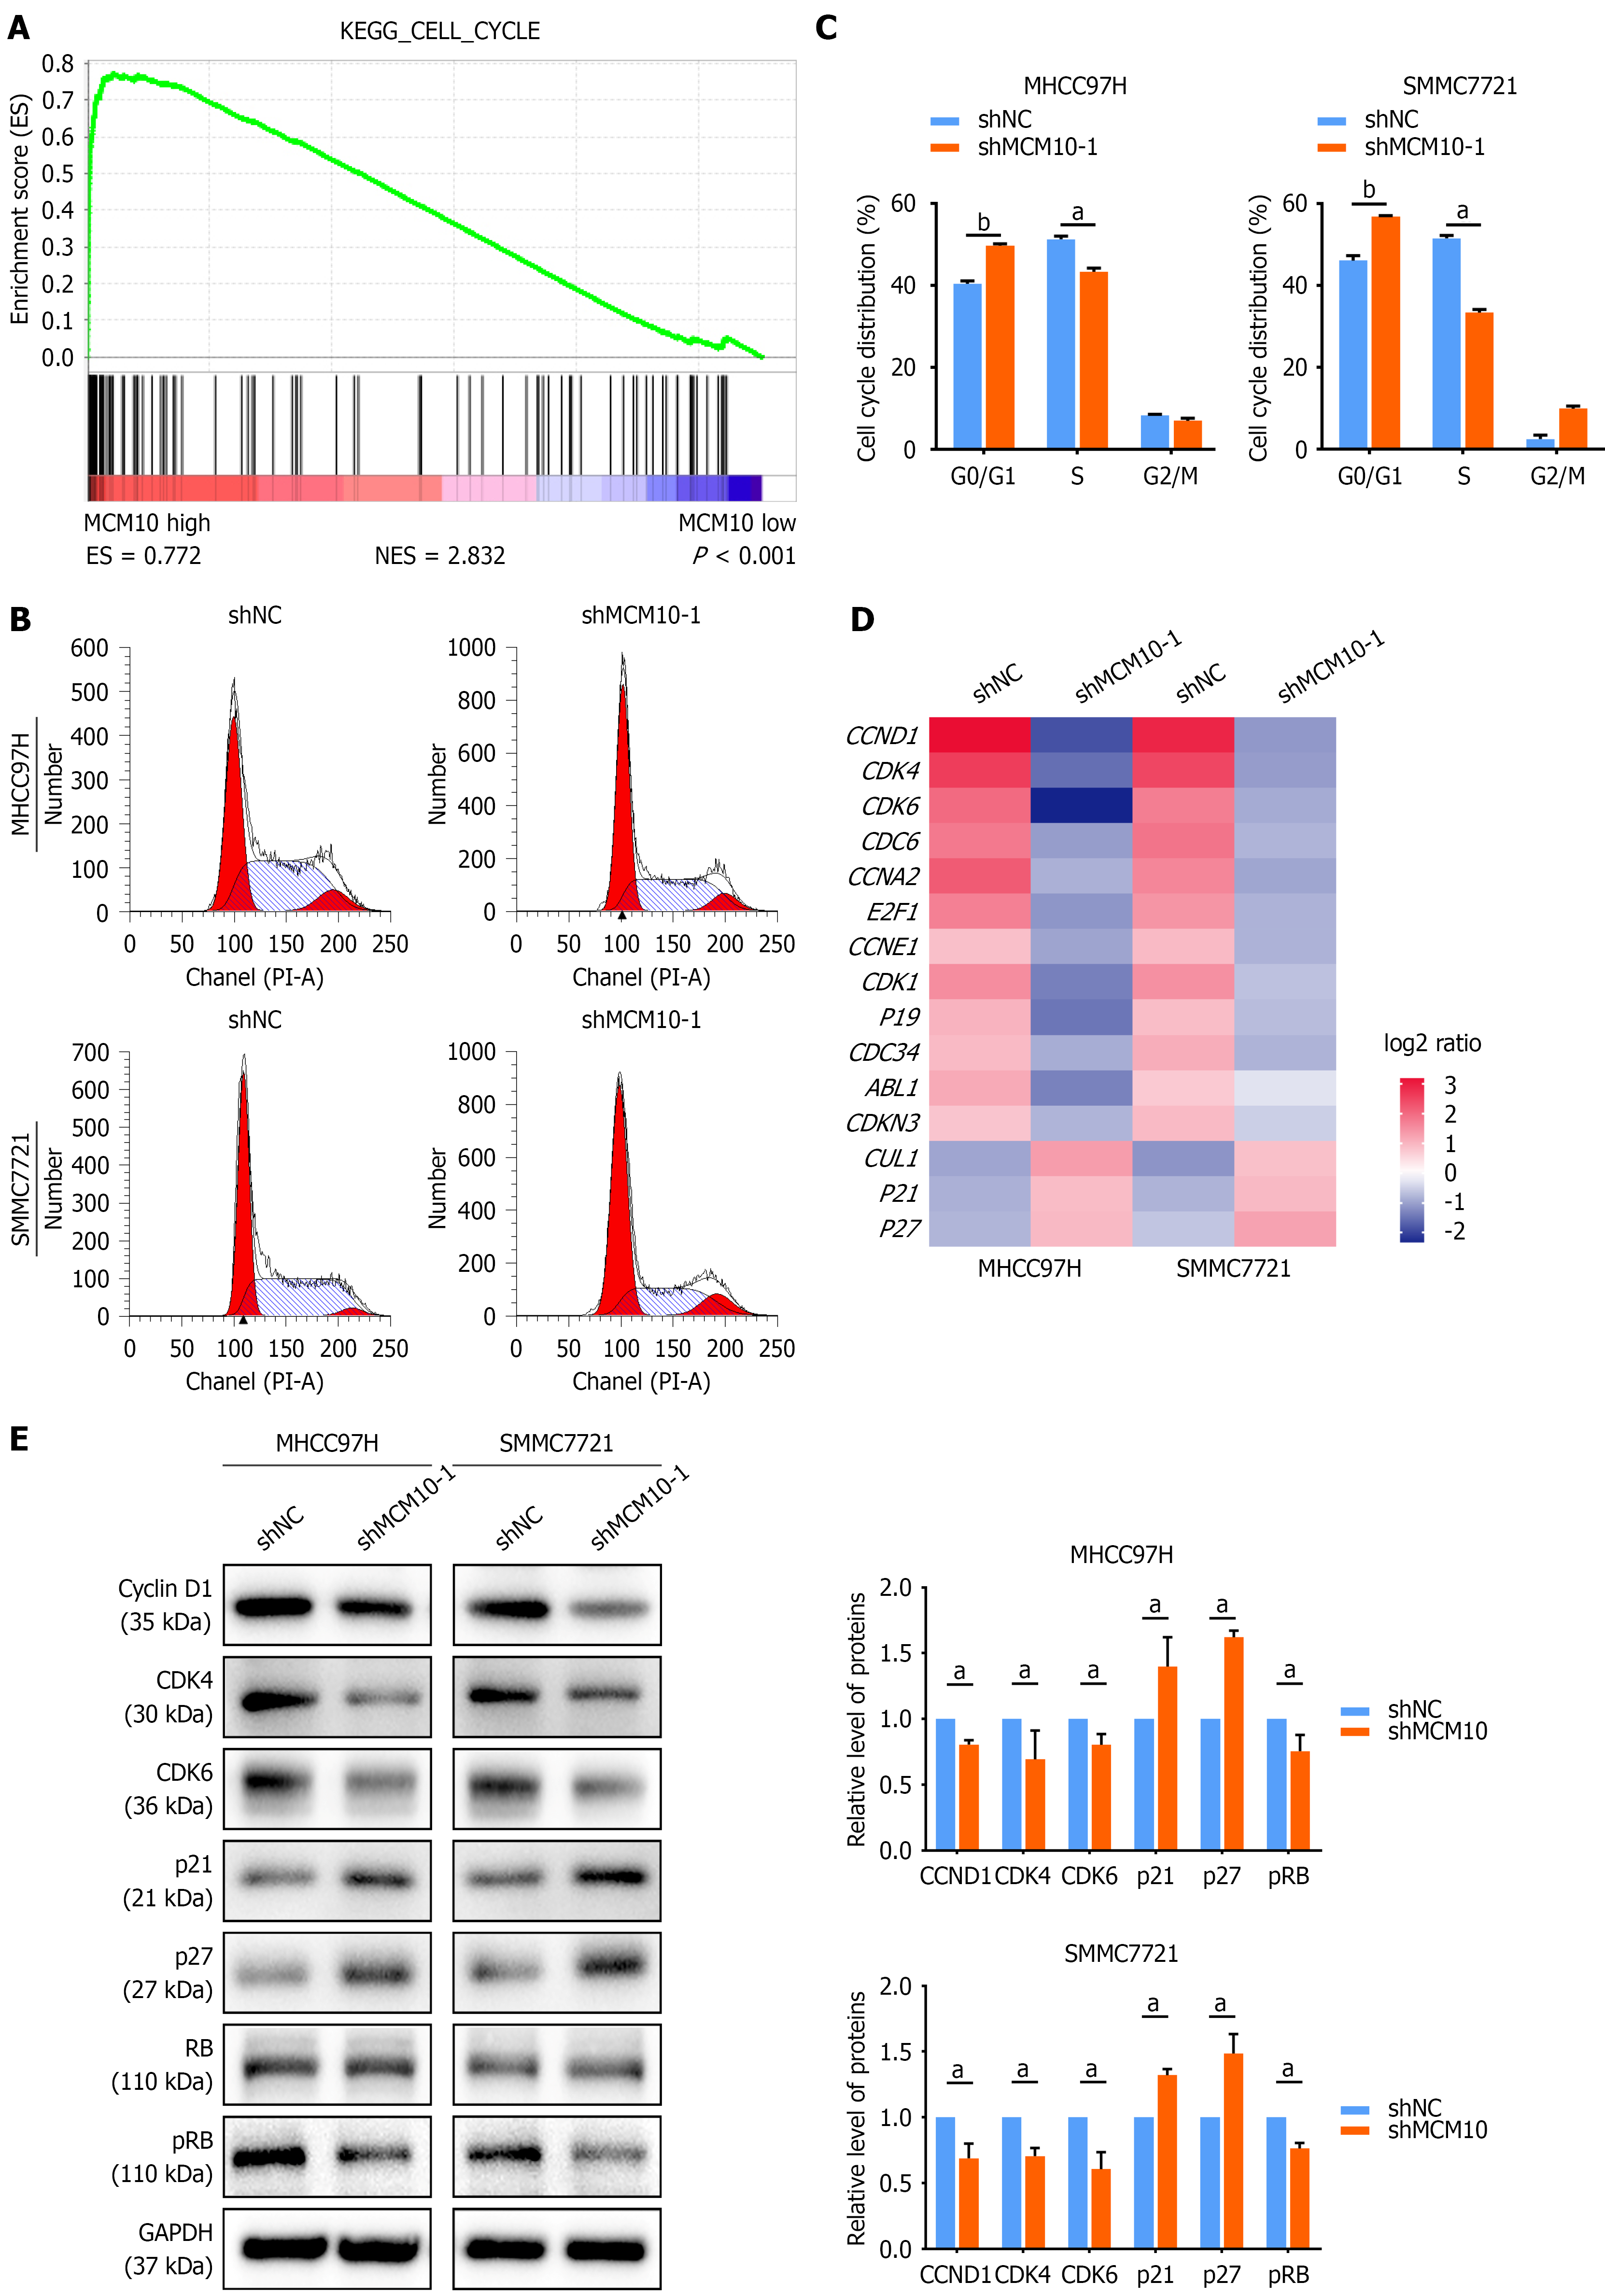
Figure 4 MCM10 knockdown restrains cell cycle progression by suppressing cyclin D1 expression.
A: Gene-set enrichment analysis revealed MCM10 expression significantly and positively correlated with cell cycle-related gene signatures; B and C: Cell cycle analysis of hepatocellular carcinoma (HCC) cells transfected with Lv-shMCM10-1 or Lv-shNC; D: A total of 15 cell cycle-related genes were screened after lentiviral vector transduction; E: Western blot analysis of cyclin D1, CDK4, CDK6, p21, p27, total RB and p-RB in HCC cells after lentiviral vector transduction. Data are represented as mean ± SEM from three independent experiments. aP < 0.05, bP < 0.01.
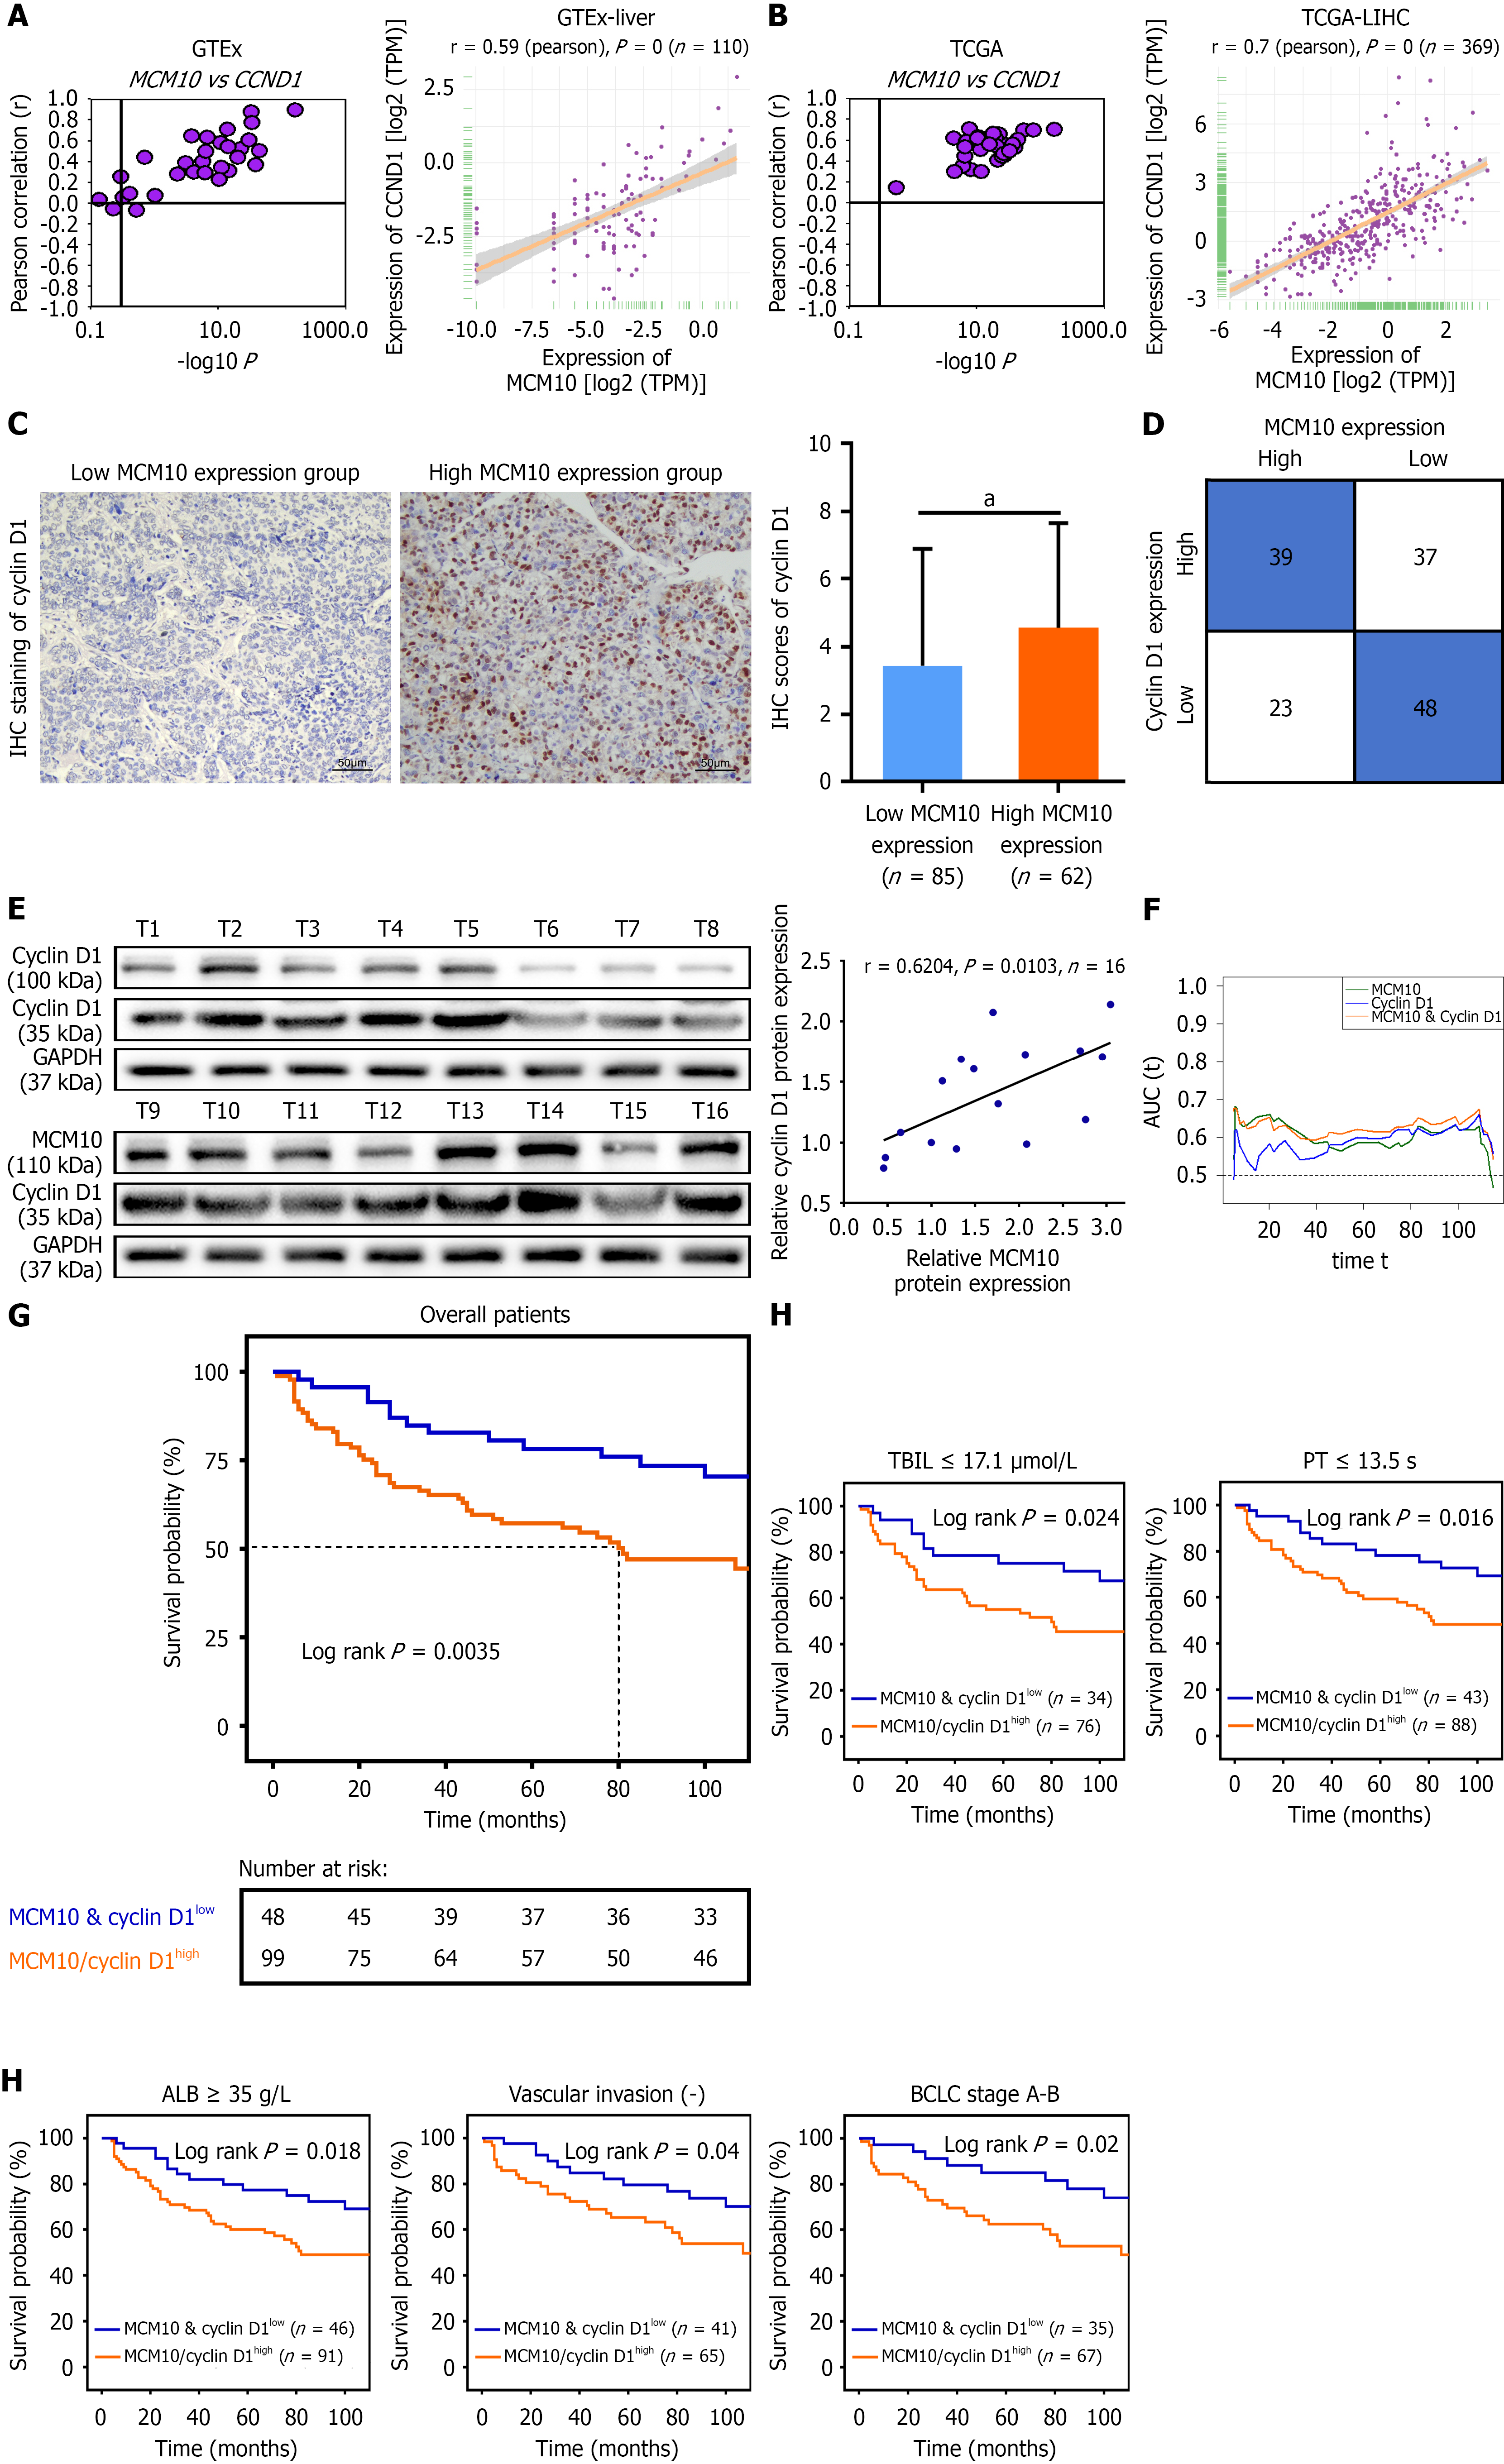
Figure 5 MCM10 upregulated cyclin D1 expression in hepatocellular carcinoma.
A and B: Correlation of MCM10 with cyclin D1 expression in normal tissues and cancer samples based on the data from Genotype Tissue Expression and The Cancer Genome Atlas; C: Representative immunohistochemistry staining of MCM10 and Cyclin D1 in hepatocellular carcinoma (HCC) tissues. Scale bar: 25 μm. n = 147; D: Cyclin D1 expression levels were compared between MCM10 low expression group and MCM10 high expression group; E: Western blot analysis of MCM10 and cyclin D1 expression in 16 freshly collected HCC samples (left). The correlation of MCM10 and cyclin D1 expression is shown on the right; F: Time-dependent receiver operating characteristic curves for either MCM10 or cyclin D1 alone or in combination in predicting overall survival of HCC patients; G and H: Prognostic value of combination of MCM10 and cyclin D1 in overall HCC patients and different subgroups. aP < 0.05. TCGA: The Cancer Genome Atlas; GTEx: Genotype Tissue Expression; IHC: Immunohistochemistry; BCLC: Barcelona Clinic Liver Cancer; TBil: Total bilirubin; PT: Prothrombin time; ALB: Albumin.
- Citation: Chen YR, Wang G, He LJ, Ye HW, Wang LF, Zou DD, Wang MQ, Xie HW, Zhu SL, Wang XY. MCM10 promotes hepatocellular carcinoma progression through cyclin D1 regulation. World J Gastrointest Oncol 2026; 18(8): 119834
- URL: https://www.wjgnet.com/1948-5204/full/v18/i8/119834.htm
- DOI: https://dx.doi.org/10.4251/wjgo.119834