
















Copyright: ©Author(s) 2026.
World J Gastrointest Oncol. Oct 15, 2026; 18(10): 122464
Published online Oct 15, 2026. doi: 10.4251/wjgo.122464
Published online Oct 15, 2026. doi: 10.4251/wjgo.122464
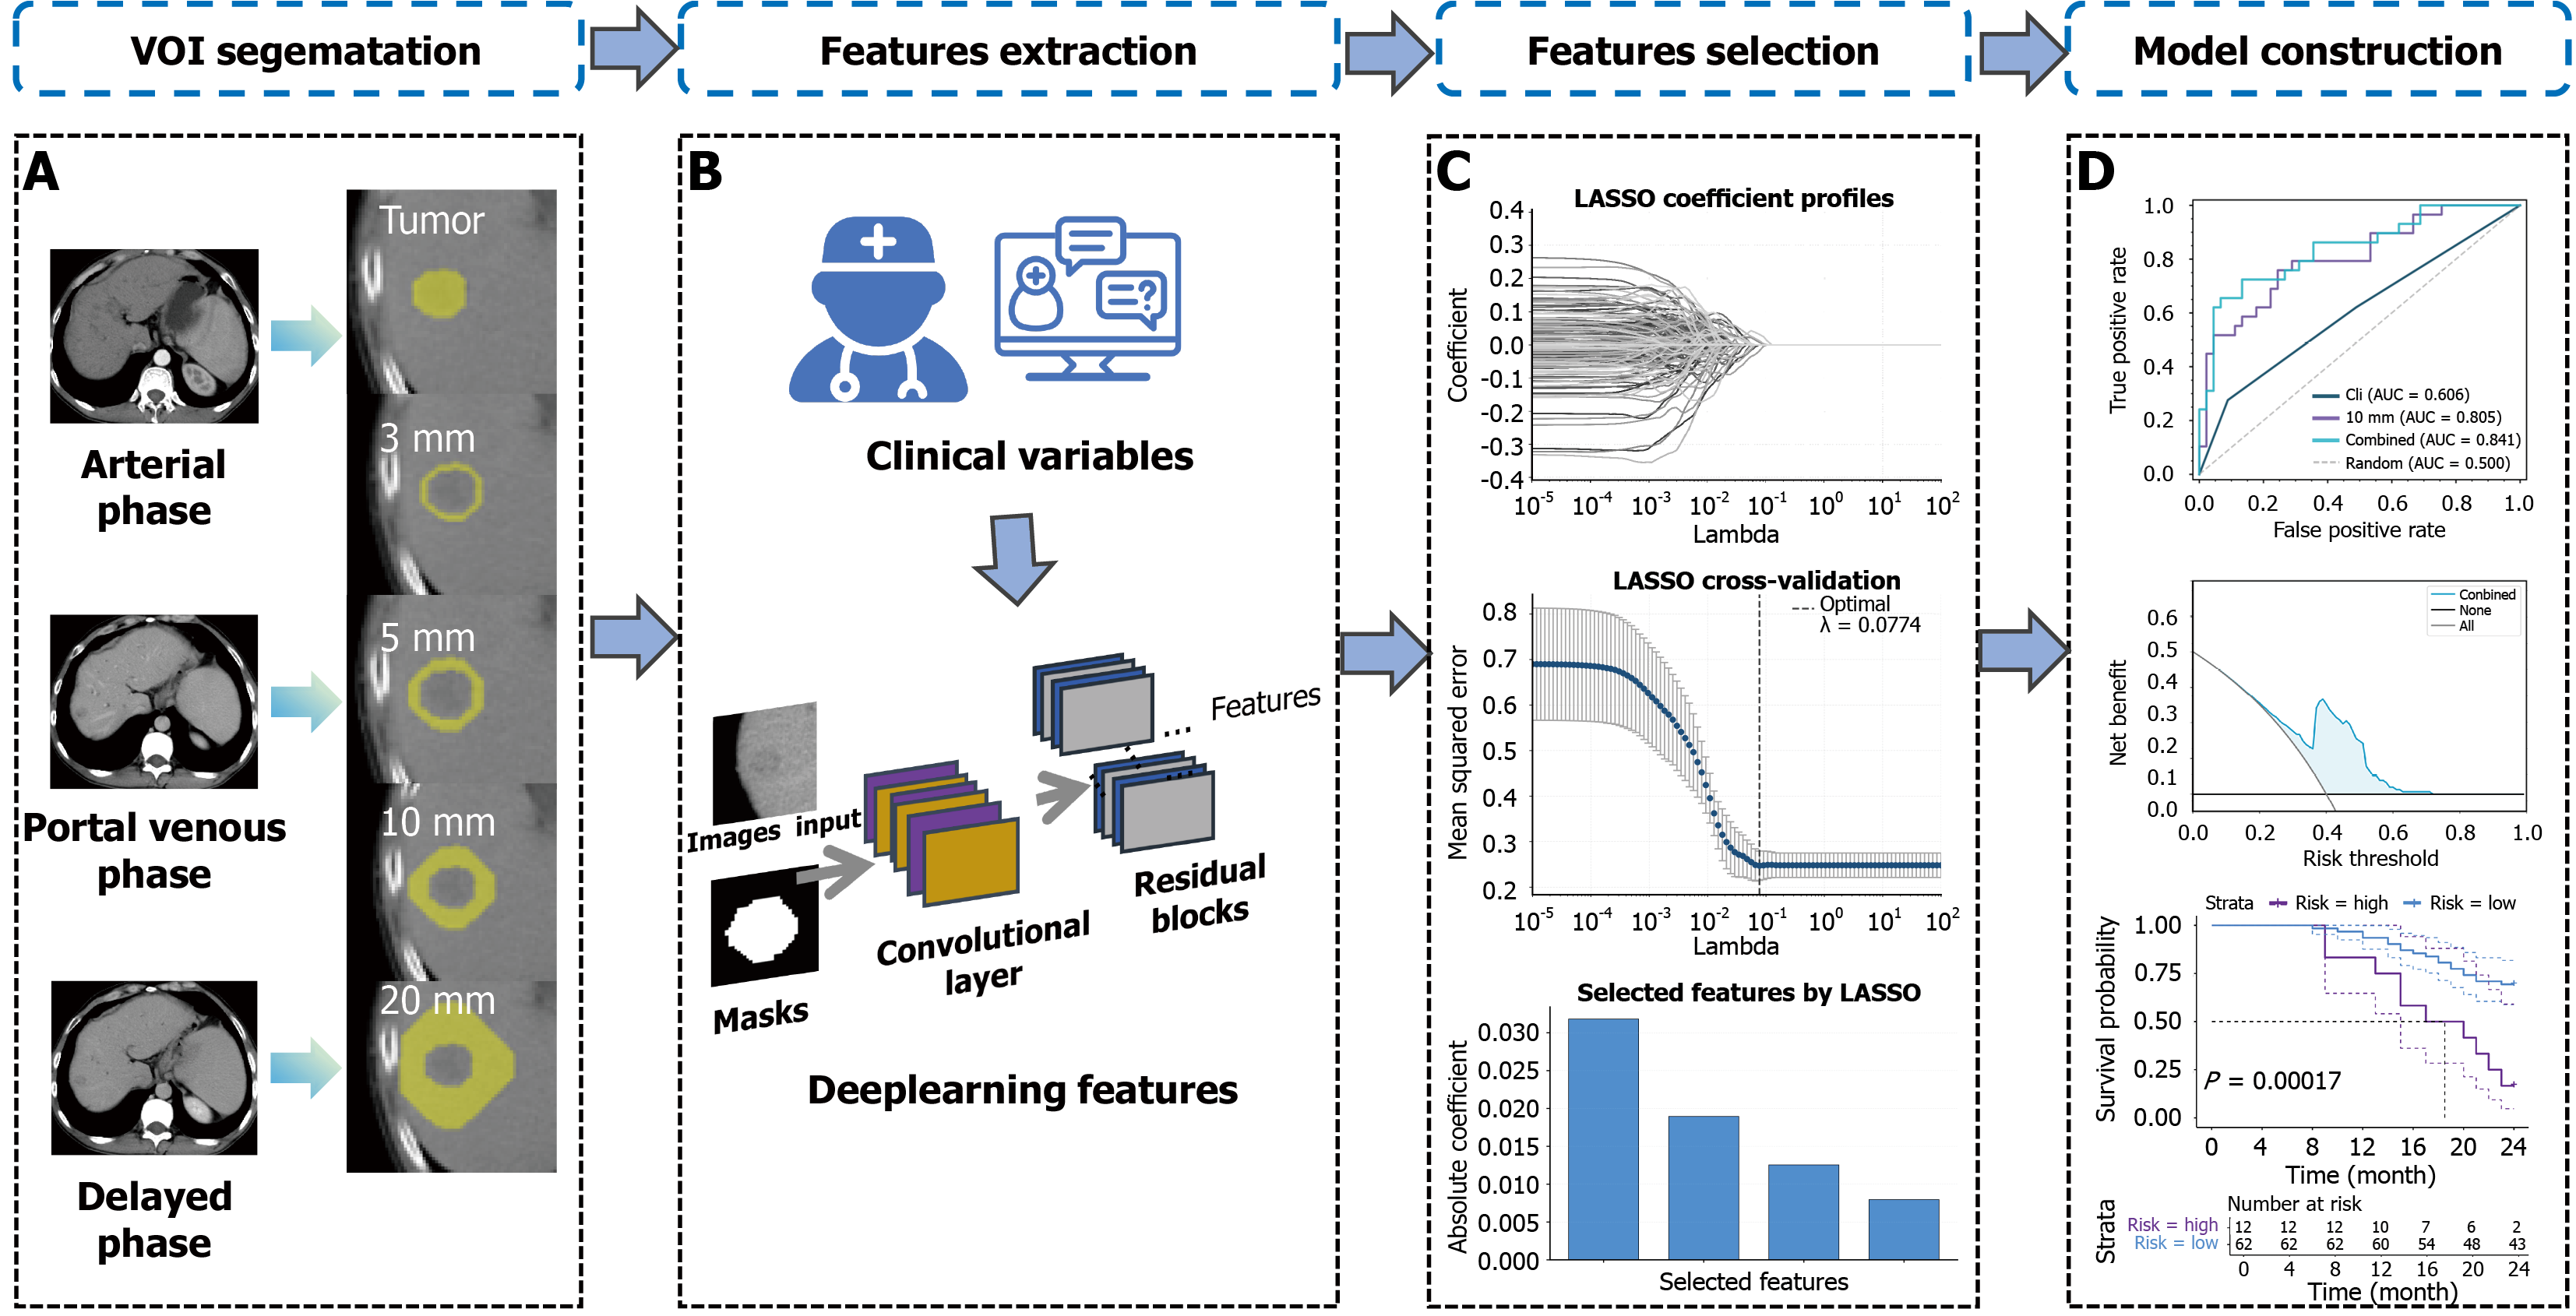
Figure 1 Research flowchart.
A: Volume of interest segematation; B: Features extraction; C: Features selection; D: Model construction. LASSO: Least absolute shrinkage and selection operator; AUC: Area under the curve; VOI: Volume of interest.
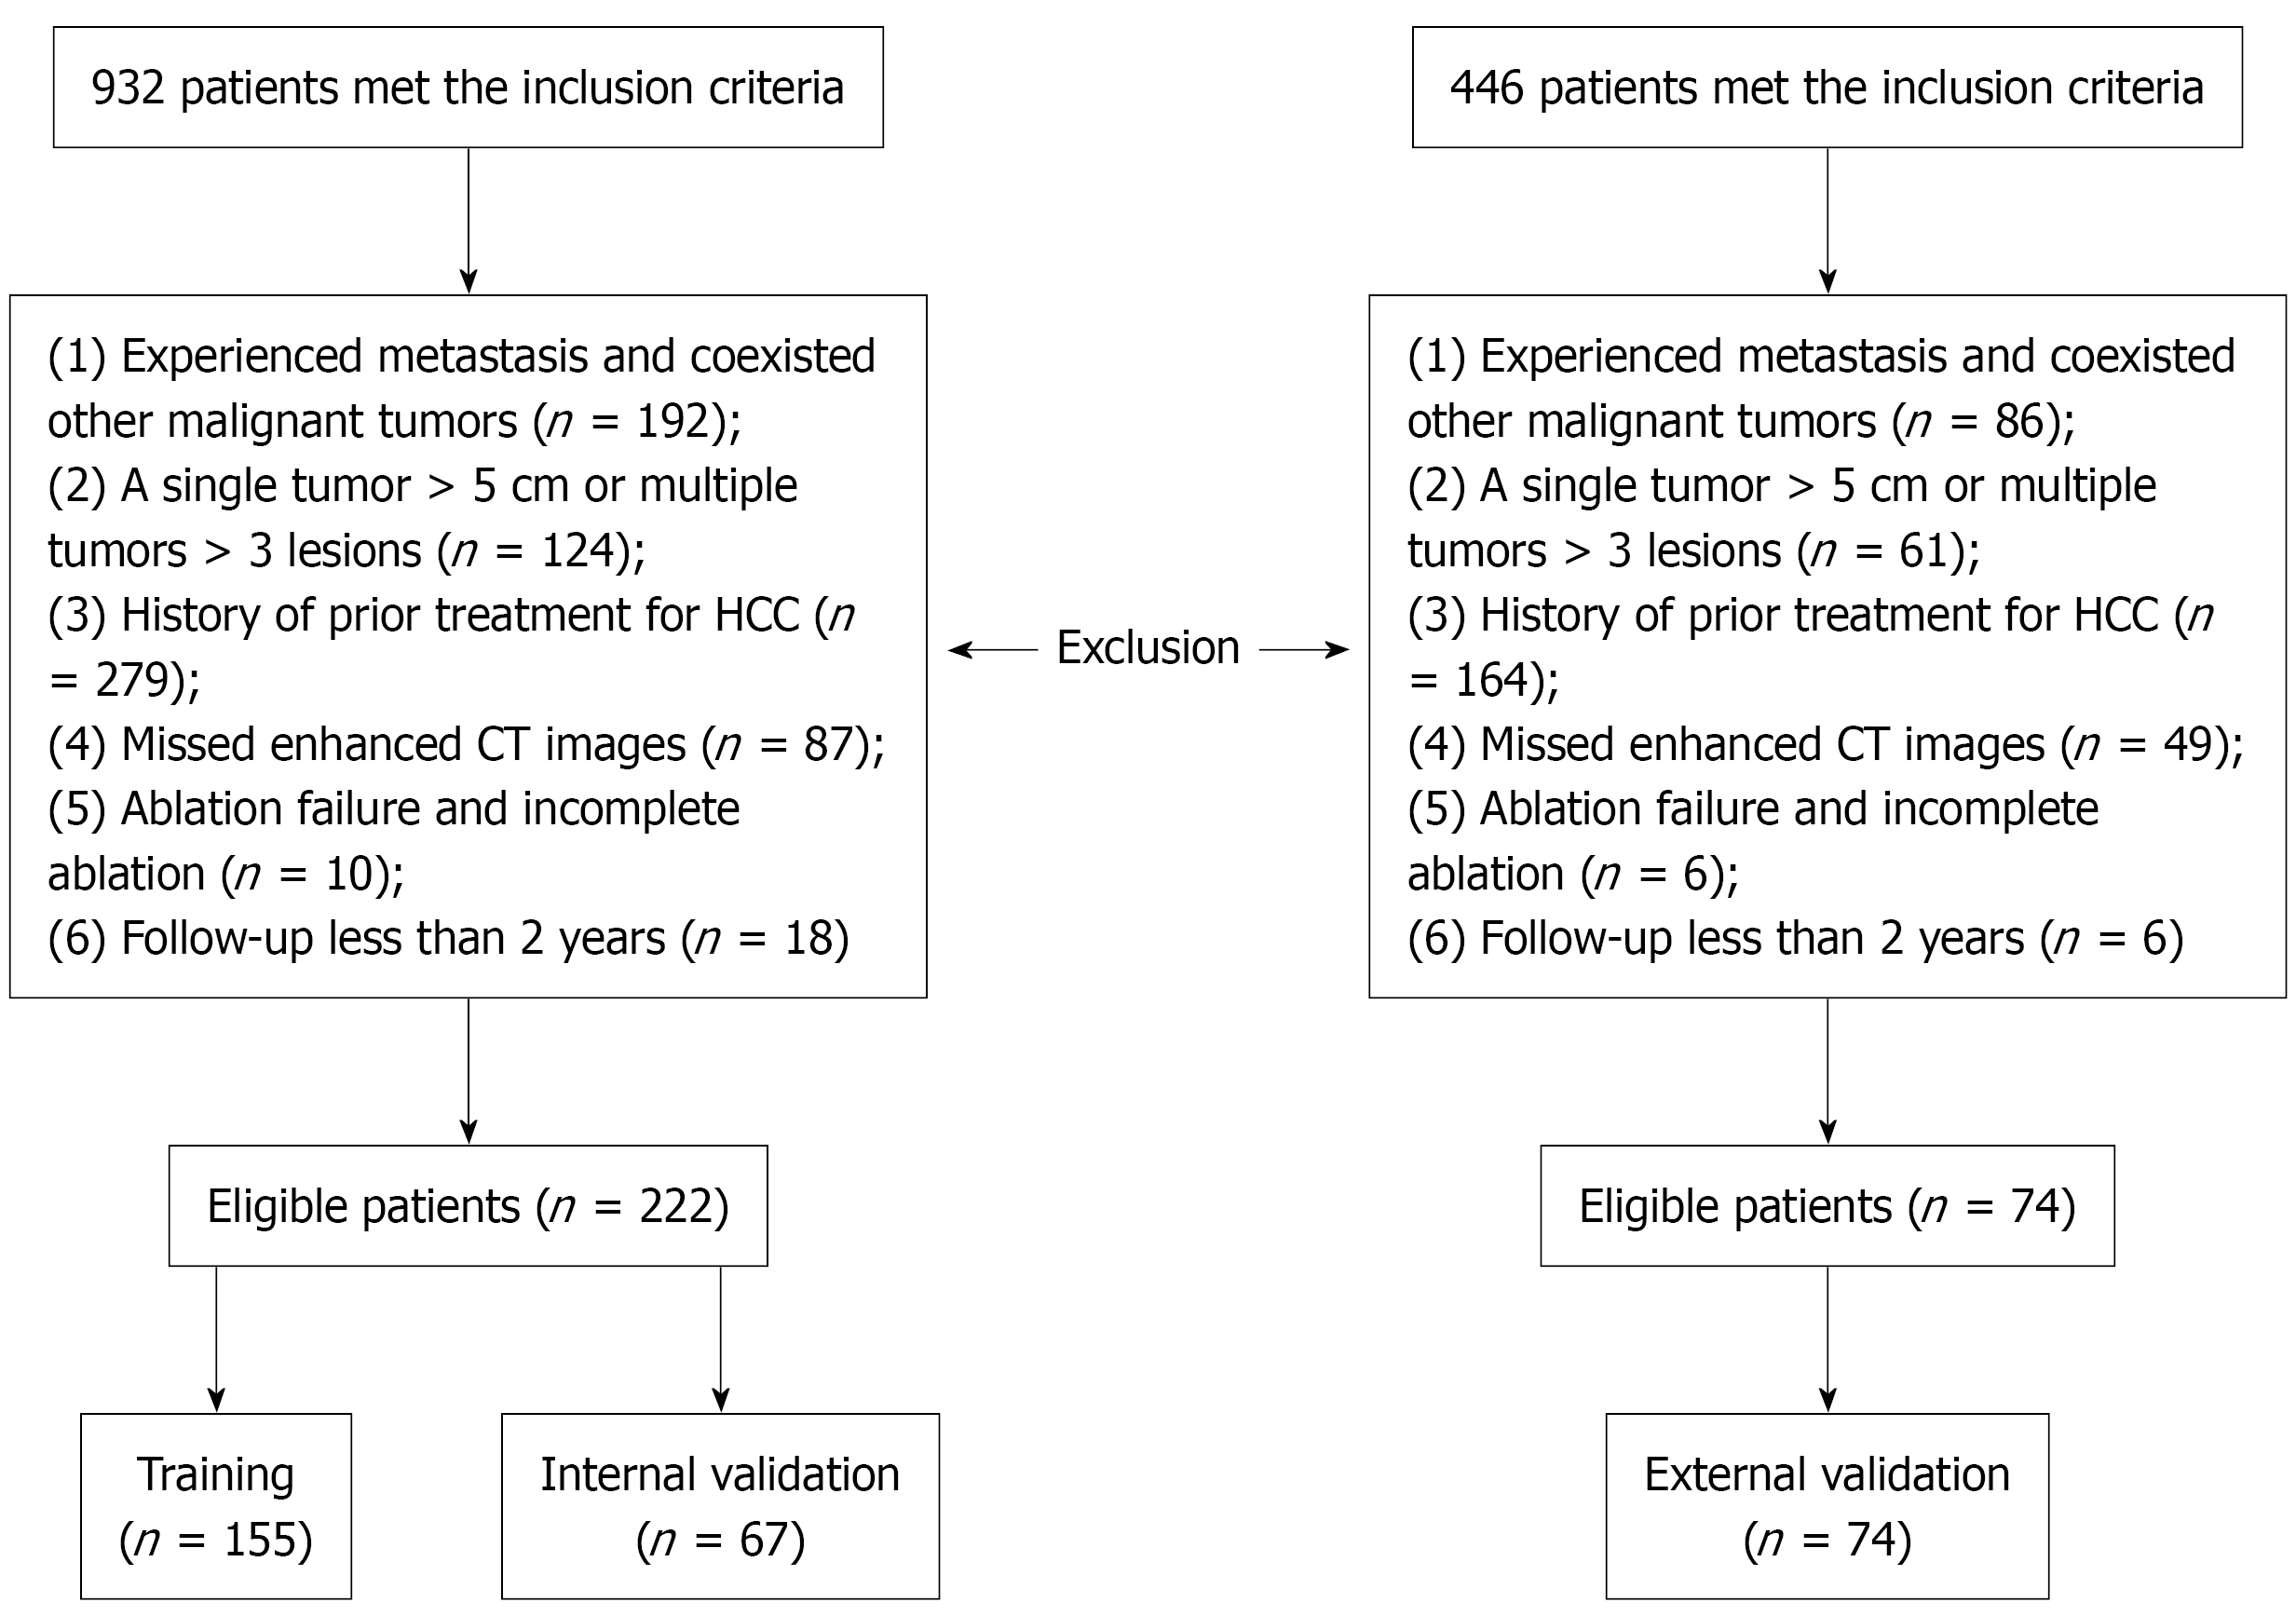
Figure 2 Inclusion and exclusion flowchart.
HCC: Hepatocellular carcinoma; CT: Computed tomography.
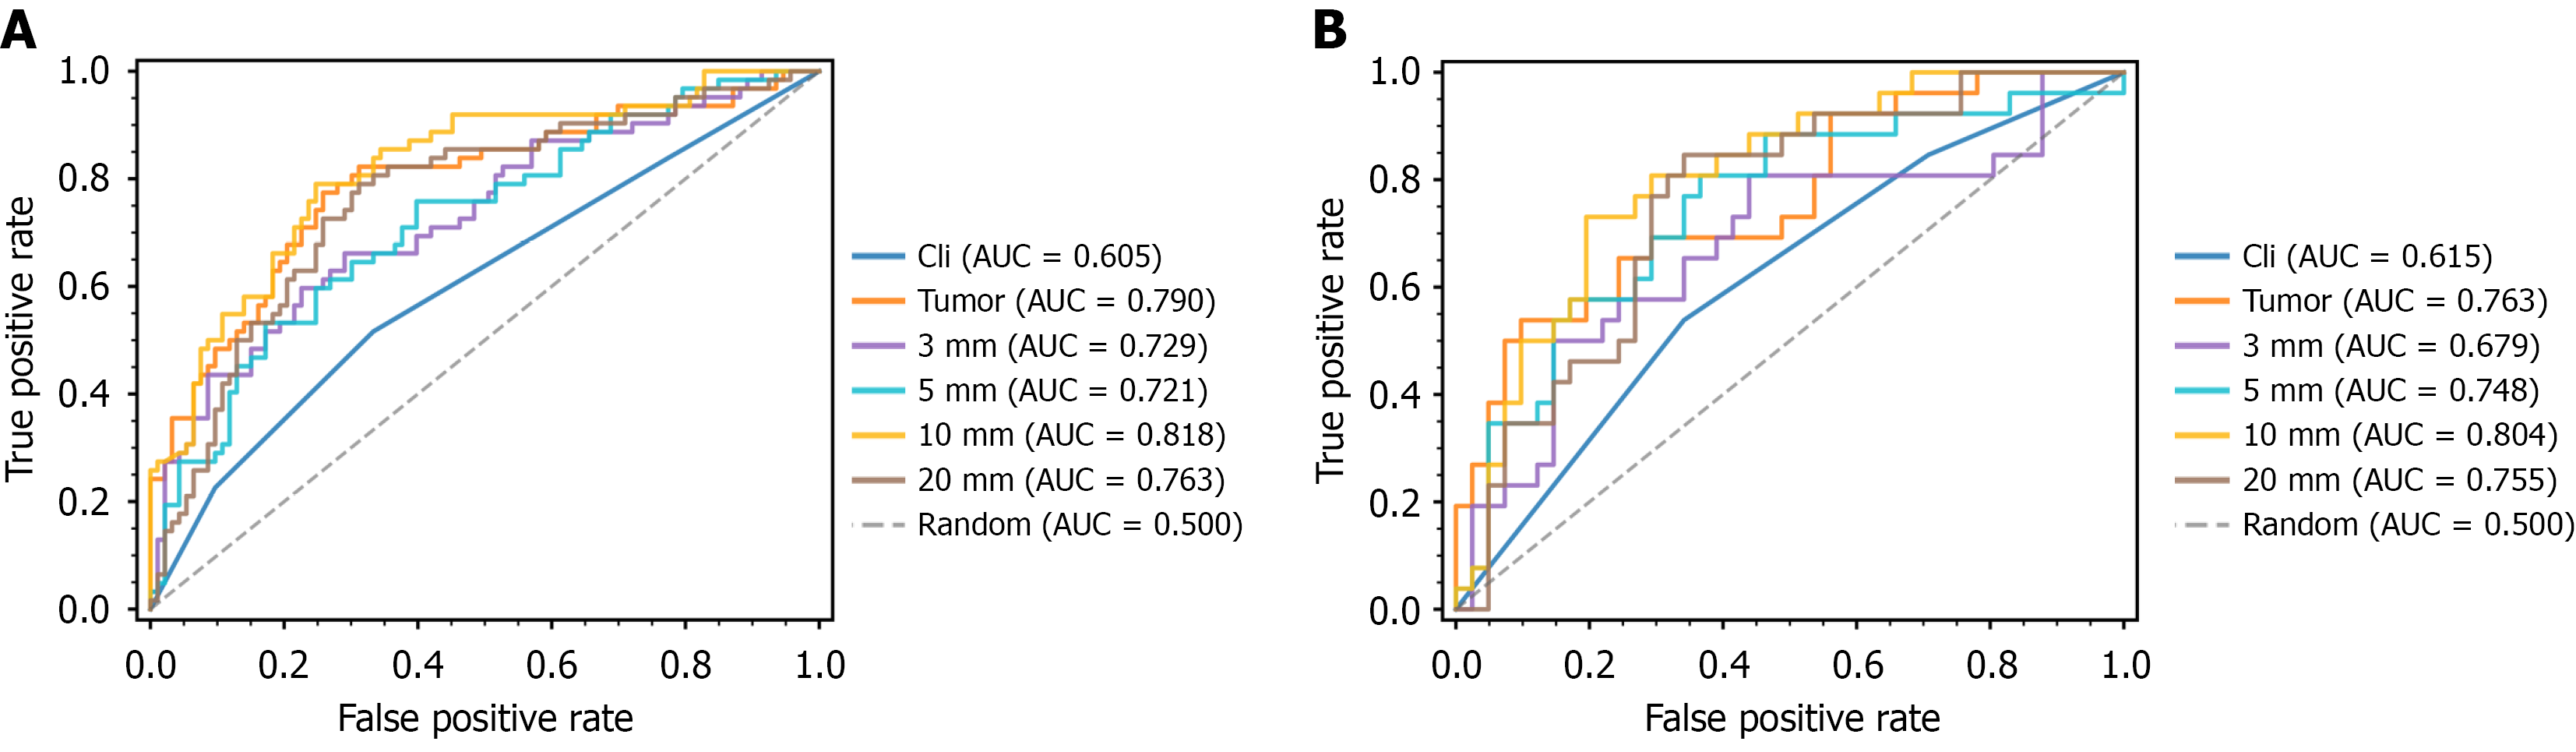
Figure 3 Receiver operating characteristic curves of each peritumoral model.
A: Receiver operating characteristic curves of each peritumoral model in the training set; B: Receiver operating characteristic curves of each peritumoral model in the internal validation set. AUC: Area under the curve.
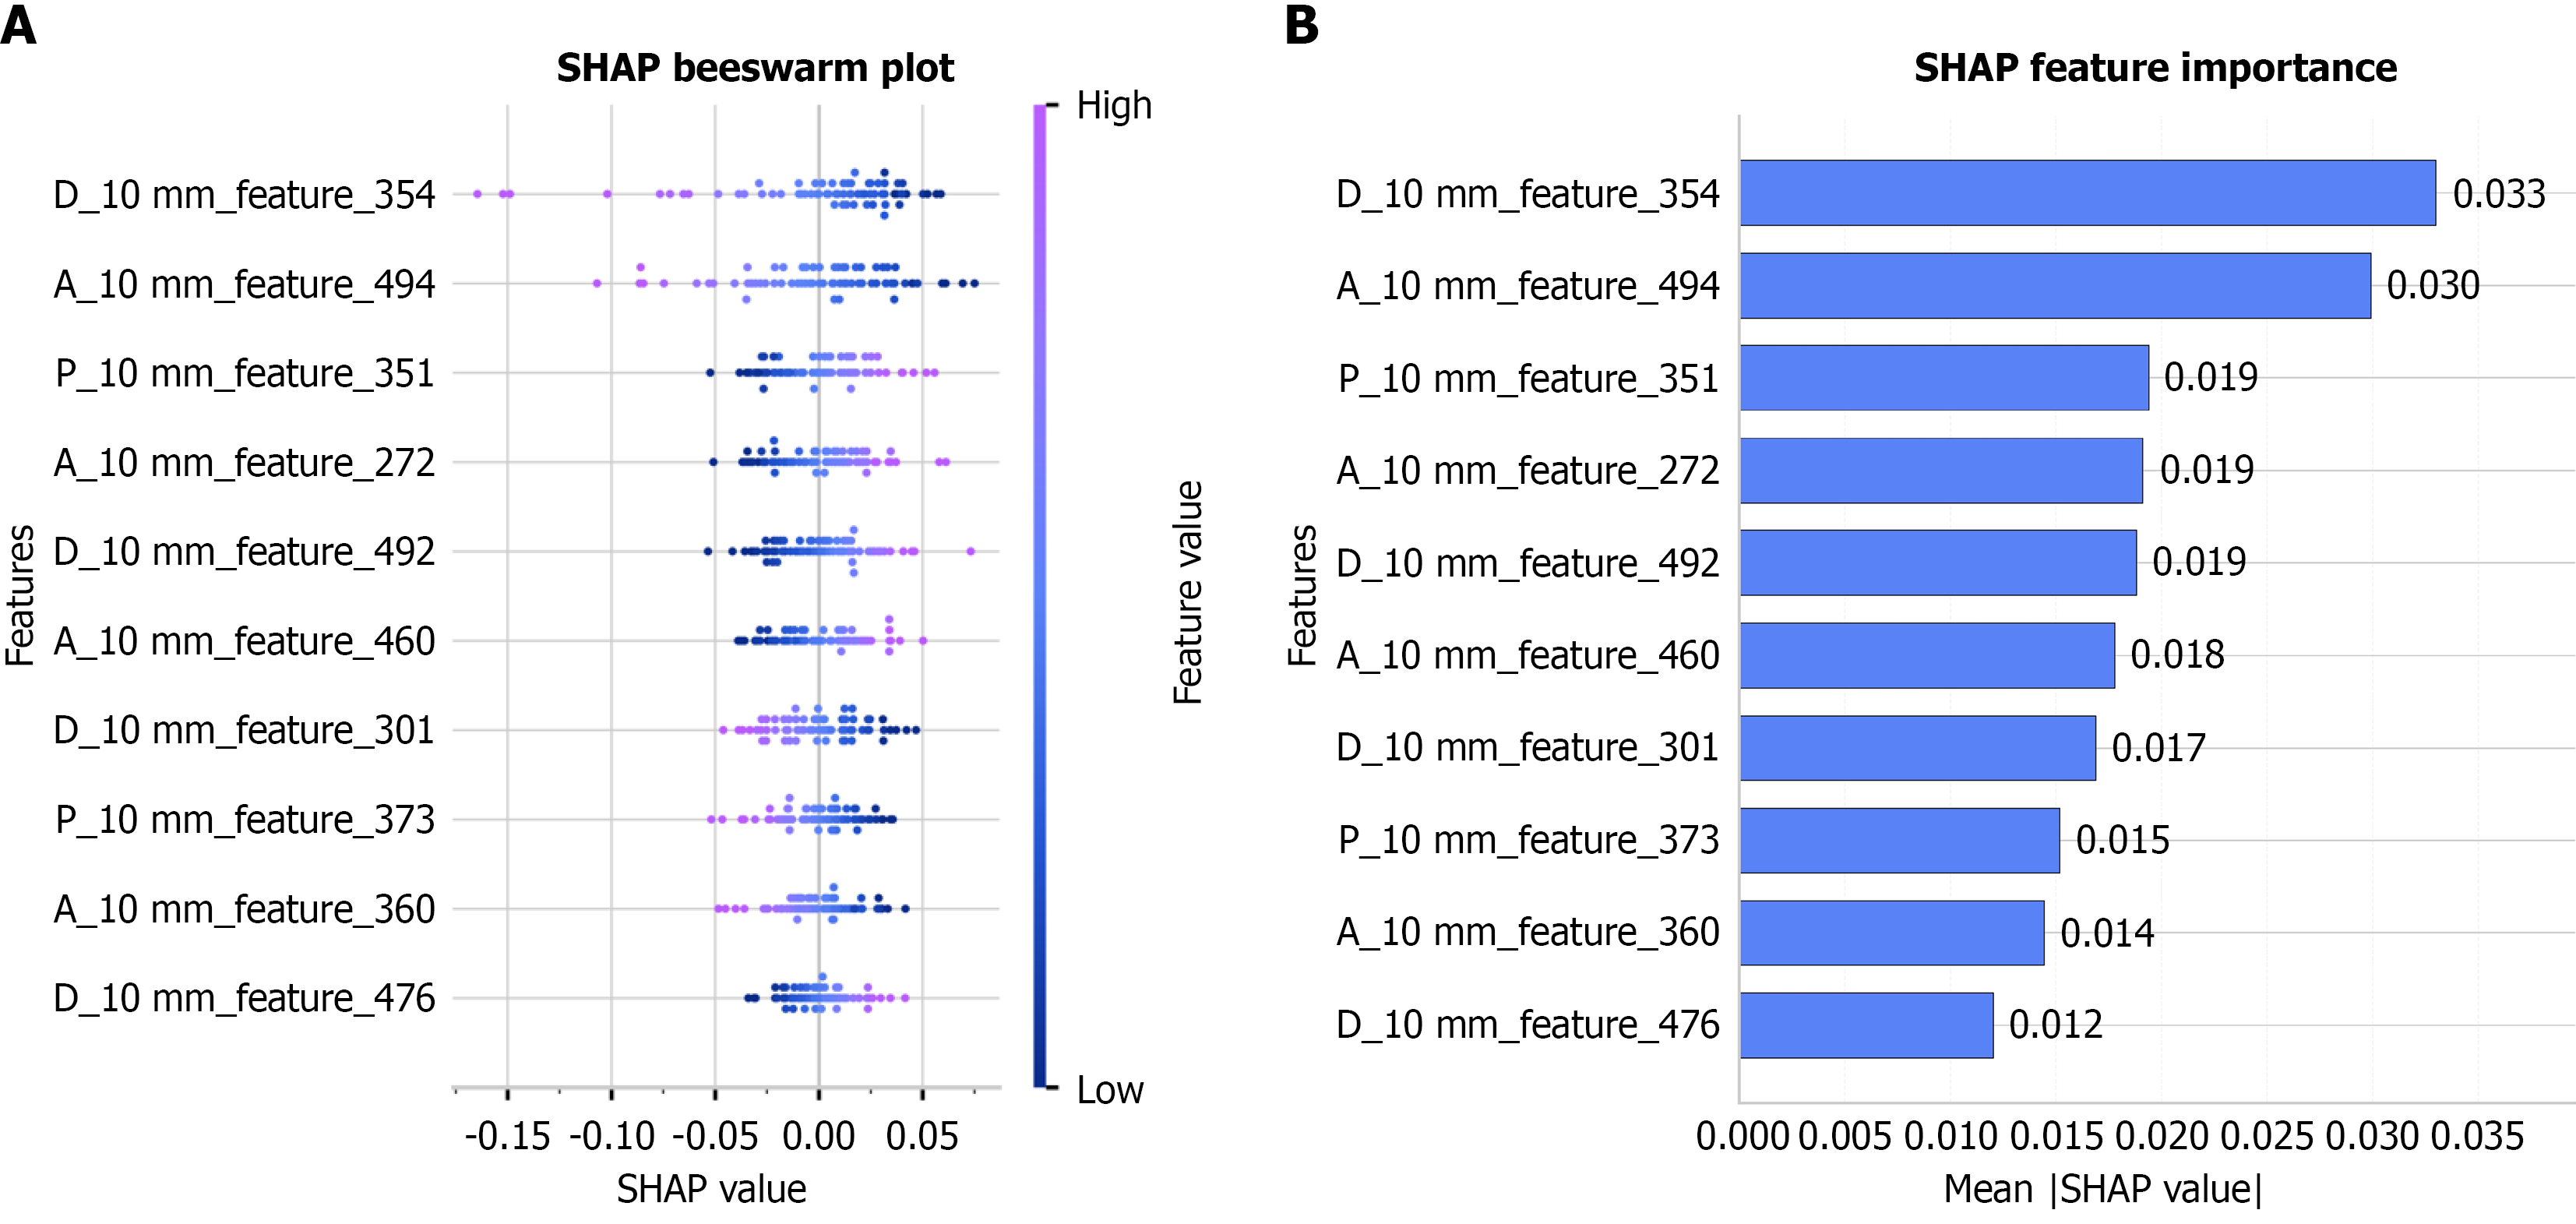
Figure 4 Feature importance of the 10-mm peritumoral model.
A: Shapley additive explanations bee swarm plot; B: Shapley additive explanations bar plot. SHAP: Shapley additive explanations; A: Arterial; P: Portal-venous; D: Delayed.
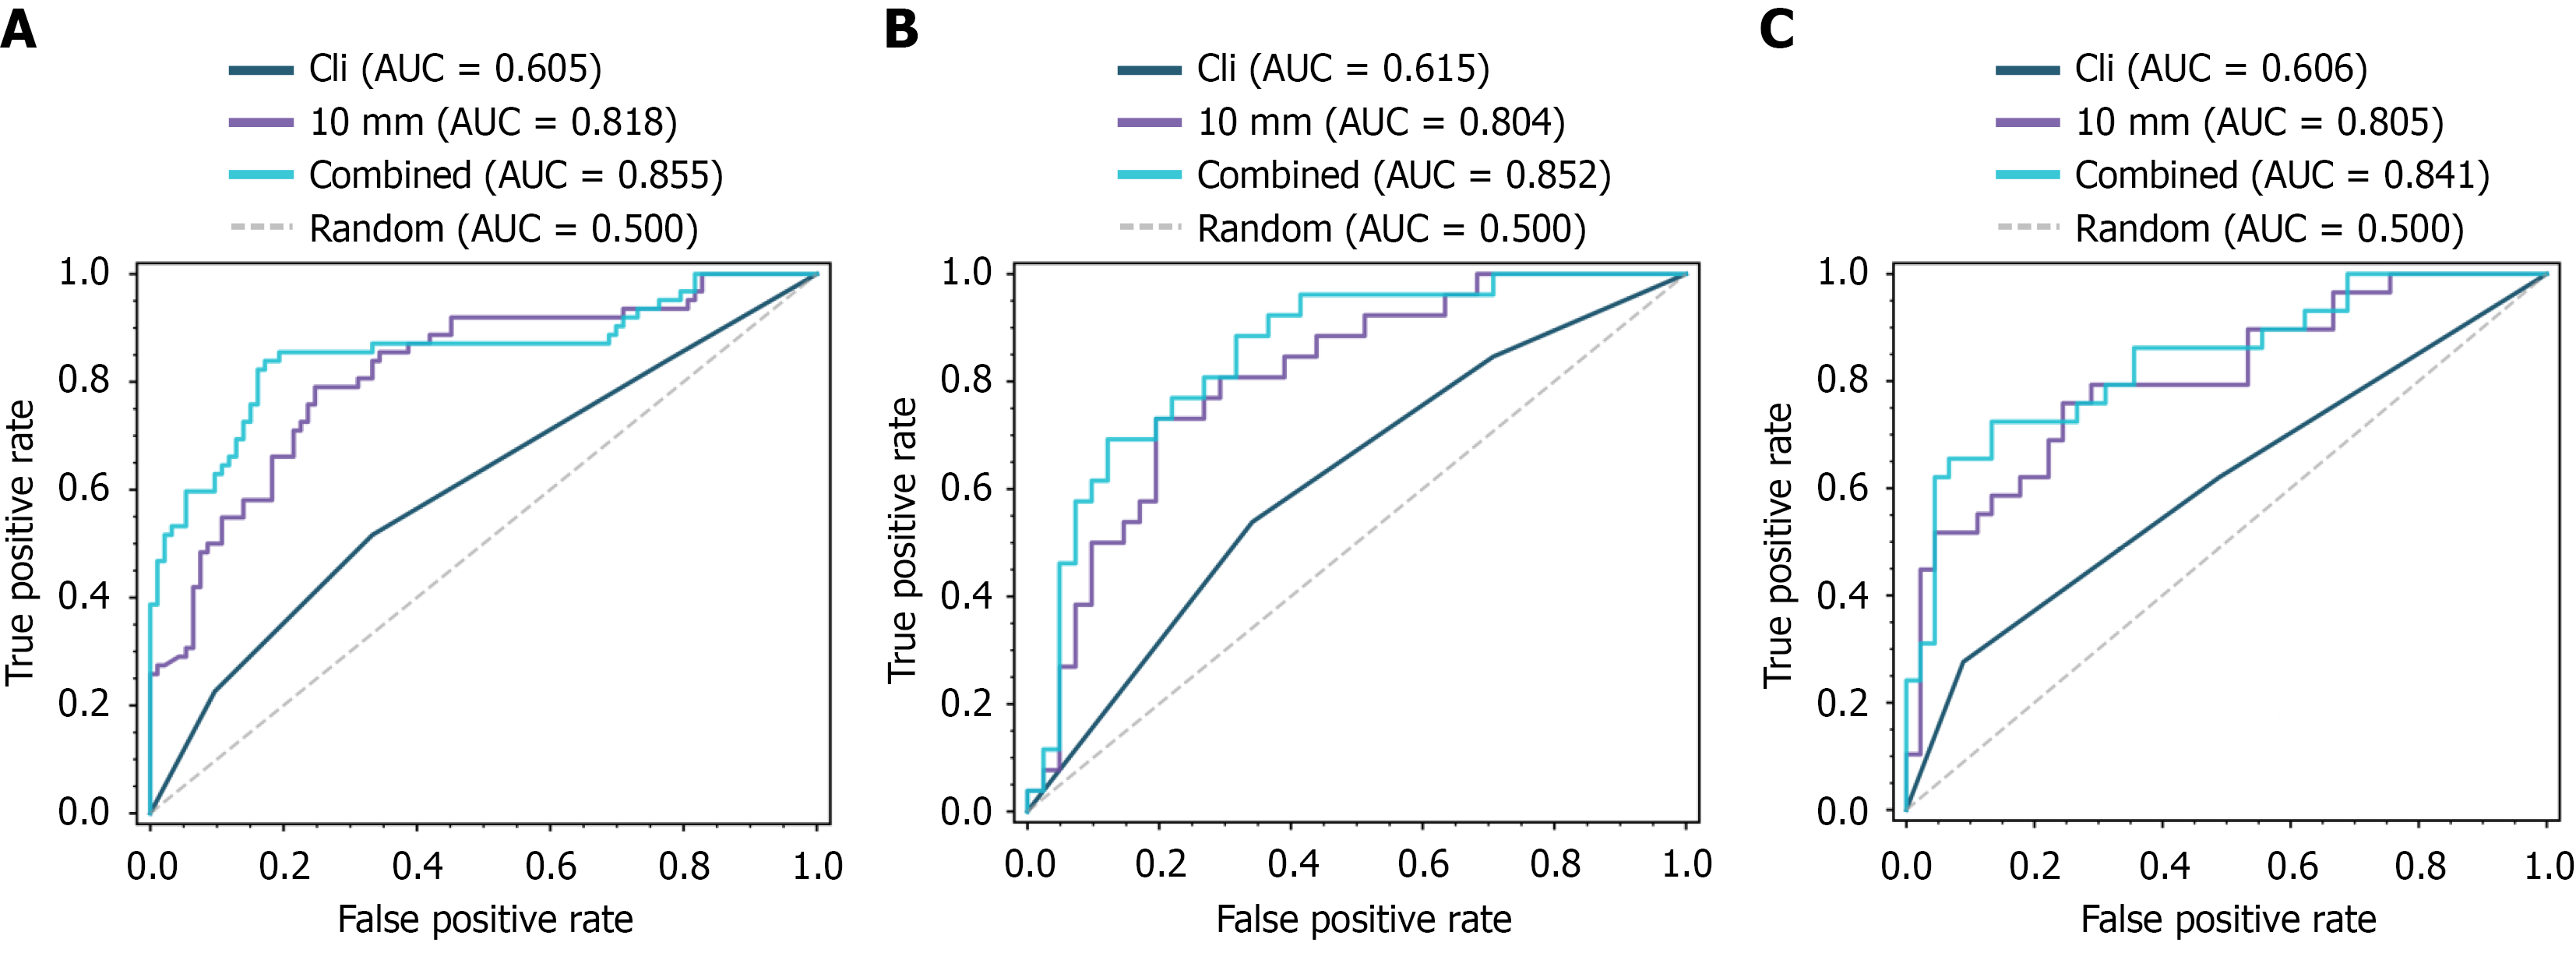
Figure 5 Receiver operating characteristic curves of each model.
A: Comparison of the combined model, clinical imaging model, and 10-mm peritumoral model in the training set; B: Comparison of the combined model, clinical imaging model, and 10-mm peritumoral model in the internal validation set; C: Comparison of the combined model, clinical imaging model, and 10-mm peritumoral model in the external validation set. AUC: Area under the curve.
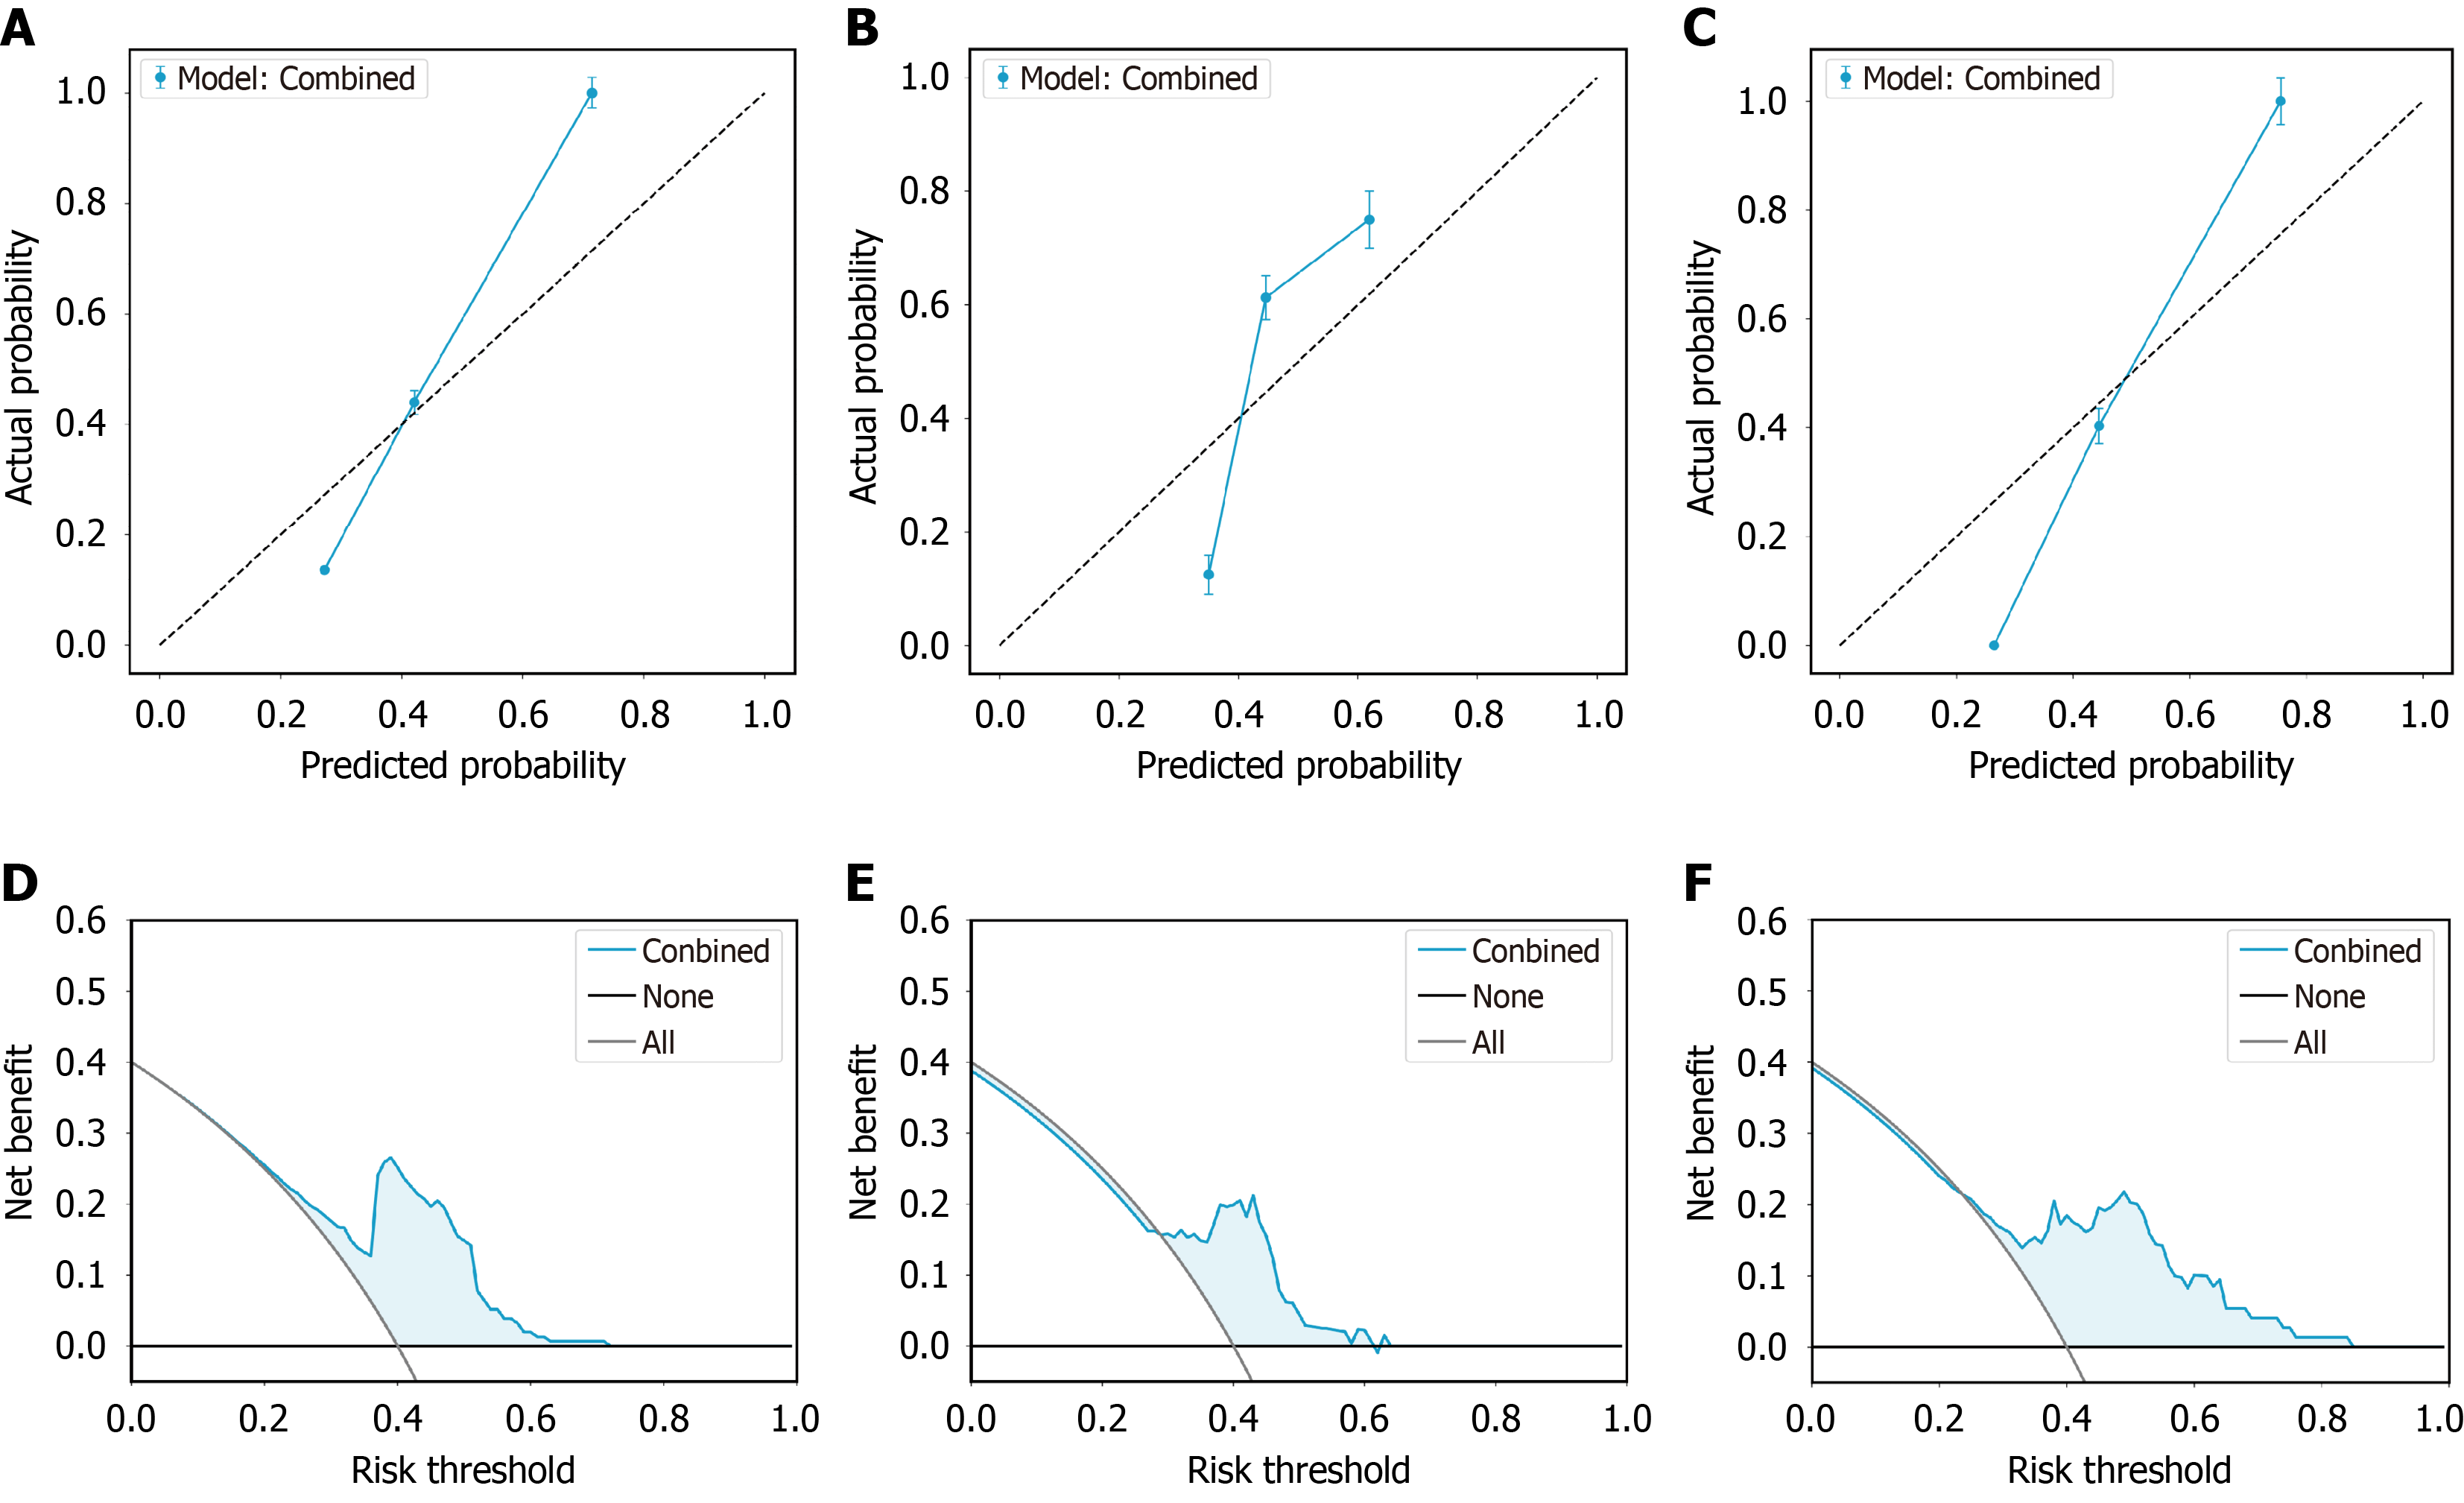
Figure 6 Calibration curves and decision curve analysis of the combined model.
A: Calibration curve of the combined model in the training set; B: Calibration curve of the combined model in the internal validation set; C: Calibration curve of the combined model in the external validation set; D: Decision curve analysis (DCA) curve of the combined model in the training set; E: DCA curve of the combined model in the internal validation set; F: DCA curve of the combined model in the external validation set.
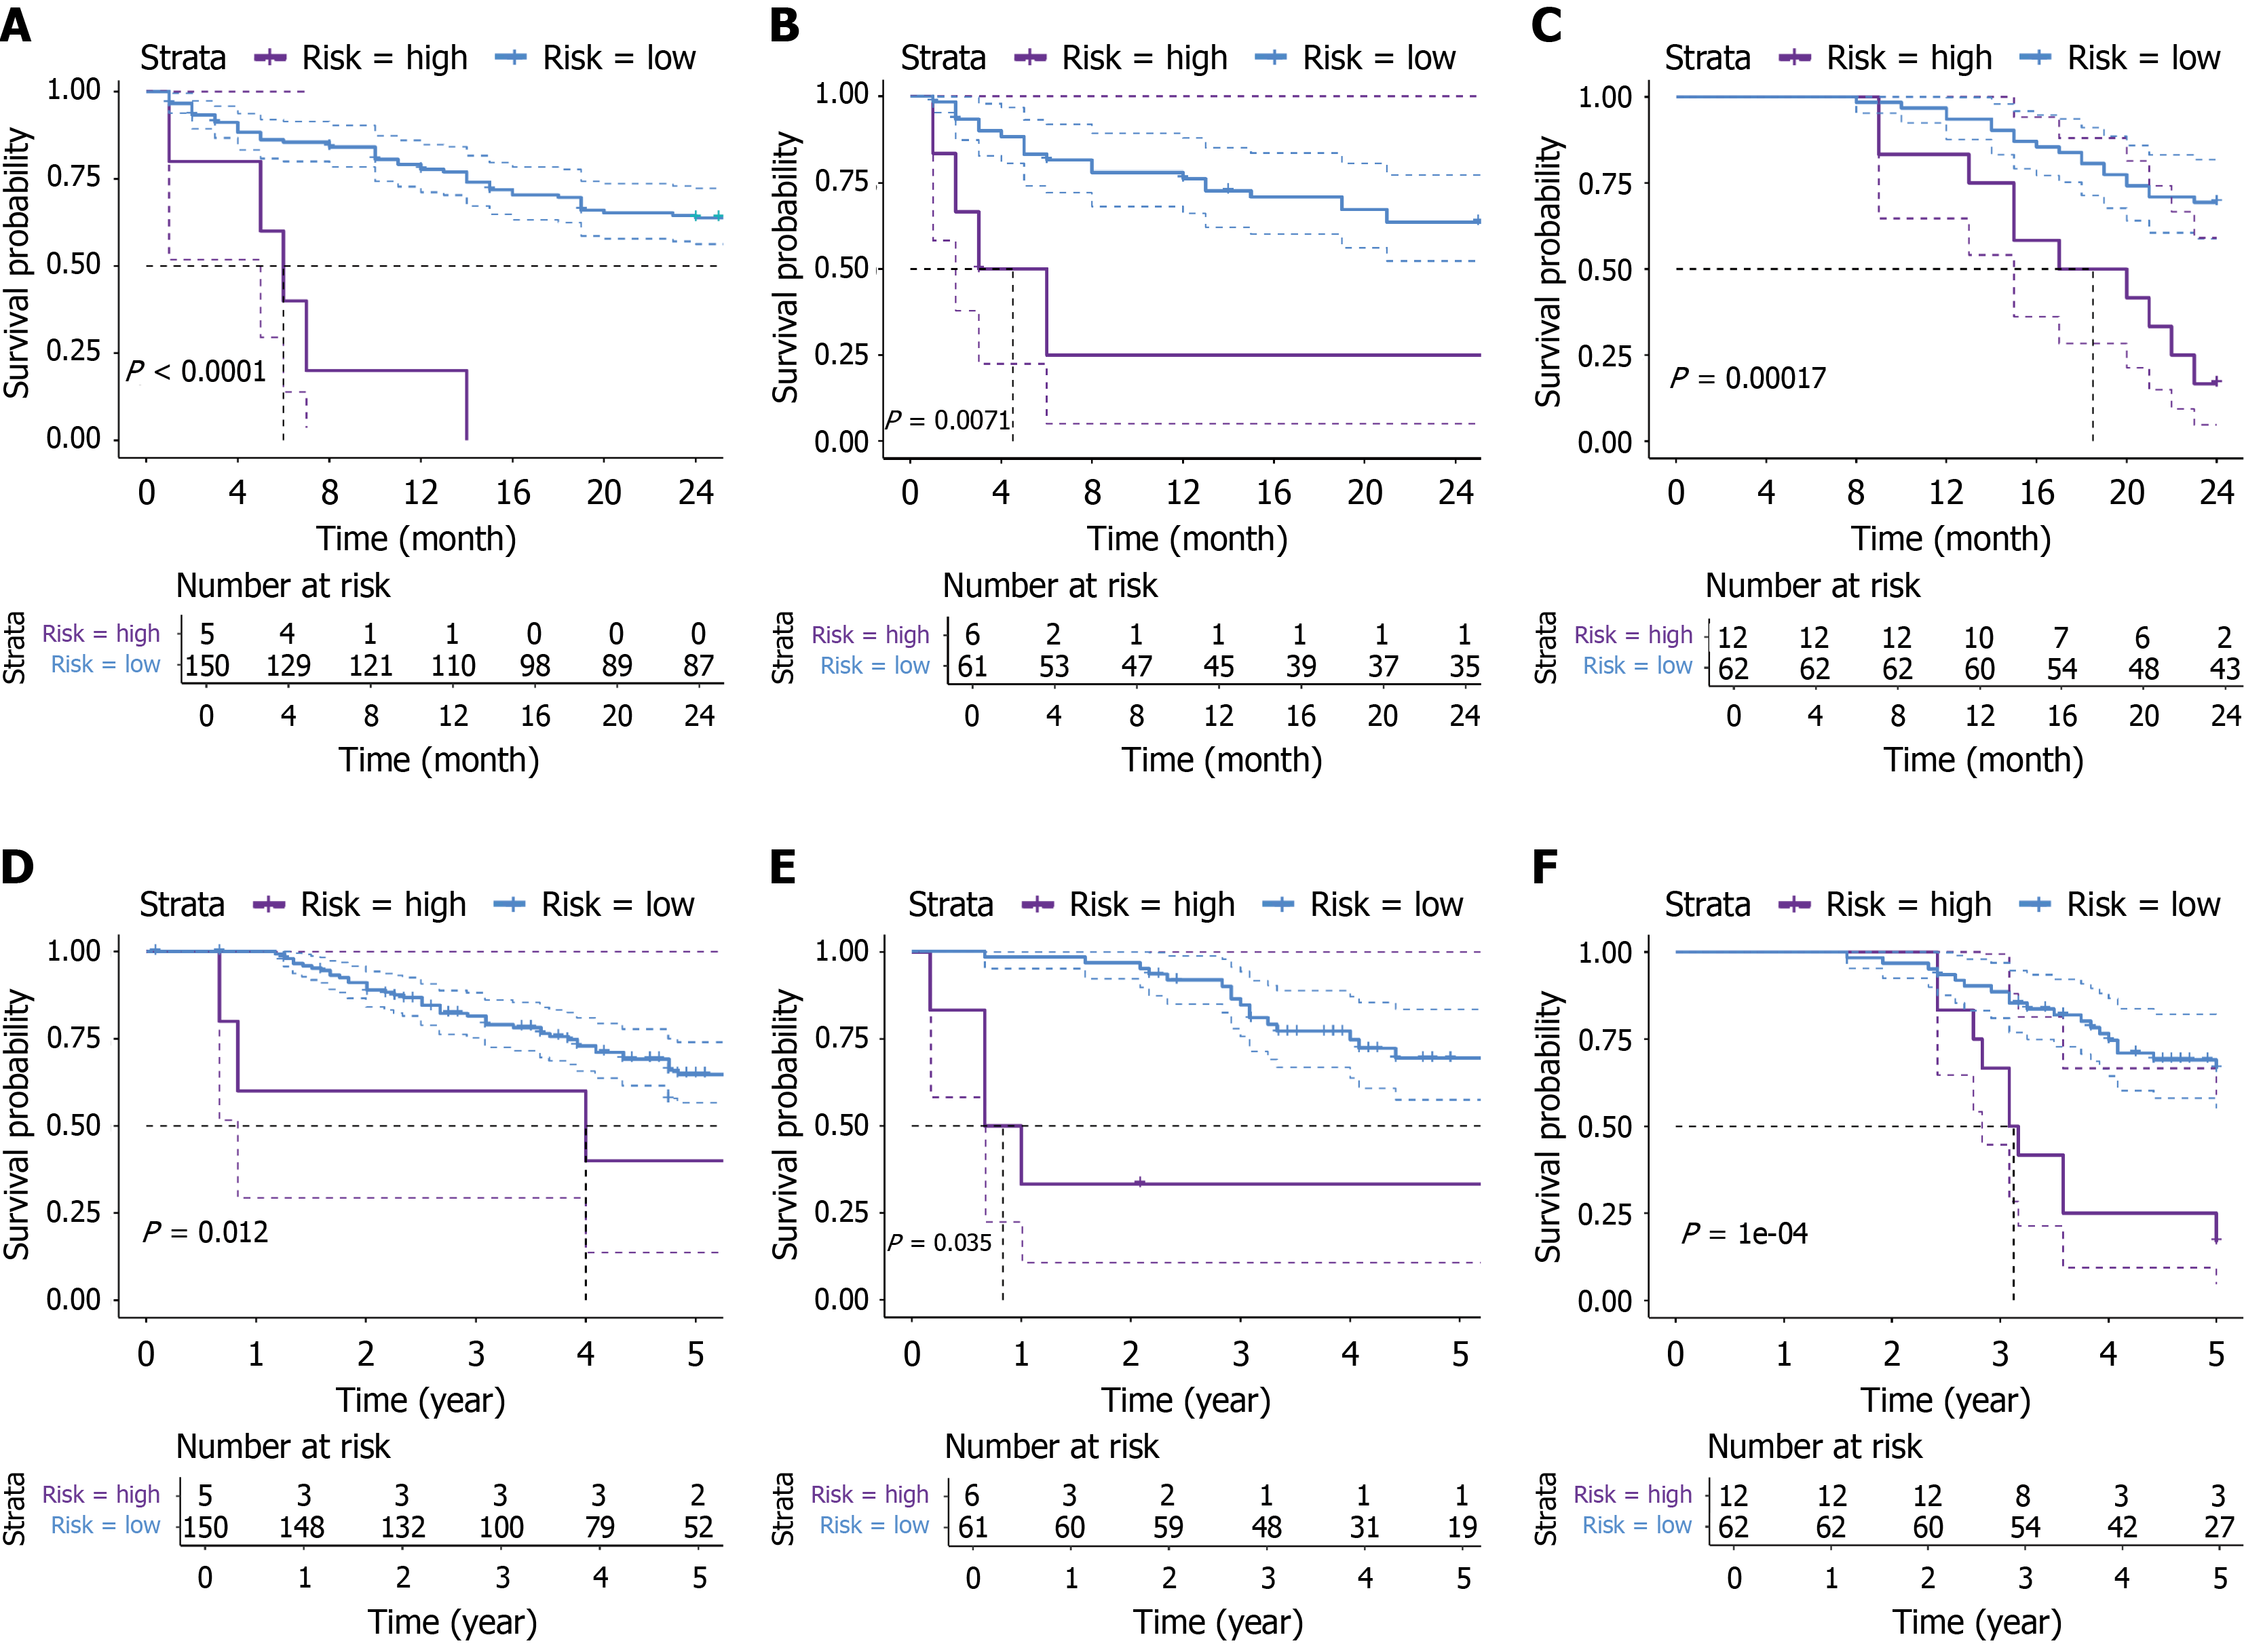
Figure 7 Kaplan-Meier curves of 2-year progression-free survival and 5-year overall survival for the combined model.
A: Kaplan-Meier curve of 2-year progression-free survival (PFS) for the combined model in the training set; B: Kaplan-Meier curve of 2-year PFS for the combined model in the internal validation set; C: Kaplan-Meier curve of 2-year PFS for the combined model in the external validation set; D: Kaplan-Meier curve of 5-year overall survival (OS) for the combined model in the training set; E: Kaplan-Meier curve of 5-year OS for the combined model in the internal validation set; F: Kaplan-Meier curve of 5-year OS for the combined model in the external validation set.
- Citation: Li YH, Yao L, Qian GX, Lei XD, Tang ZQ, Guo BY, Du R, Zhu Y, Jia WD. Deep learning-enhanced peritumoral radiomics predicts early recurrence after hepatocellular carcinoma ablation: A two-center study. World J Gastrointest Oncol 2026; 18(10): 122464
- URL: https://www.wjgnet.com/1948-5204/full/v18/i10/122464.htm
- DOI: https://dx.doi.org/10.4251/wjgo.122464