Copyright
©The Author(s) 2025.
World J Gastrointest Oncol. Aug 15, 2025; 17(8): 108679
Published online Aug 15, 2025. doi: 10.4251/wjgo.v17.i8.108679
Published online Aug 15, 2025. doi: 10.4251/wjgo.v17.i8.108679
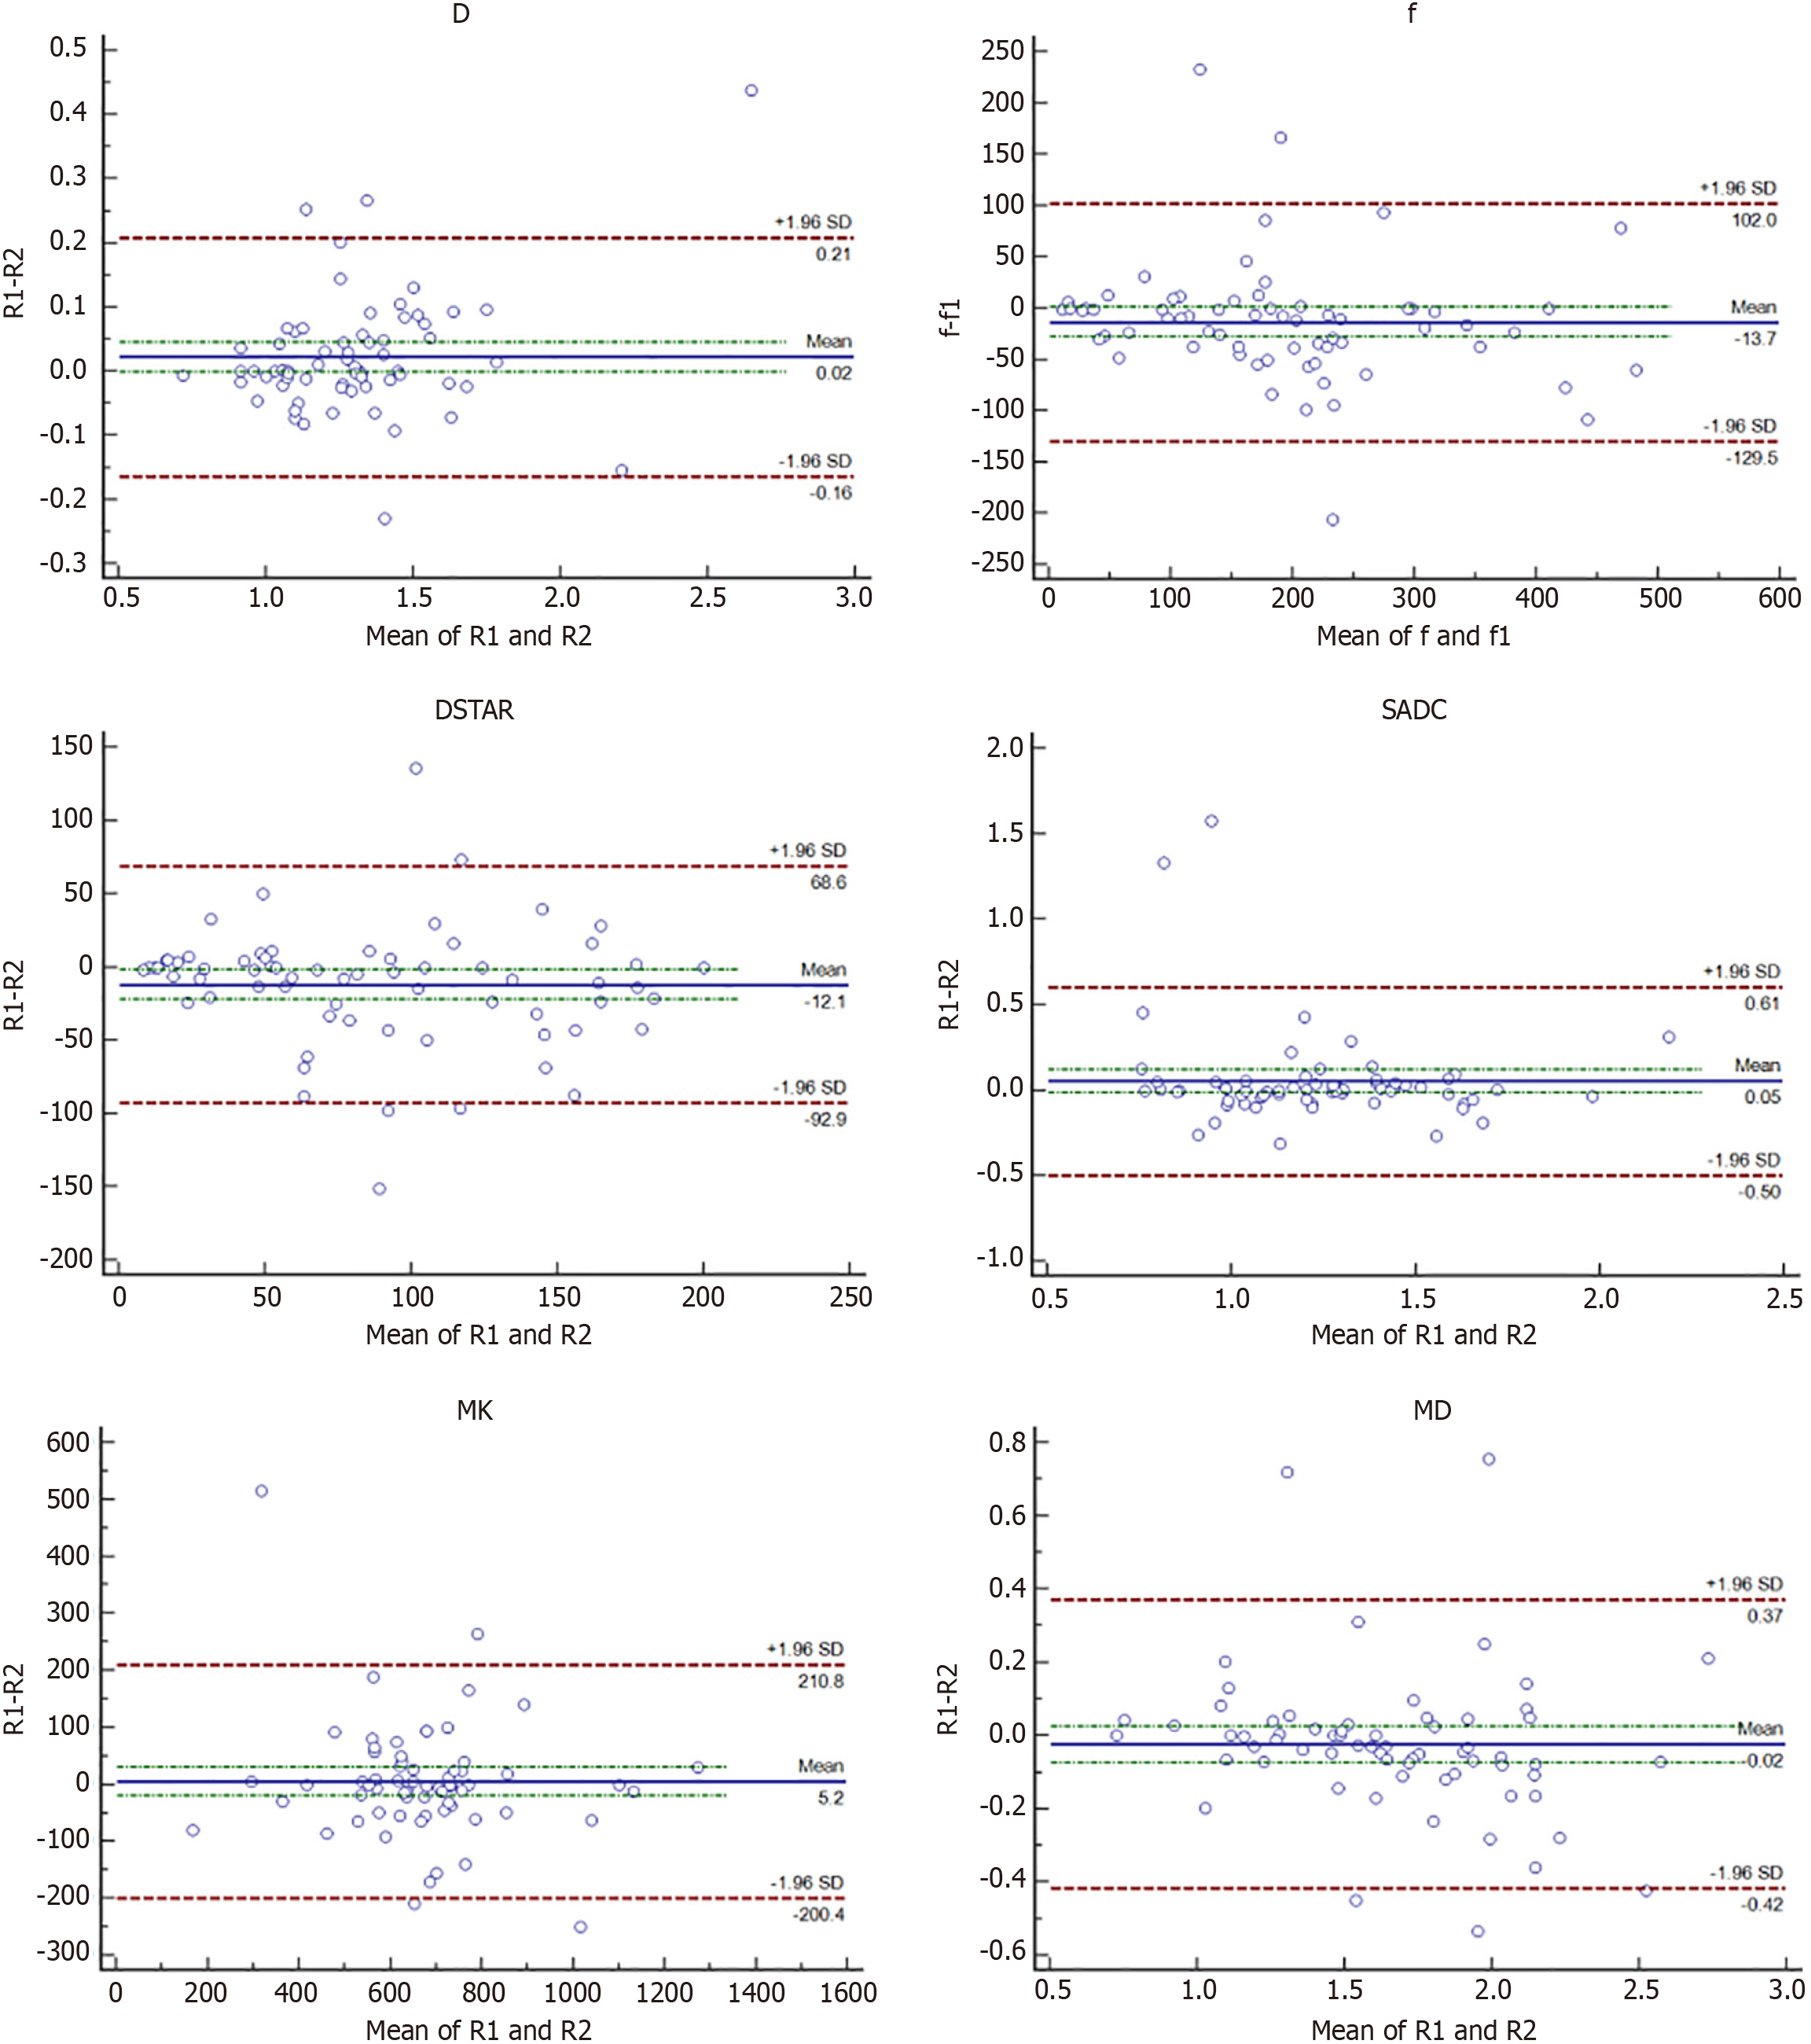
Figure 1 Bland-Altman analysis of differences between two radiologists in determining the standard apparent diffusion coefficient, imaging intravoxel incoherent motion (pure diffusion coefficient, perfusion fraction, pseudo diffusion coefficient), and diffusion kurtosis imaging (mean kurtosis coefficient, mean diffusion coefficient) parameters with hepatocellular carcinoma and intrahepatic cholan
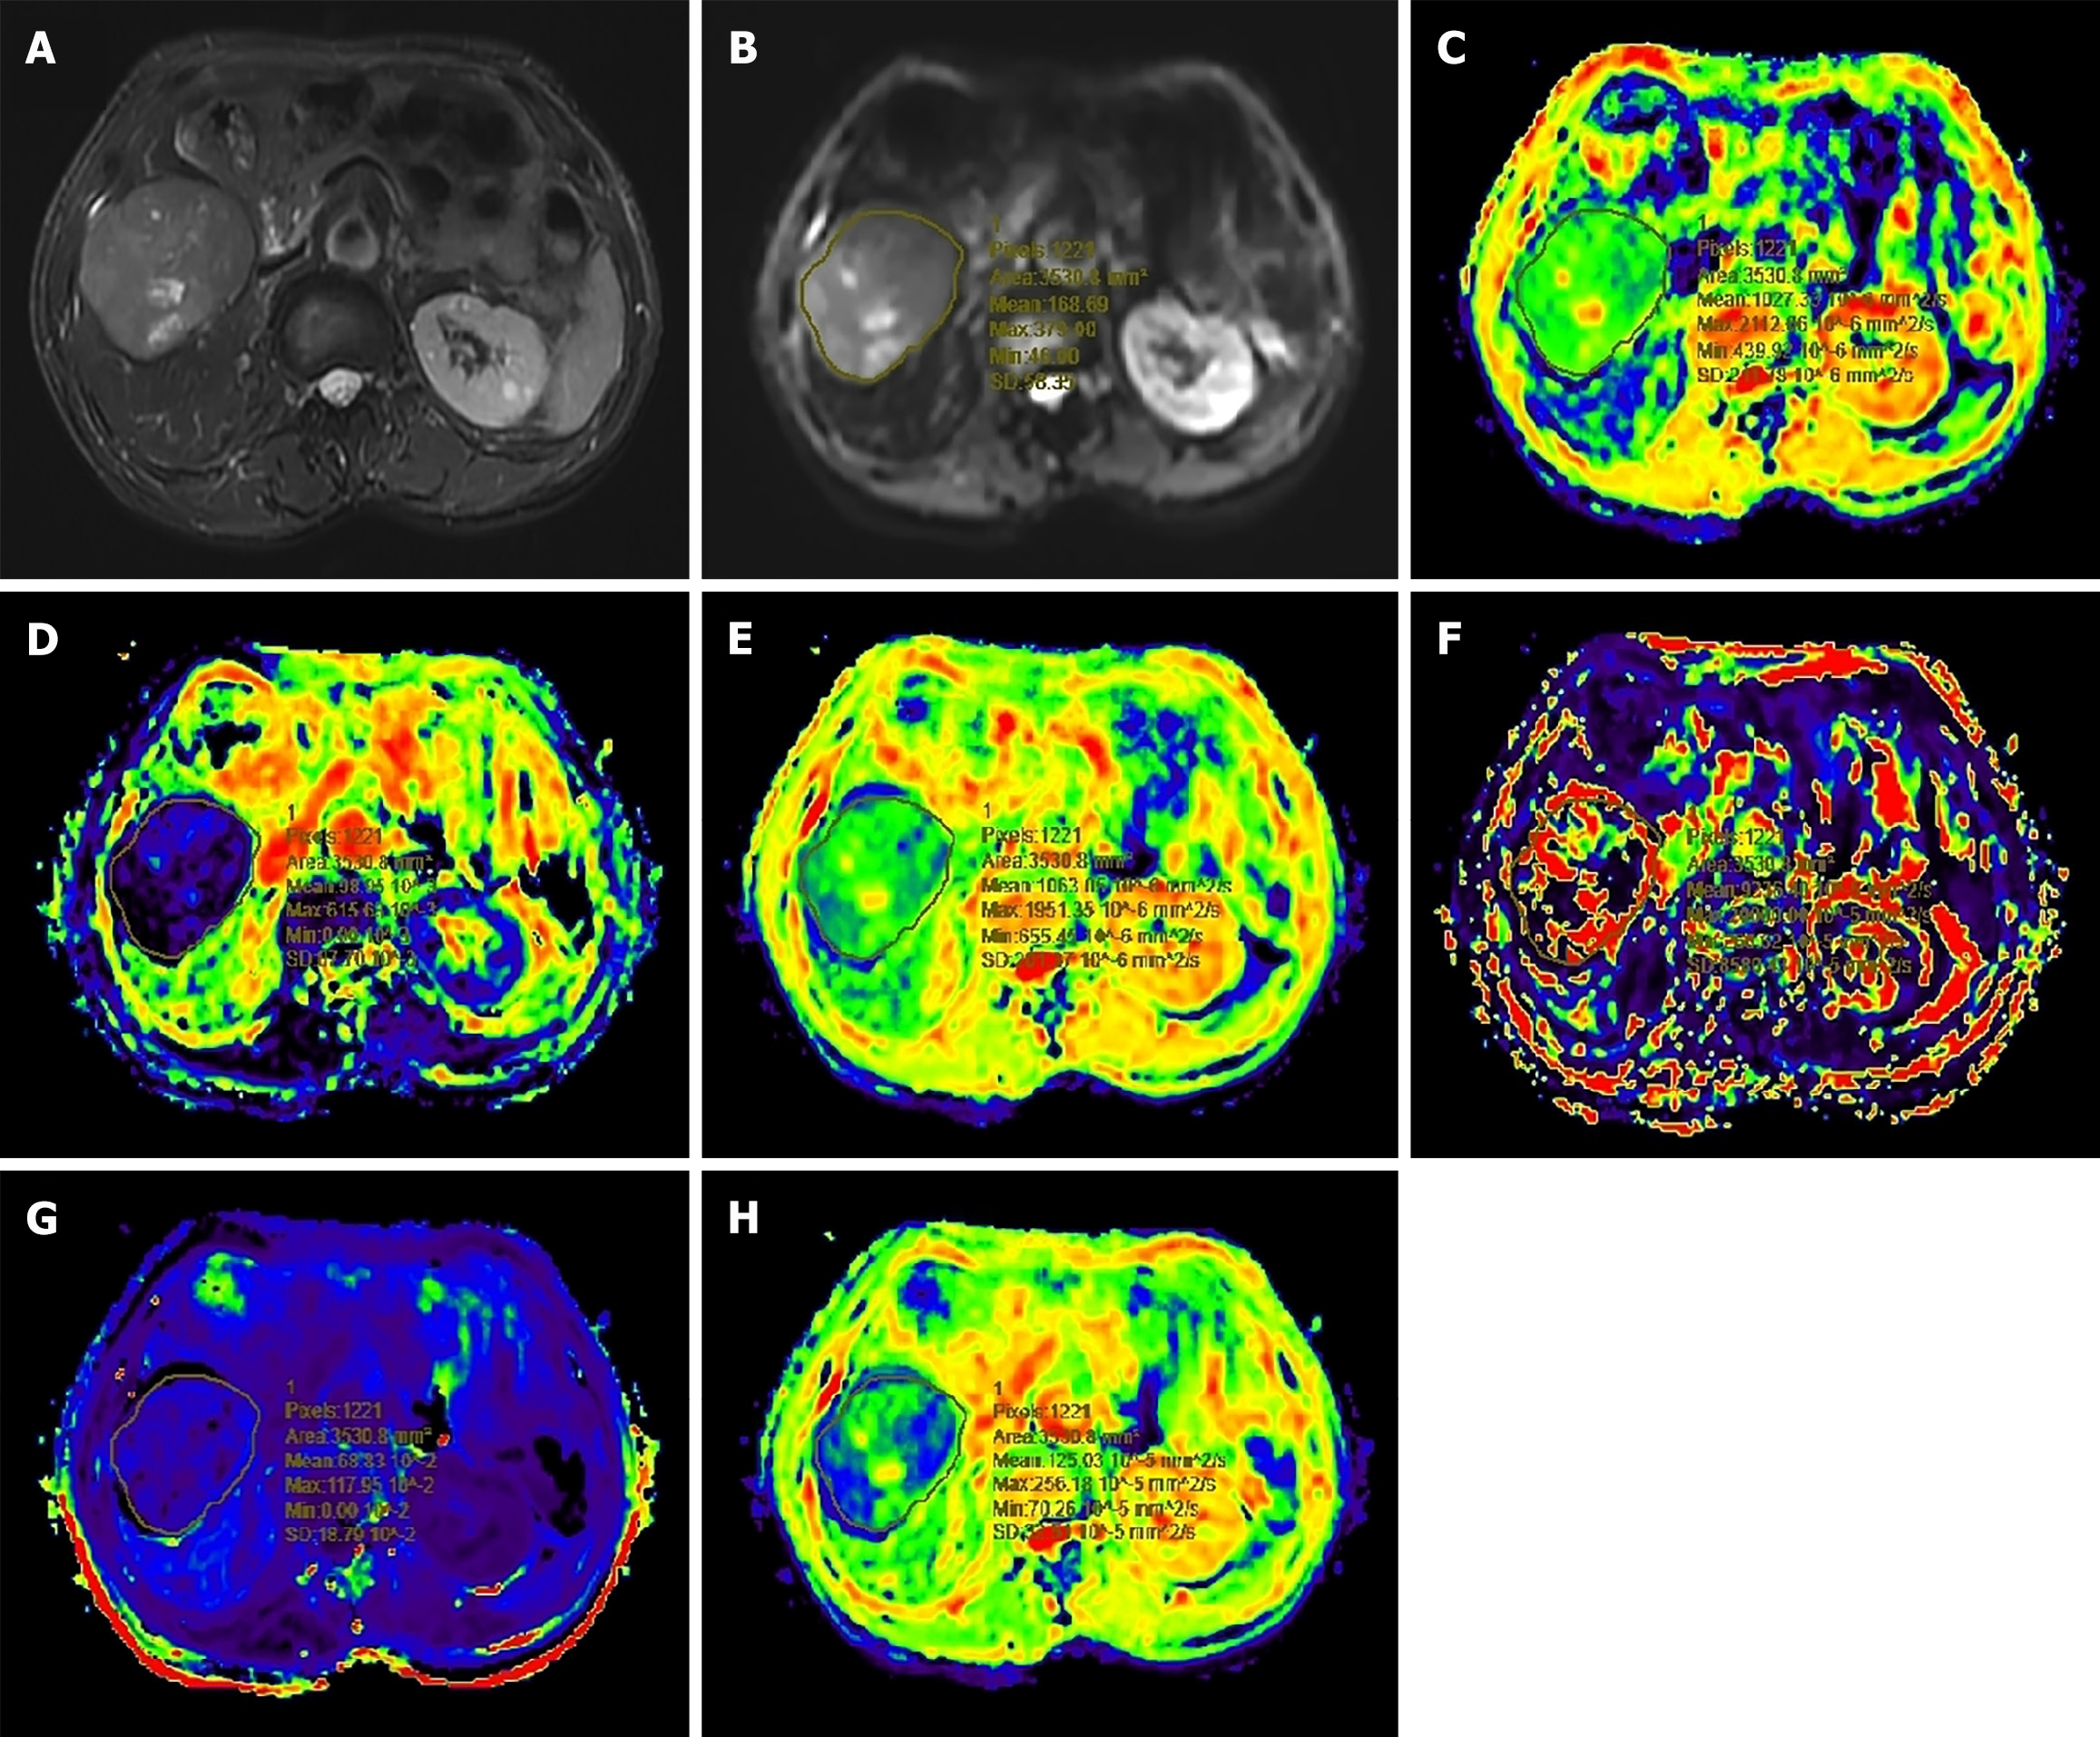
Figure 2 Surgically confirmed moderately differentiated hepatocellular carcinoma in a 65-year-old man.
A: T2-weighted imaging image; B: Diffusion-weighted image with b = 800 mm²/second; C: Pure diffusion coefficient (D) map; D: Perfusion fraction (f) map; E: Standard apparent diffusion coefficient (SADC) map; F: Pseudo diffusion coefficient (Dstar) map; G: Mean kurtosis coefficient (MK) map; H: Mean diffusion coefficient (MD) map. The mean D, f, SADC, Dstar, MK, and MD values for the tumor were 0997 × 10-3 mm²/second, 92.62 × 10⁻³ mm²/second, 1.037 × 10⁻³ mm²/second, 55.18 × 10⁻³ mm²/second, 651 × 10-3 mm²/second, and 1.179 × 10⁻³ mm²/second, respectively.
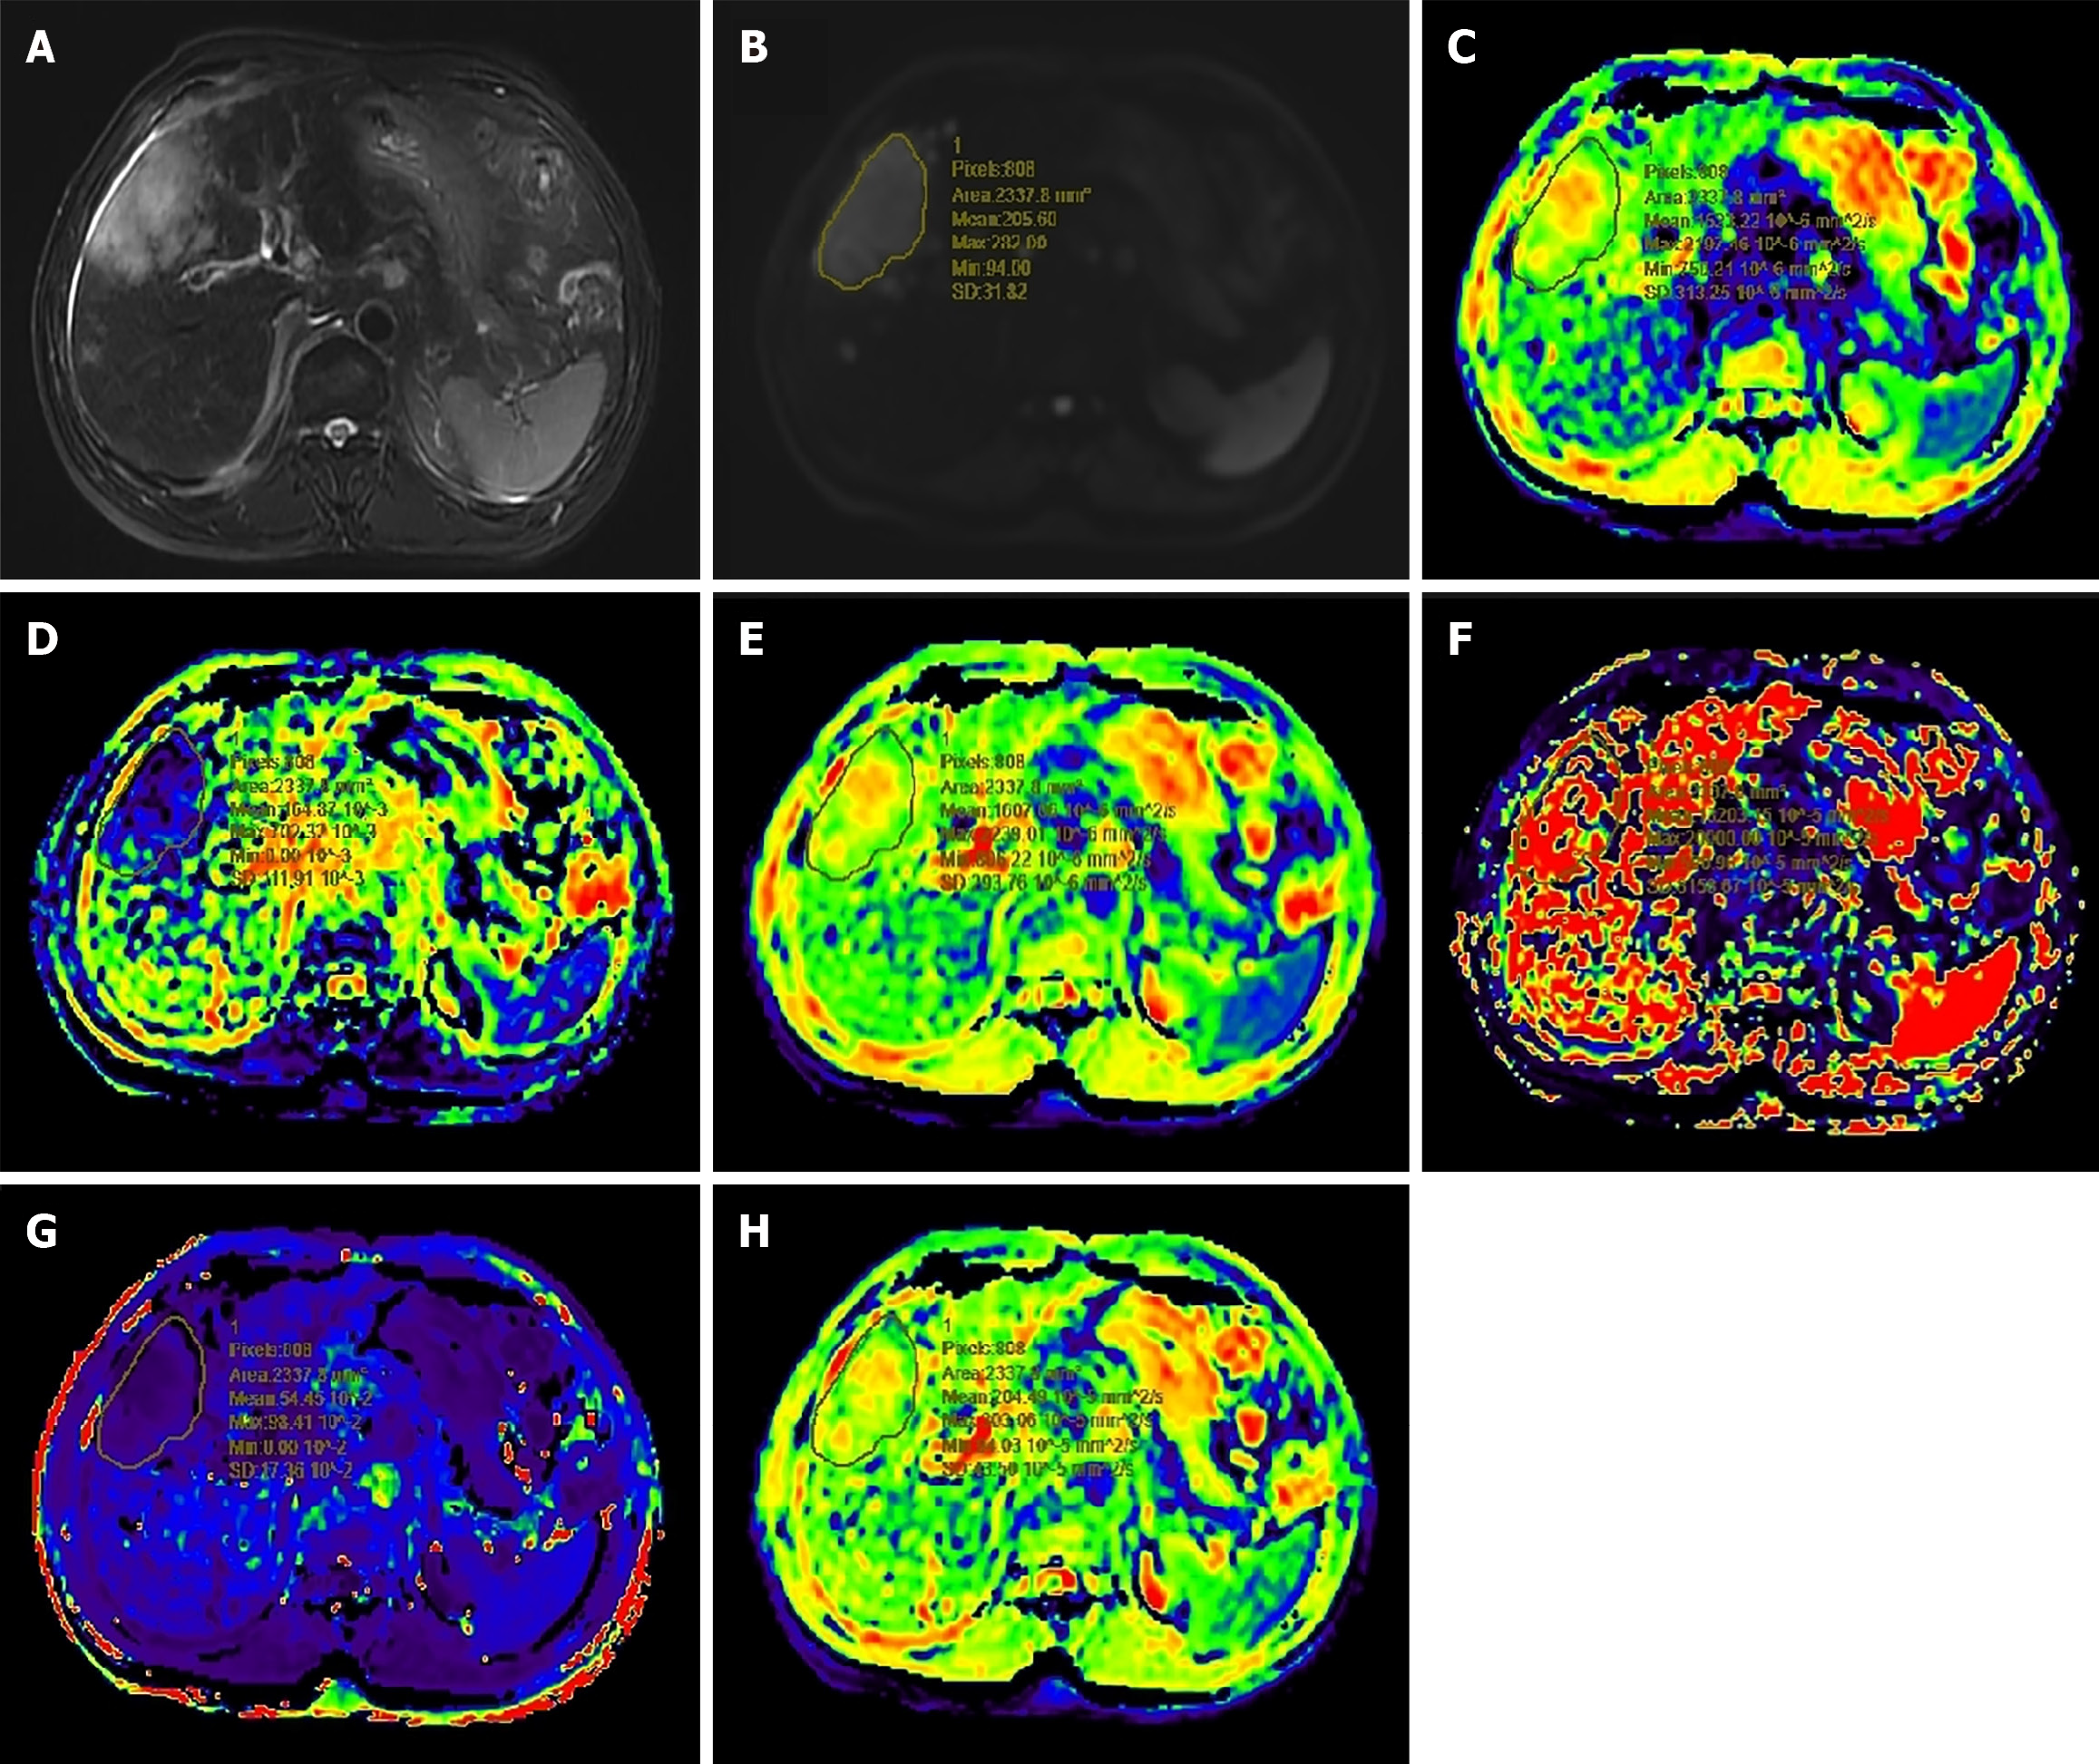
Figure 3 Puncture biopsy confirmed intrahepatic cholangiocarcinoma in a 52-year-old man.
A: T2-weighted imaging image; B: Diffusion-weighted image with b = 800 mm²/second; C: Pure diffusion coefficient (D) map; D: Perfusion fraction (f) map; E: Standard apparent diffusion coefficient (SADC) map; F: Pseudo diffusion coefficient (Dstar) map; G: Mean kurtosis coefficient (MK) map; H: Mean diffusion coefficient (MD) map. The mean D, f, SADC, Dstar, MK, and MD values for the tumor were 1609 × 10-3 mm²/second, 143.89 × 10⁻³ mm²/second, 1.630 × 10⁻³ mm²/second, 134.59 × 10⁻³ mm²/second, 552.6 × 10⁻³ mm²/second, 2.064 × 10⁻³ mm²/second, respectively.
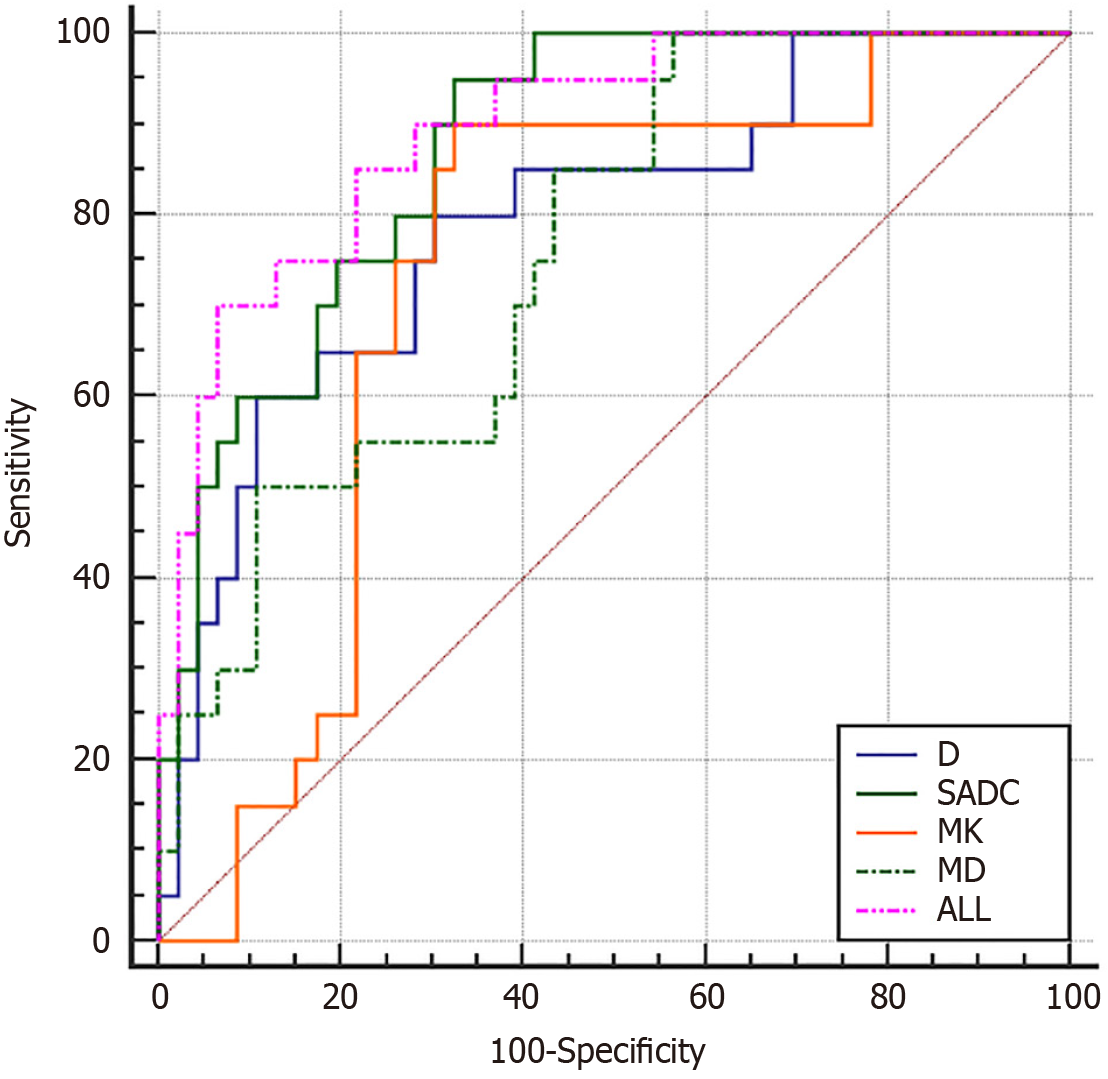
Figure 4 Receiver operating characteristic curves of the standard apparent diffusion coefficient, pure diffusion coefficient, mean kurtosis coefficient, and mean diffusion coefficient for differentiating between hepatocellular carcinoma and intrahepatic cholangiocarcinoma.
D: Pure diffusion coefficient; MD: Mean diffusion coefficient; MK: Mean kurtosis coefficient; SADC: Standard apparent diffusion coefficient.
- Citation: Li SM, Feng MW, Ji GH, Song XP, Mao W, Zhou T, Guo XF, Yuan ZL, Liu YL. Value of intravoxel incoherent motion and diffusion kurtosis imaging to differentiate hepatocellular carcinoma and intrahepatic cholangiocarcinoma. World J Gastrointest Oncol 2025; 17(8): 108679
- URL: https://www.wjgnet.com/1948-5204/full/v17/i8/108679.htm
- DOI: https://dx.doi.org/10.4251/wjgo.v17.i8.108679


