Copyright
©The Author(s) 2025.
World J Gastrointest Oncol. Aug 15, 2025; 17(8): 106781
Published online Aug 15, 2025. doi: 10.4251/wjgo.v17.i8.106781
Published online Aug 15, 2025. doi: 10.4251/wjgo.v17.i8.106781
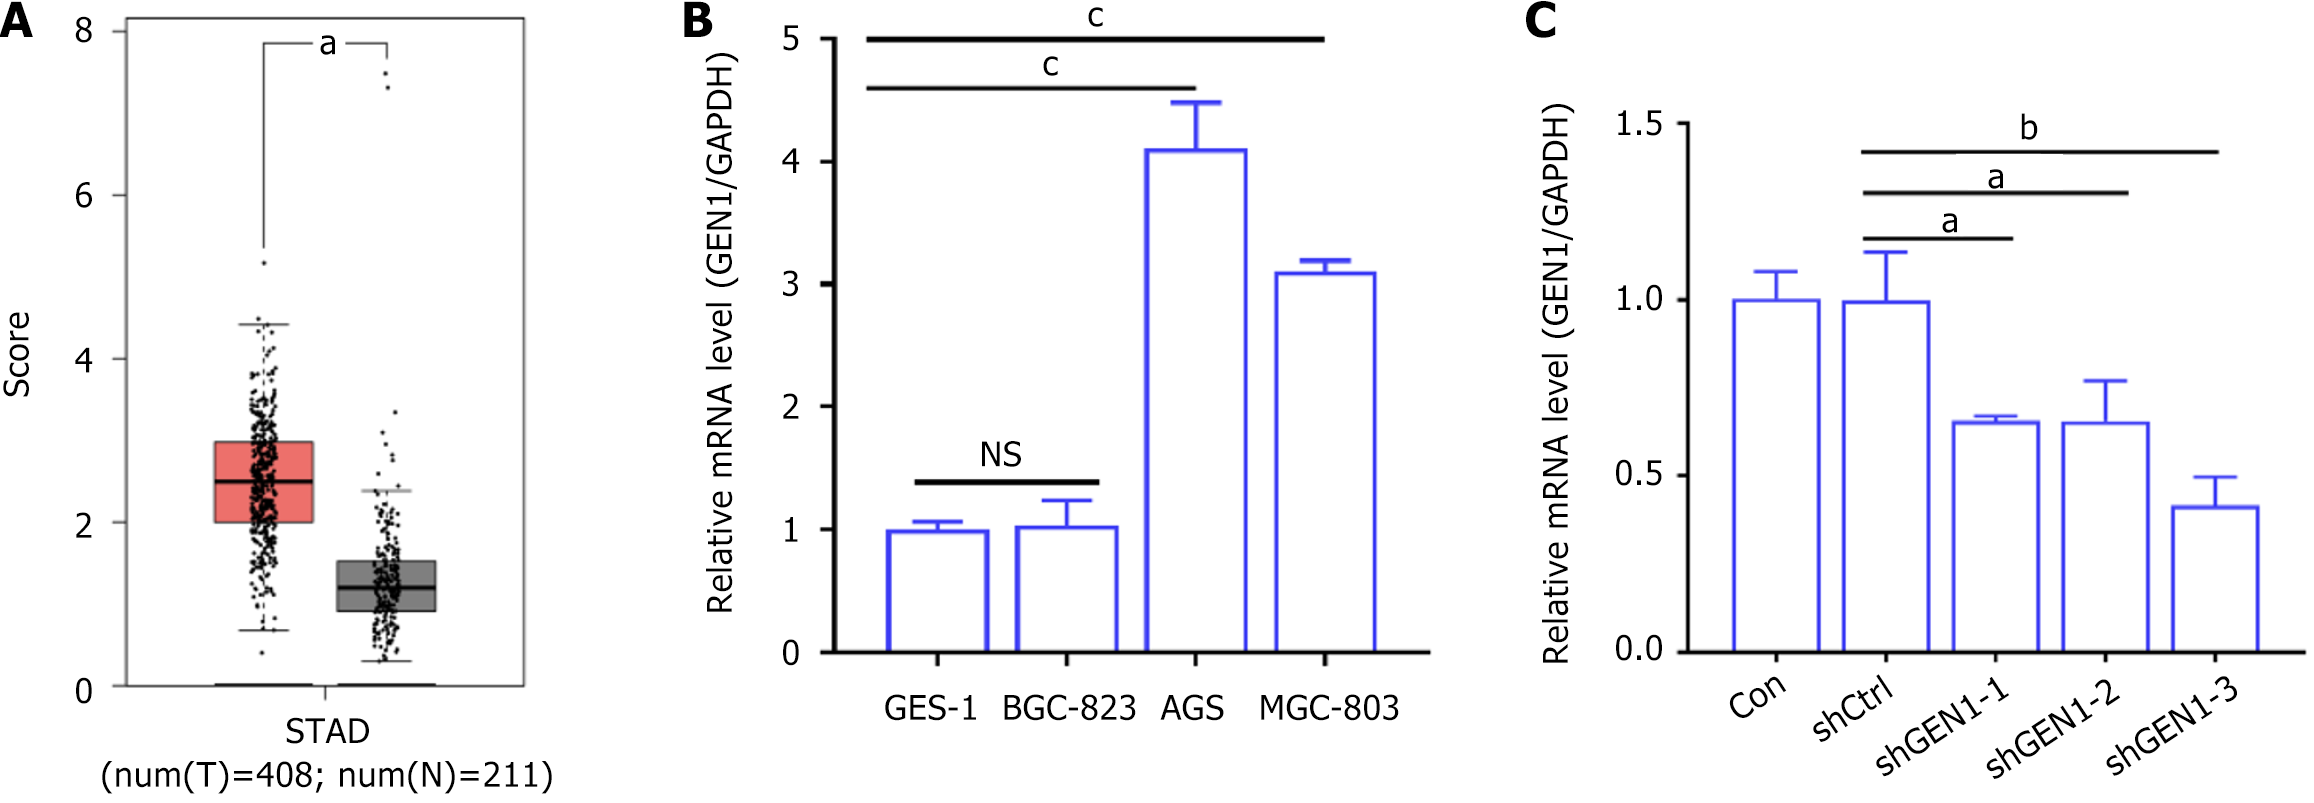
Figure 1 GEN1 was over-expressed in gastric cancer.
A: Gene expression profiling interactive analysis were used to investigate the expression of GEN1 in gastric cancer (GC); B: Real-time quantitative polymerase chain reaction detected GEN1 mRNA levels in GC cells (n = 3); C: Knockdown of GEN1 was successfully done in AGS cells by transfecting with short hairpin (sh) GEN1-1, shGEN1-2, or shGEN1-3 (n = 3). aP < 0.05. bP < 0.01. cP < 0.001. STAD: Stomach adenocarcinomas; GAPDH: Glyceraldehyde-3-phosphate dehydrogenase; CON: Control; shCtrl: Negative control with scrambled shRNA; sh: Short hairpin.
Figure 2 The interference efficiency of shGEN1 on GEN1 in AGS cells.
A: Observation of the state of negative control with scrambled shRNA and shGEN1 infected cells after 72 hours under a fluorescence microscope; B: Real-time quantitative polymerase chain reaction detected the expression levels of GEN1 mRNA after lentiviral infection (middle) (n = 3); C: Western blotting detected GEN1 protein levels after lentiviral infection (right) (n = 3). bP < 0.01. GAPDH: Glyceraldehyde-3-phosphate dehydrogenase; GFP: Green fluorescent protein; shCtrl: Negative control with scrambled shRNA; sh: Short hairpin.
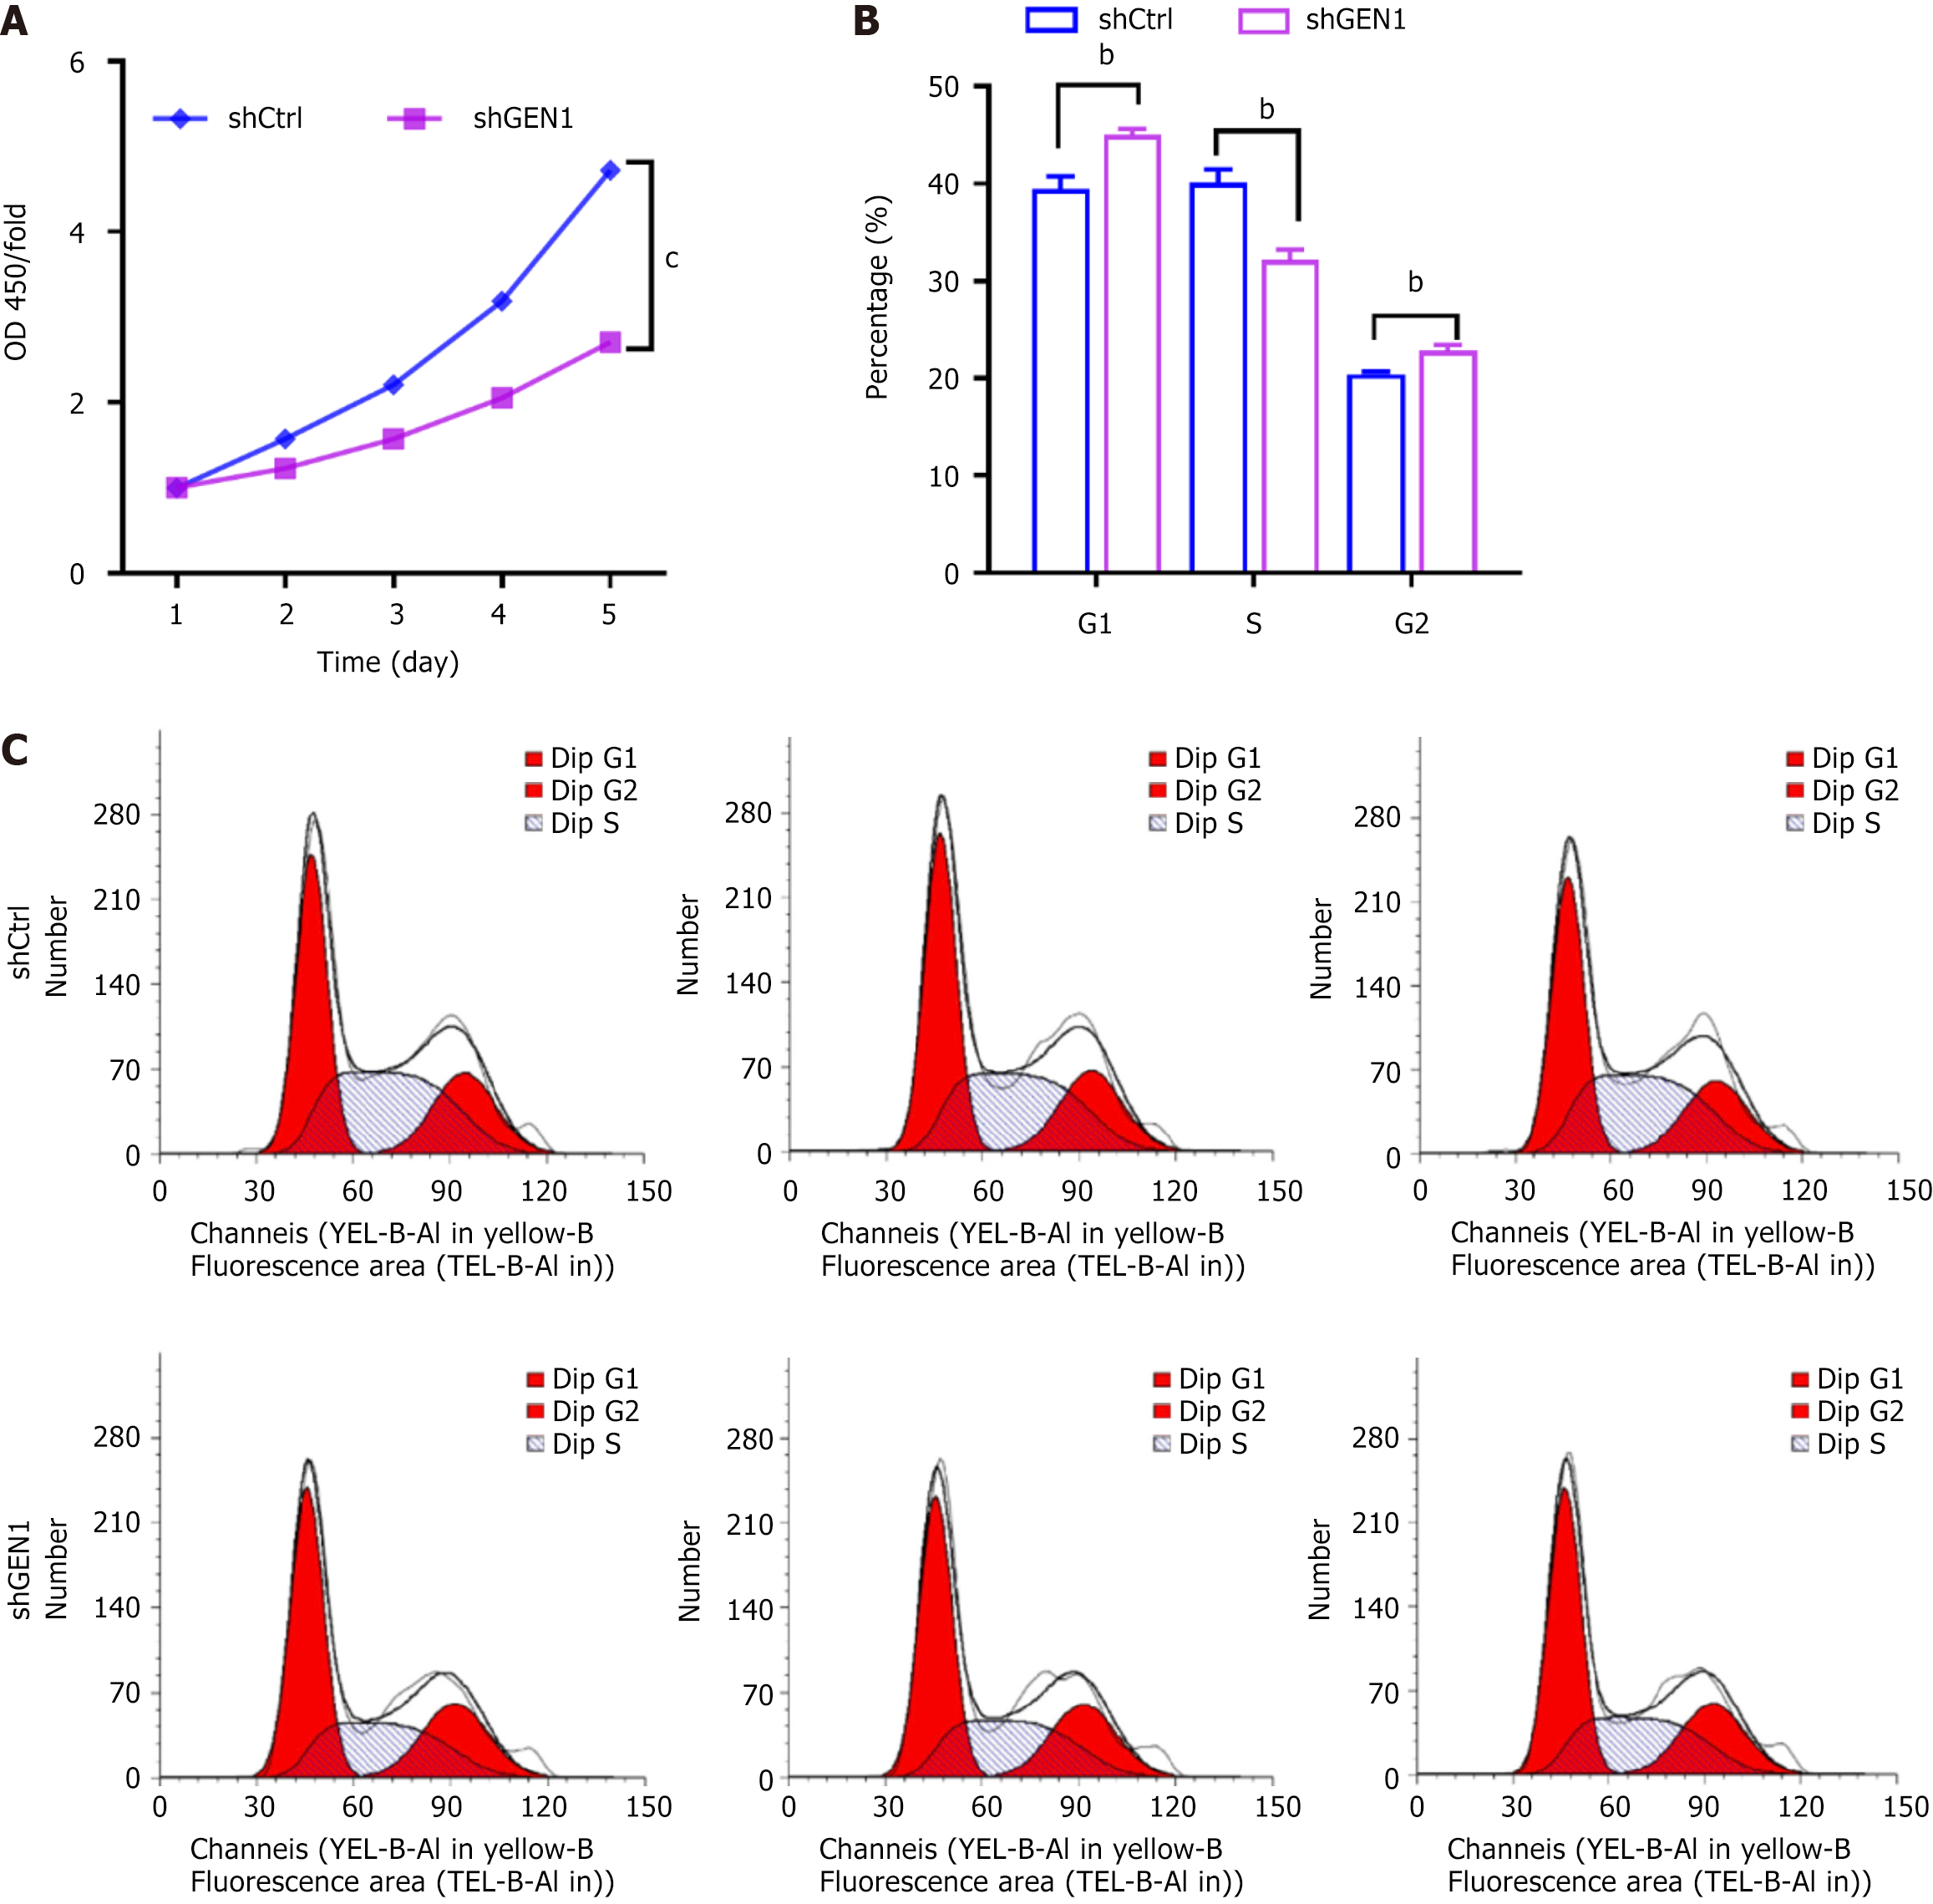
Figure 3 Silencing of GEN1 repressed AGS cell proliferation and cell cycle progression.
A: Cell counting kit-8 assays assessed the proliferation of AGS cells transfected with negative control with scrambled shRNA cells (shCtrl) or short hairpin GEN1 (n = 3); B and C: Flow cytometry assays determined the percentage of AGS cells transfected with shCtrl or shGEN1 at different stages (n = 3). bP < 0.01. cP < 0.001. OD: Optical density; shCtrl: Negative control with scrambled shRNA; sh: Short hairpin.
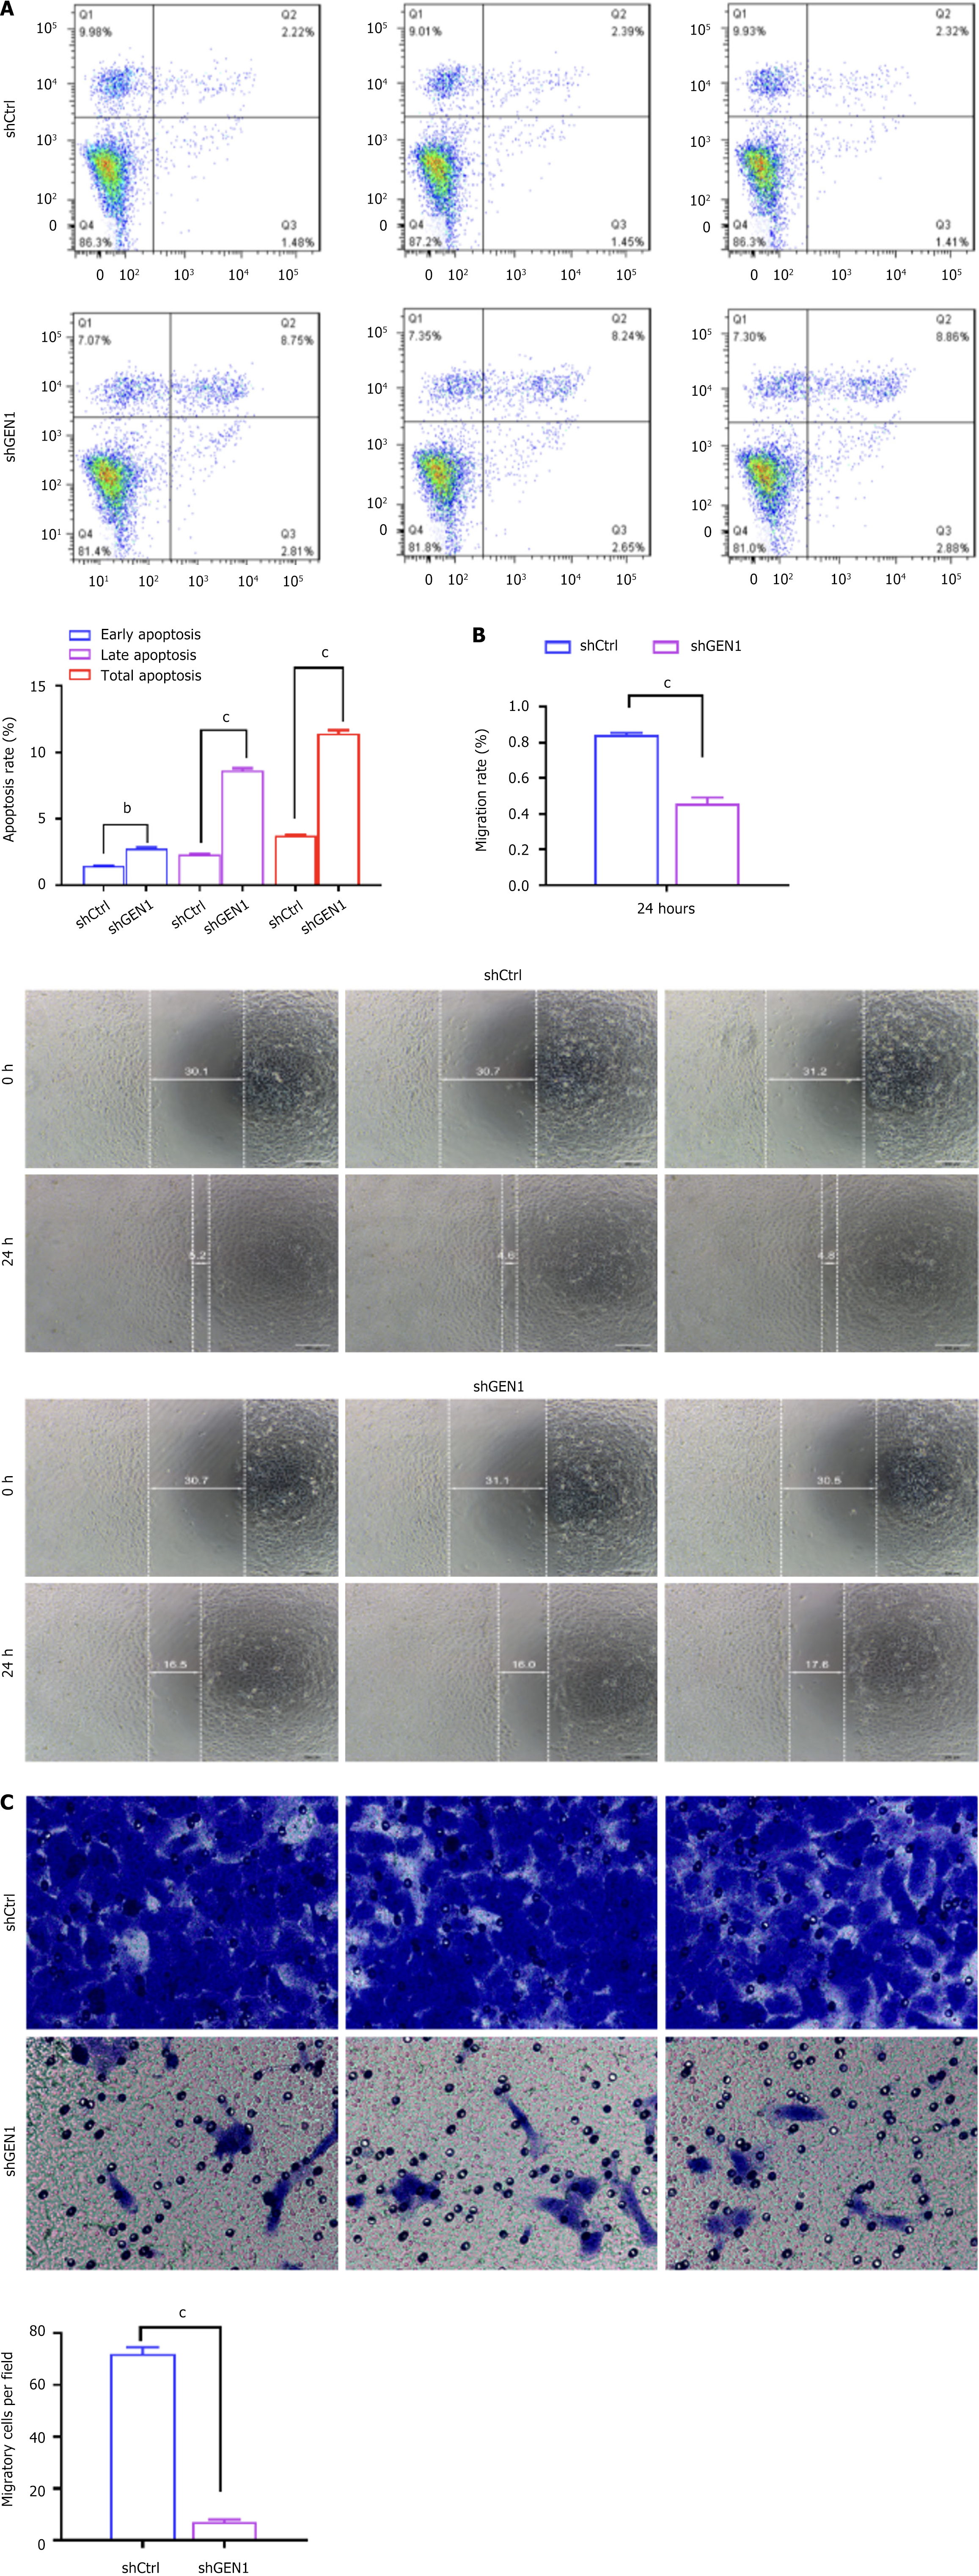
Figure 4 Inhibition of GEN1 intensified cell apoptosis and decreased cell migration in AGS cells.
A-C: Flow cytometry (A), wound-healing (B) and transwell assays (C) analyzed the apoptosis and migration of AGS cells transfected with negative control with scrambled shRNA or shGEN1 (n = 3). bP < 0.01. cP < 0.001. shCtrl: Negative control with scrambled shRNA; sh: Short hairpin.
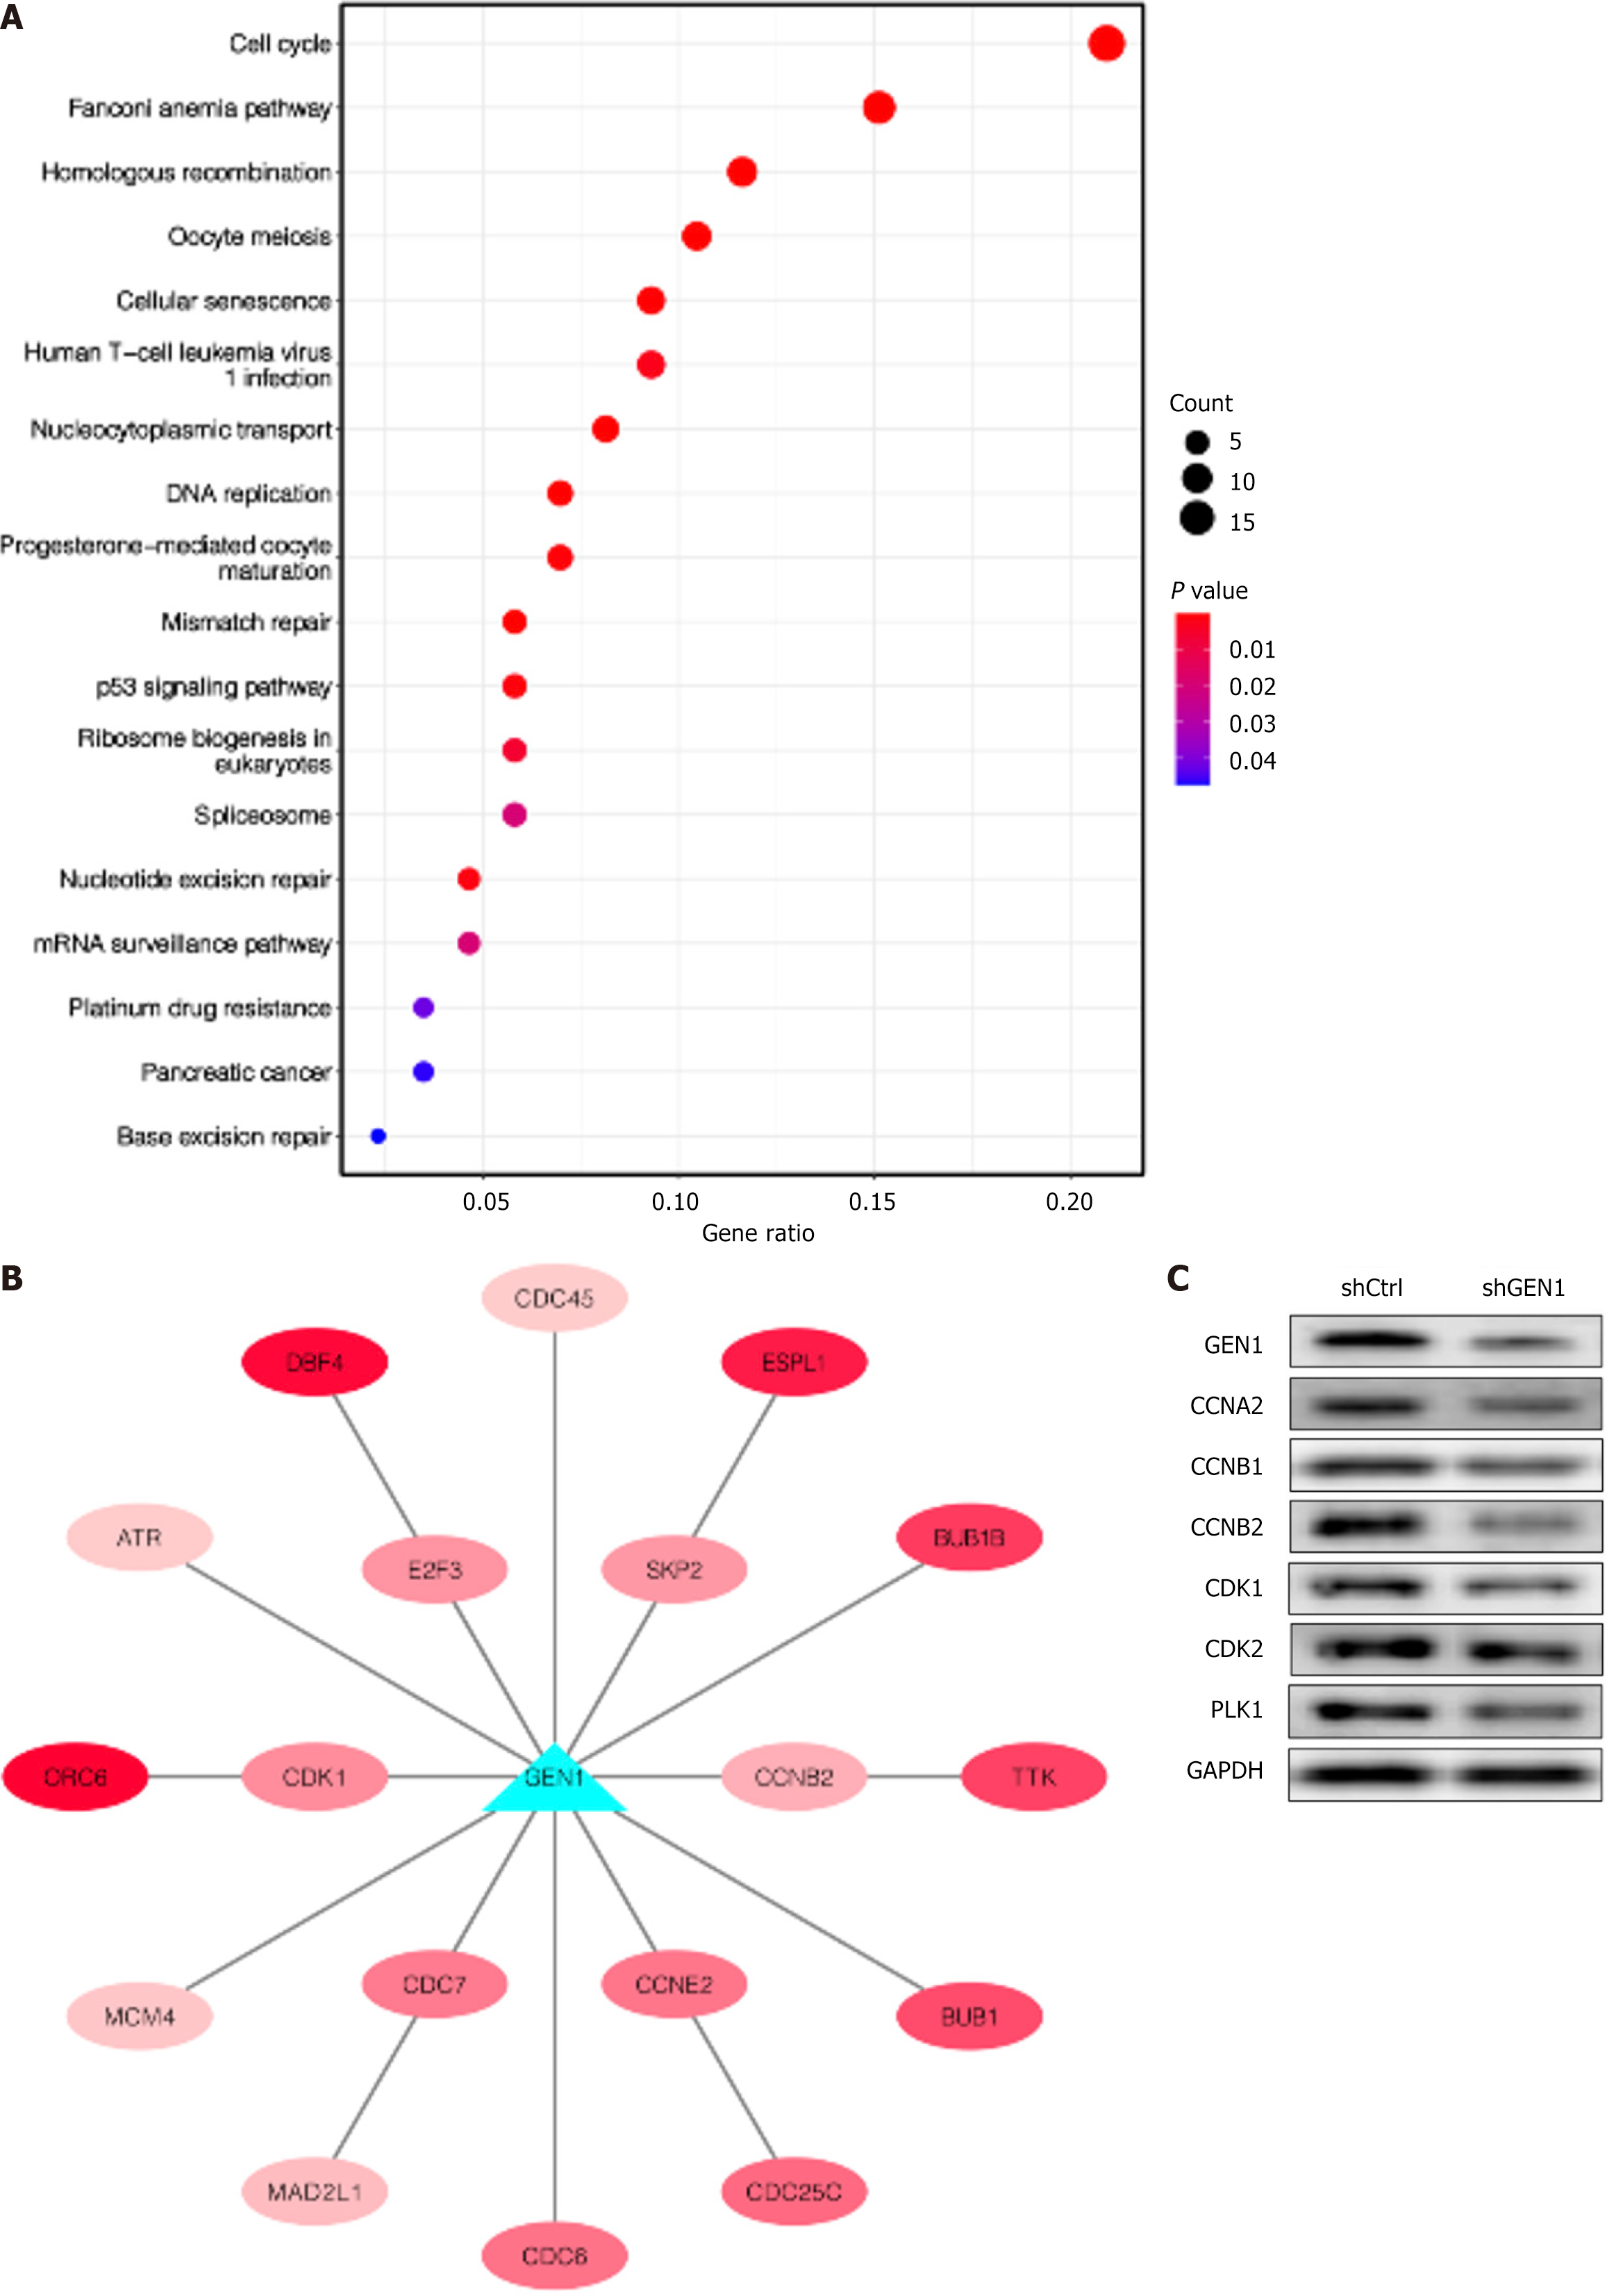
Figure 5 Enrichment analysis of GEN1-related genes.
A: The Kyoto Encyclopedia of Genes and Genomes enrichment analysis was applied with 264 genes associated with GEN1 (r > 0.4, P < 0.001); B: Visualization of the genes of the cell cycle pathway associated with GEN1 through cytoscape. Red represented a positive correlation, and the darker the color, the stronger the correlation; C: Western blotting detected CCNA2, CCNB1, CCNB2, cyclin-dependent kinase (CDK) 1, CDK2 and polo-like kinase 1 protein levels in AGS cells transfected with negative control with scrambled shRNA cells or shGEN1 (n = 3). sh: Short hairpin; CDK: Cyclin-dependent kinase; PLK1: Polo-like kinase 1; GAPDH: Glyceraldehyde-3-phosphate dehydrogenase; ATP: Adenosine triphosphate.
Figure 6 GEN1 downregulation impelled cell ferroptosis in AGS cells.
A: The adenosine triphosphate content in AGS cells transfected with negative control with scrambled shRNA cells or shGEN1; B: Dihydroethidium staining analysis of reactive oxygen species production in AGS cells; C: Western blotting detected ACSL4, GPX4, and FTH1 protein levels in AGS cells. cP < 0.001. ATP: Adenosine triphosphate; shCtrl: Negative control with scrambled shRNA; sh: Short hairpin; DAPI: 4’,6-diamidino-2-phenylindole; DHE: Dihydroethidium; GAPDH: Glyceraldehyde-3-phosphate dehydrogenase.
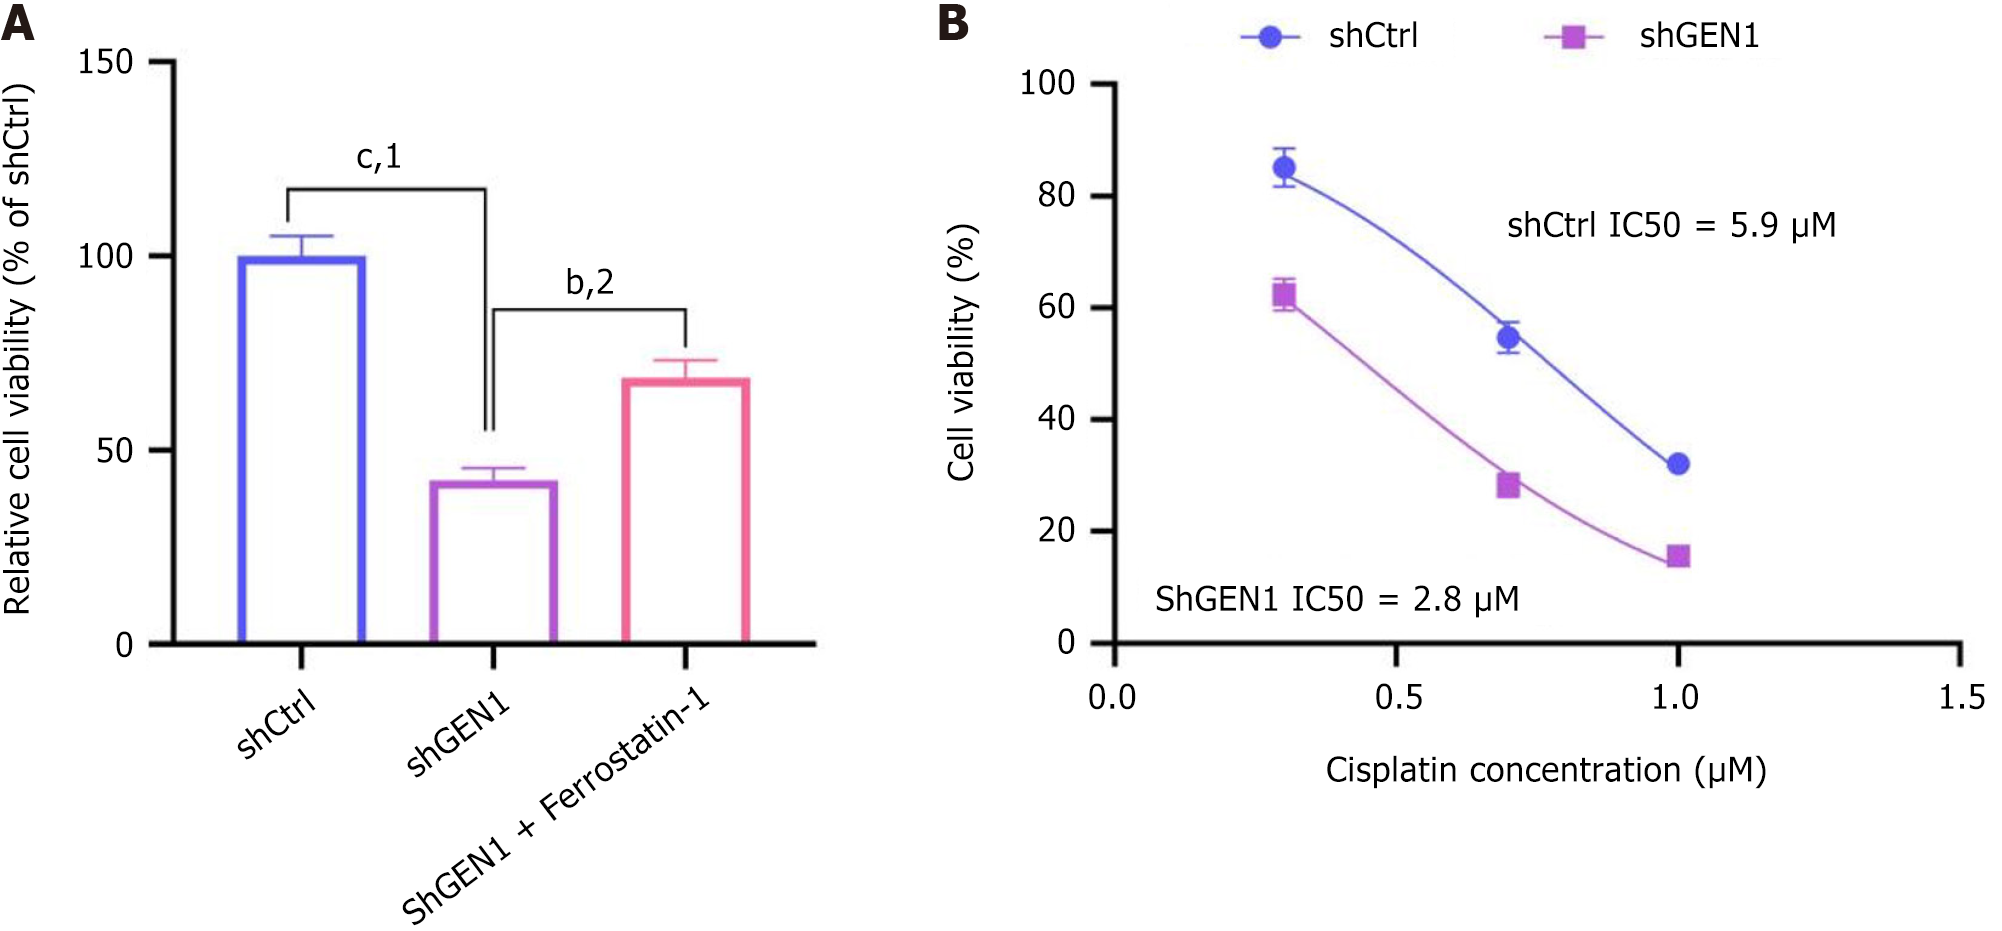
Figure 7 GEN1 knockdown sensitizes gastric cancer cells to ferroptosis and cisplatin.
A: Ferrostatin-1 rescues cell viability in GEN1-knockdown AGS cells. Data are mean ± SD (n = 3); B: Dose-response curves of cisplatin in negative control with scrambled shRNA and shGEN1 AGS cells. Half-maximal inhibitory concentration values: ShCtrl = 5.9 μM, shGEN1 = 2.8 μM (P < 0.001, unpaired t-test). bP < 0.01. cP < 0.001. 1P vs negative control with scrambled shRNA. 2P vs shGEN1 (two-way analysis of variance). shCtrl: Negative control with scrambled shRNA; sh: Short hairpin; IC50: Half-maximal inhibitory concentration.
- Citation: Zhang Q, Yuan ZG, Zheng KF, Chen K. GEN1 regulates cell proliferation, migration, apoptosis and ferroptosis in gastric cancer. World J Gastrointest Oncol 2025; 17(8): 106781
- URL: https://www.wjgnet.com/1948-5204/full/v17/i8/106781.htm
- DOI: https://dx.doi.org/10.4251/wjgo.v17.i8.106781


