Copyright
©The Author(s) 2025.
World J Gastrointest Oncol. Jul 15, 2025; 17(7): 107589
Published online Jul 15, 2025. doi: 10.4251/wjgo.v17.i7.107589
Published online Jul 15, 2025. doi: 10.4251/wjgo.v17.i7.107589
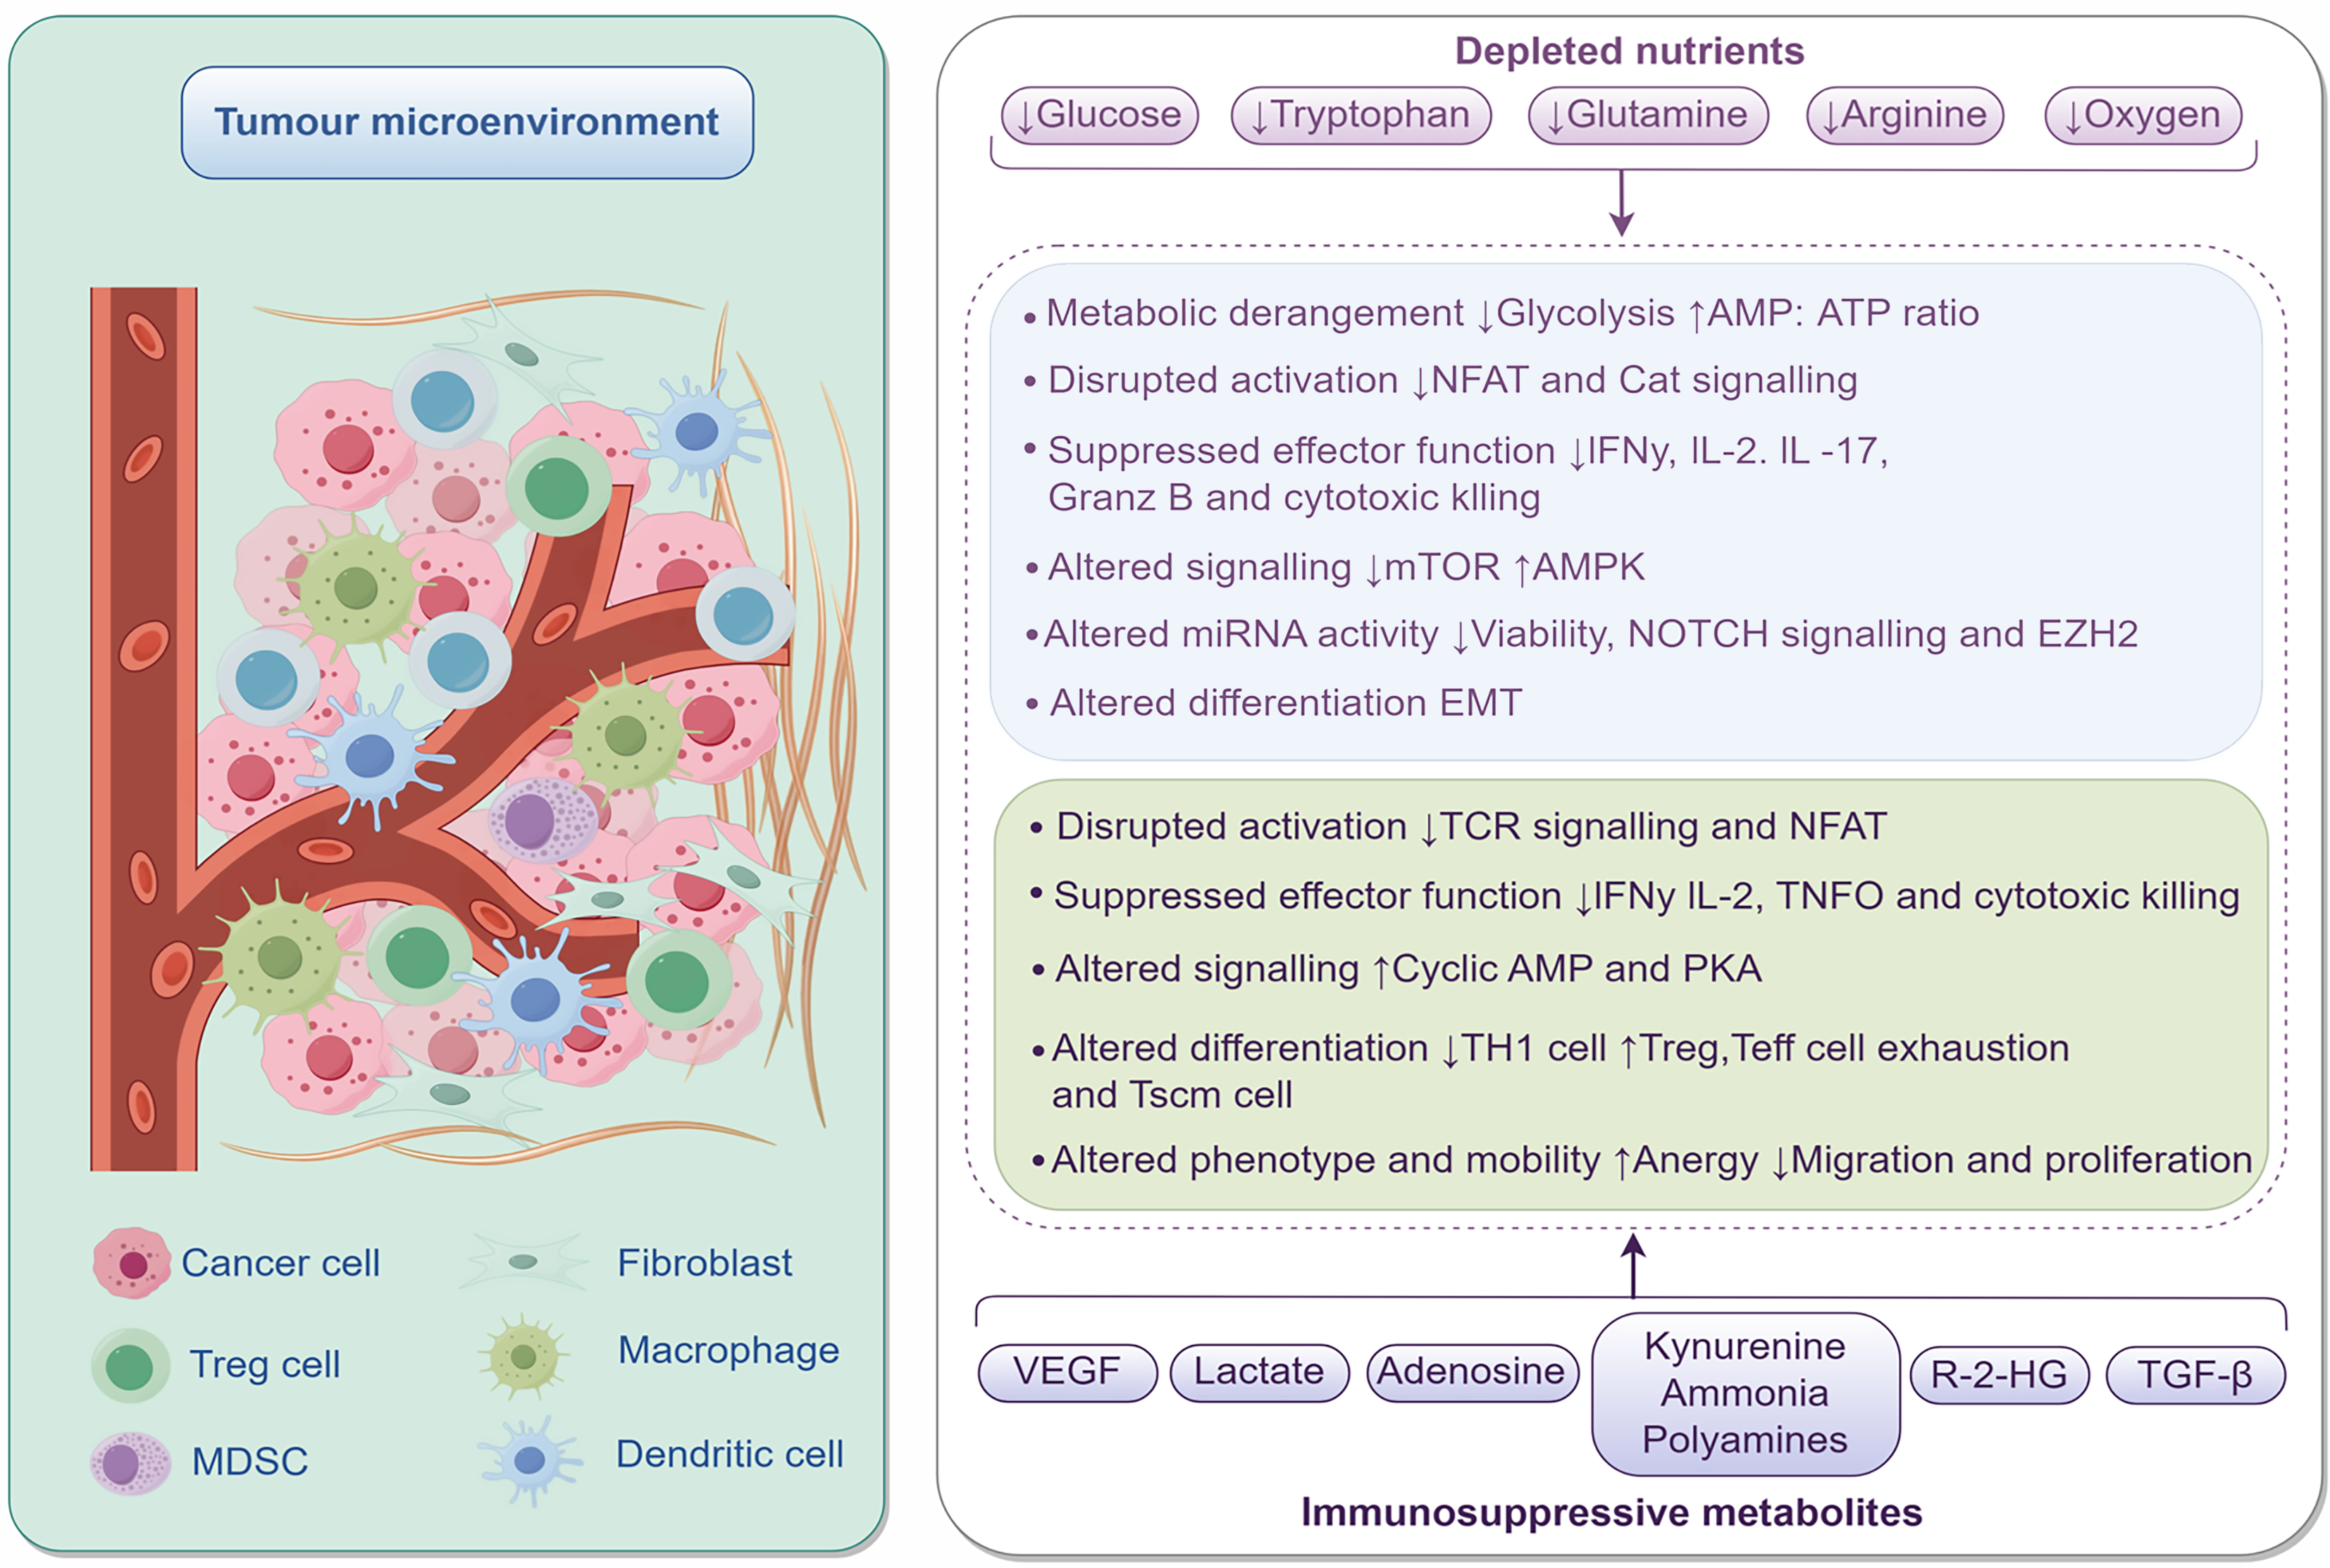
Figure 1 The tumor microenvironment.
Tumor microenvironment contains various cell types such as cancer cells, fibroblasts, Treg cells, macrophages, myeloid-derived suppressor cells, and dendritic cells. In the tumor microenvironment, nutrients like glucose and tryptophan are depleted, triggering a series of changes: Metabolically, glycolysis is inhibited and the adenosine monophosphate (AMP): Adenosine triphosphate ratio increases; Activation signaling pathways such as nuclear factor of activated T cells are disrupted; In terms of effector function, the secretion of interferon γ, interleukin-2, etc. and cytotoxic killing function are suppressed; Signaling pathways including mammalian target of rapamycin, adenosine 5’-monophosphate-activated protein kinase, as well as the cyclic AMP and protein kinase A system pathways are altered; Micro-RNA activity affects cell viability, etc.; Cell differentiation shows changes like epithelial-mesenchymal transition; Phenotype and migration exhibit alterations such as anergy. Meanwhile, immunosuppressive metabolites such as vascular endothelial growth factor and lactate are present in the tumor microenvironment. MDSC: Myeloid-derived suppressor cells; AMP: Adenosine monophosphate; ATP: Adenosine triphosphate; NFAT: Nuclear factor of activated T cells; IFN: Interferon; IL: Interleukin; mTOR: Mammalian target of rapamycin; AMPK: Adenosine 5’-monophosphate-activated protein kinase; EMT: Epithelial-mesenchymal transition; TCR: T cell receptor; PKA: Protein kinase A system; VEGF: Vascular endothelial growth factor; TGF: Transforming growth factor.
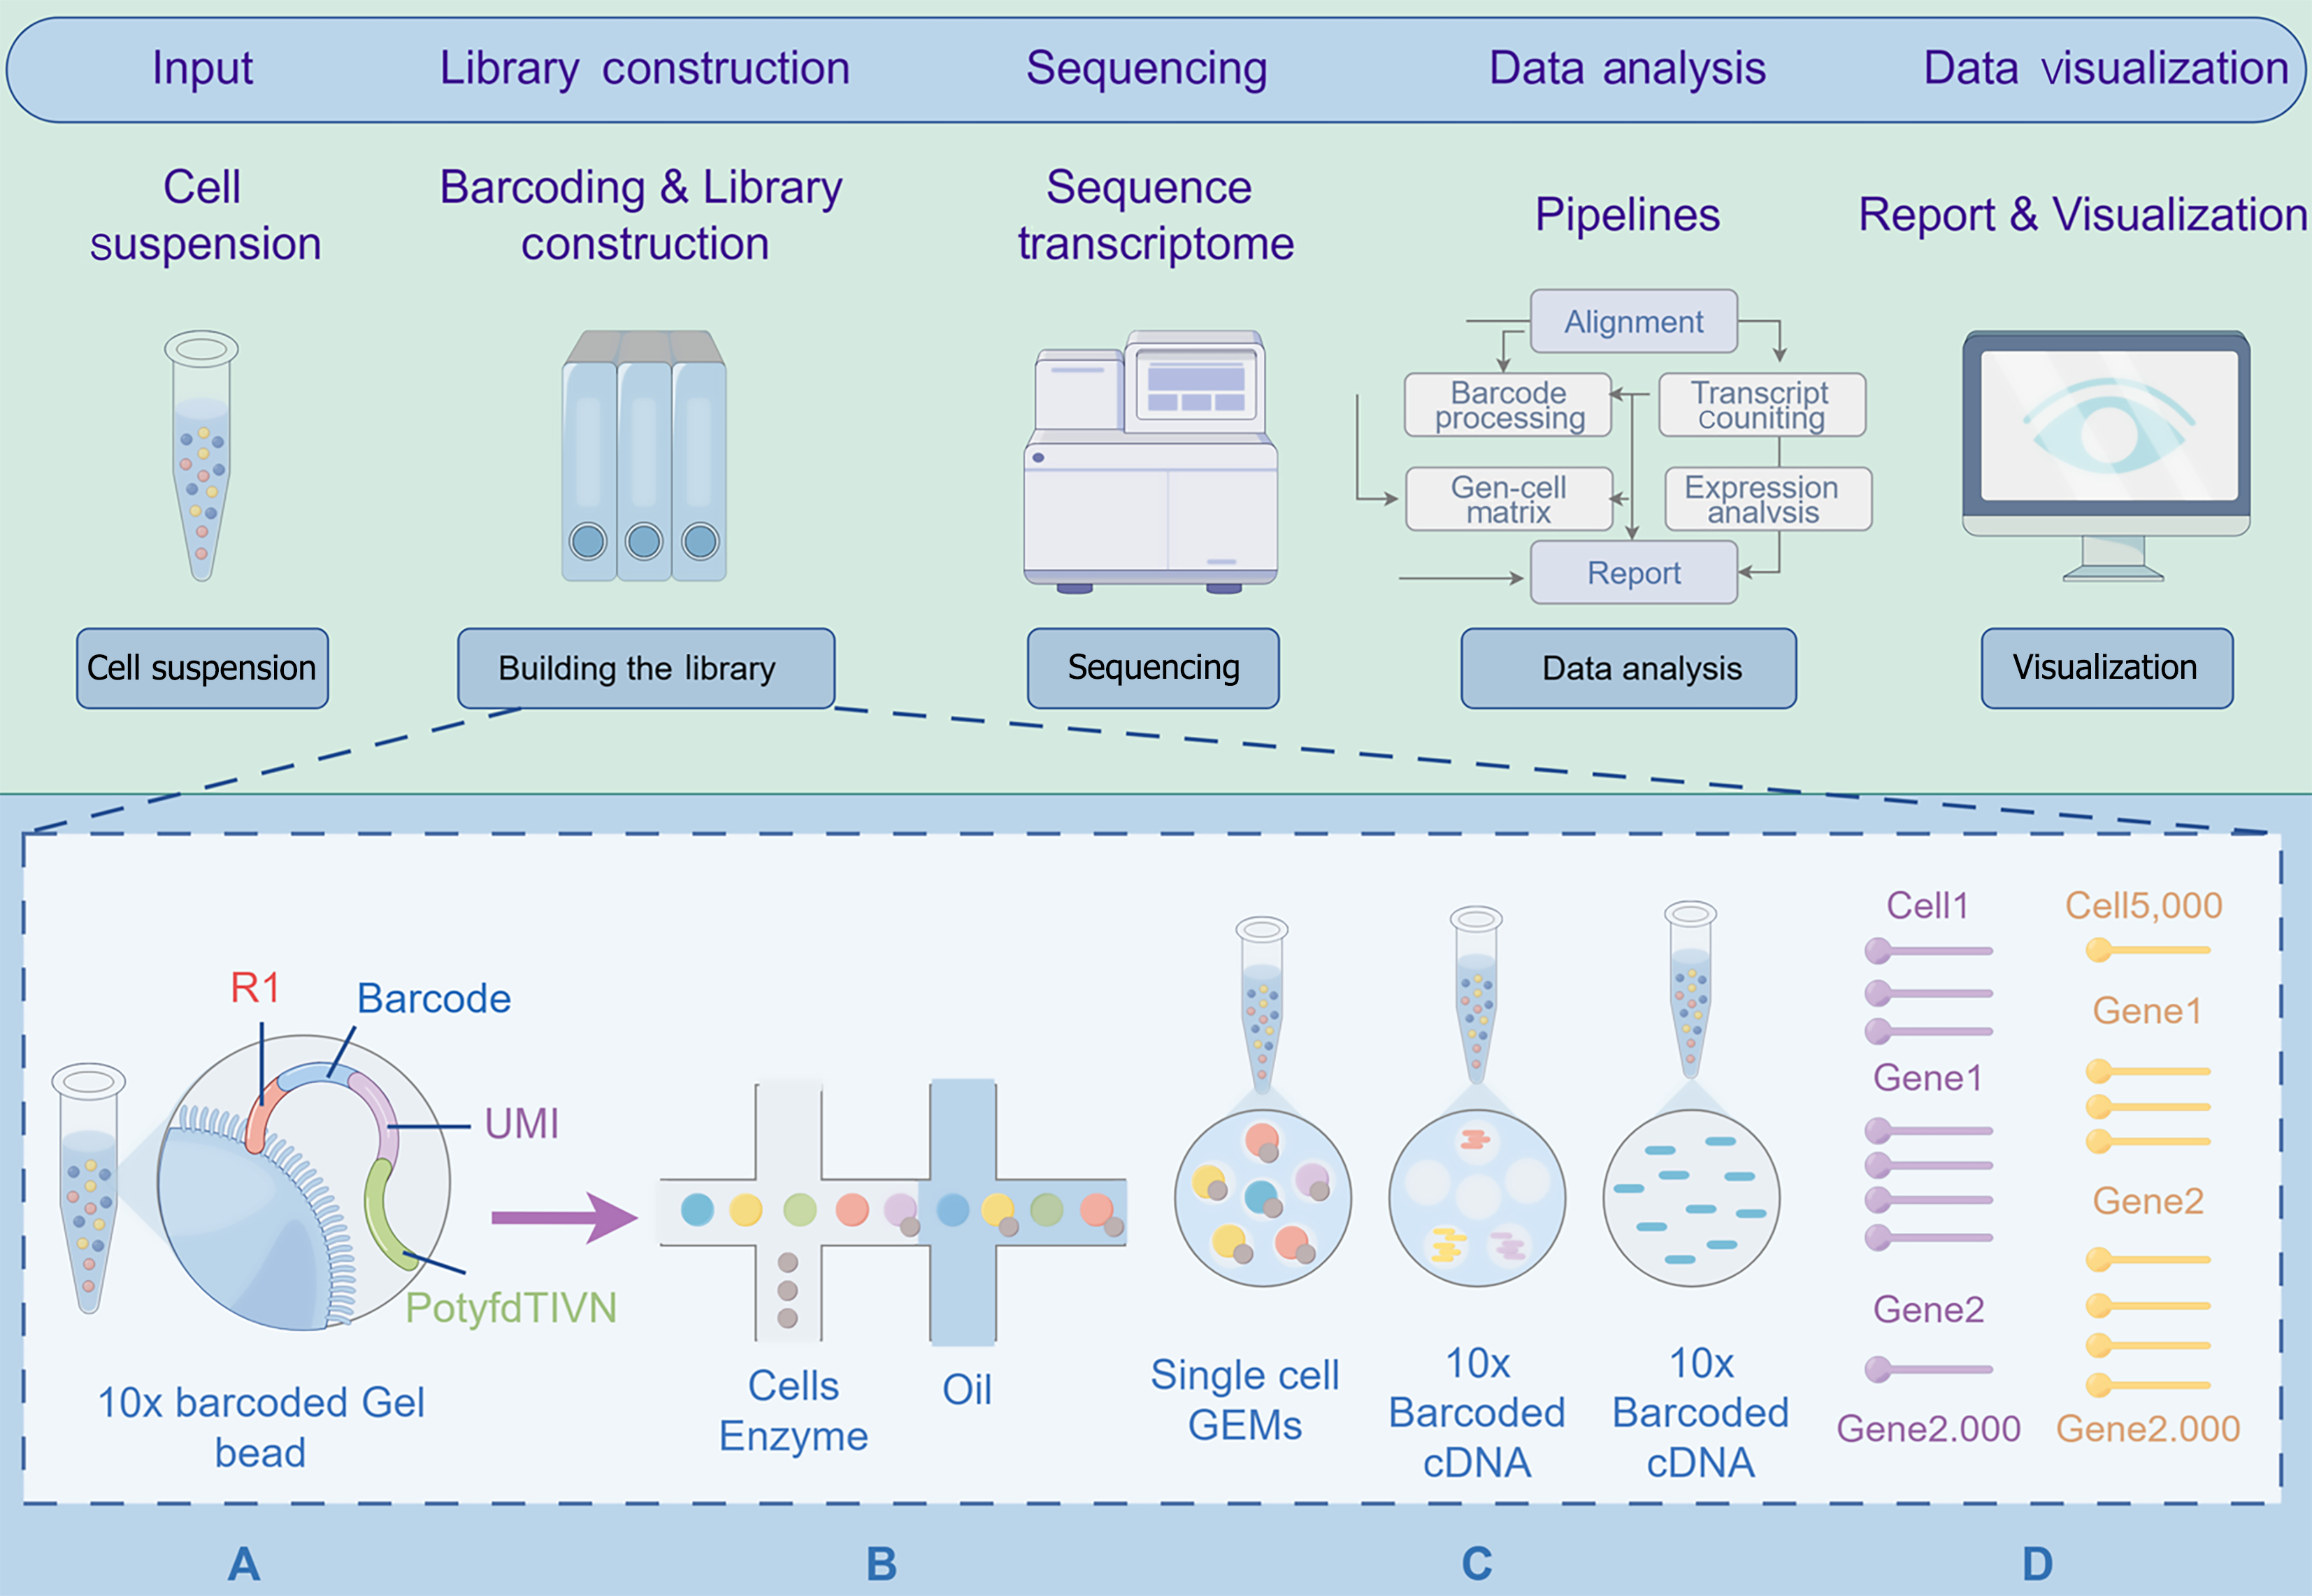
Figure 2 The workflow diagram of single cell RNA sequencing.
Starting with cell suspension as the input, in library construction, 10 × barcoded gel beads with barcode and unique molecular identifier sequences are used, mixed with cells, enzymes, and oil to form single cell gel bead-in-emulsion and generate 10 × Barcoded complementary DNA. Then, the transcriptome is sequenced. Subsequently, in data analysis, bioinformatics pipelines like alignment, barcode processing, etc., are employed to generate a report. Finally, in data visualization, the analyzed data is presented graphically via computer software for easier interpretation of biological meaning. UMI: Unique molecular identifier; cDNA: Complementary DNA; GEMs: Gel bead-in-emulsion.
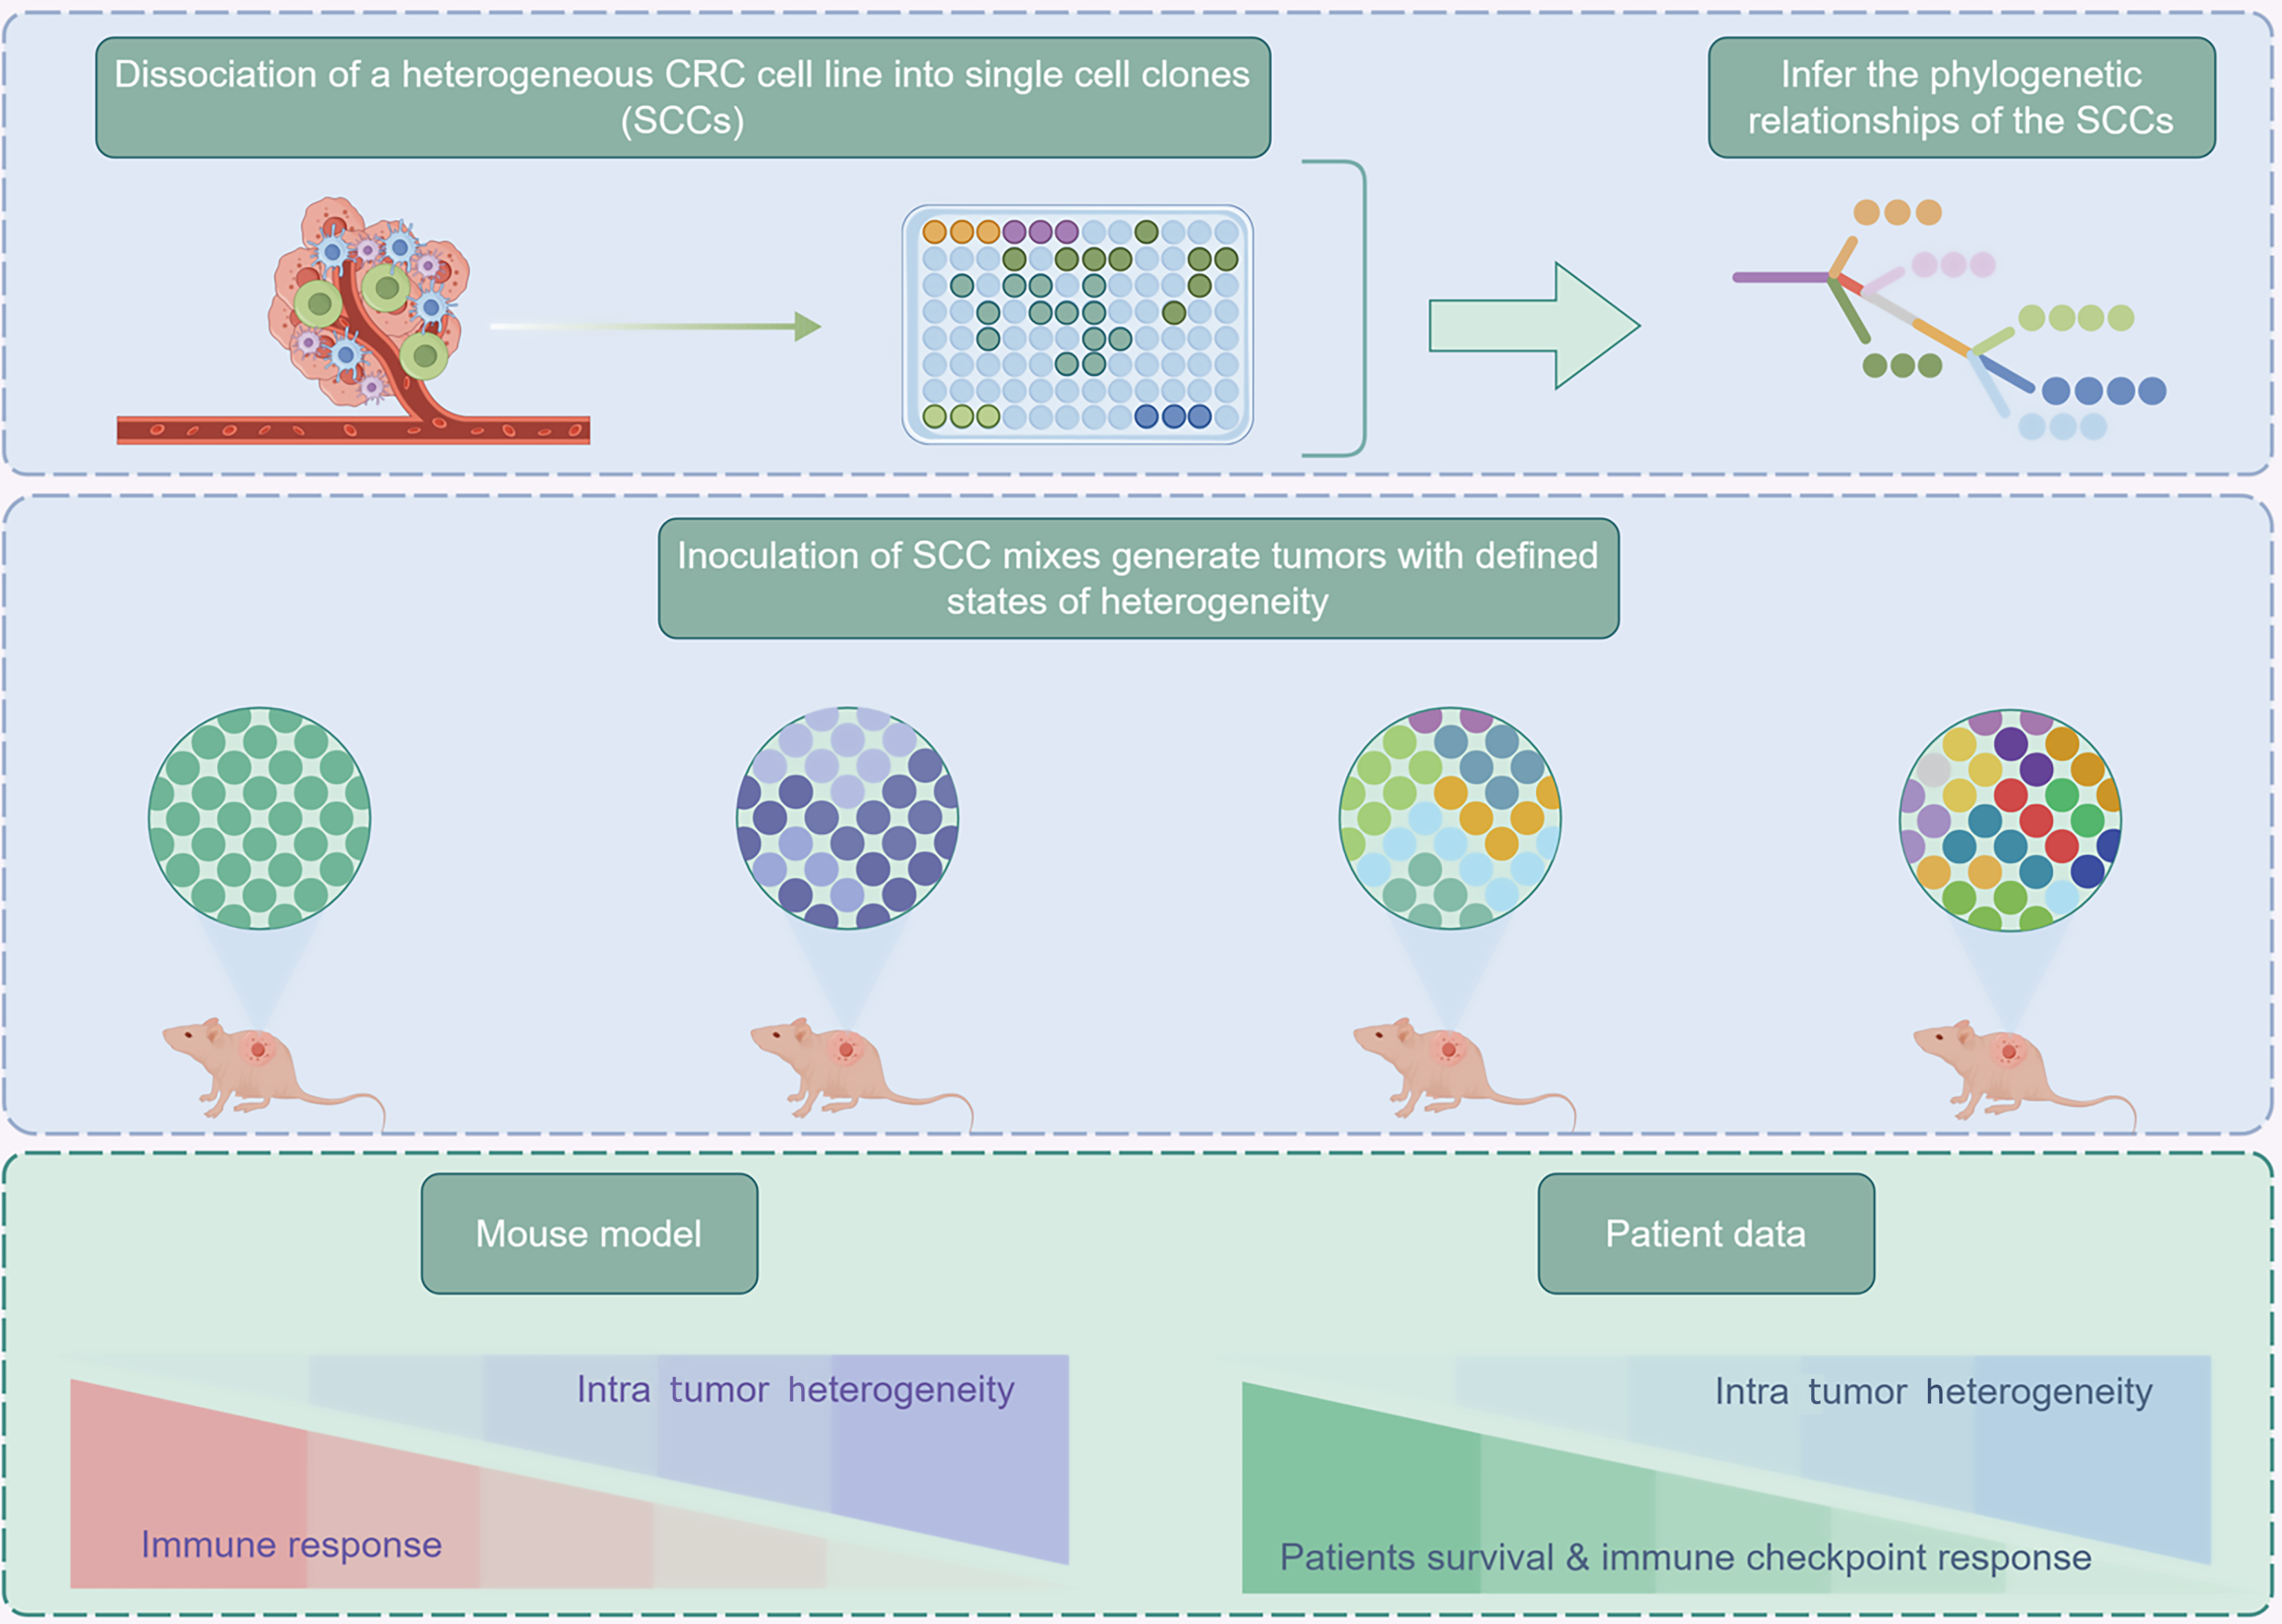
Figure 3 Experimental procedures and association analysis for the study of intra-tumor heterogeneity in colorectal cancer.
Firstly, a heterogeneous colorectal cancer (CRC) cell line is dissociated into single cell clones (SCCs), and their phylogenetic relationships are inferred. Subsequently, different SCC mixtures are inoculated into mice, and the mouse model is used to study the association between intra tumor heterogeneity and the immune response. Meanwhile, by integrating patient data, the relationships between intra tumor heterogeneity, patient survival, and immune checkpoint response are analyzed, aiming to comprehensively explore the mechanisms of intra tumor heterogeneity in CRC. CRC: Colorectal cancer; SCC: Single cell clone.
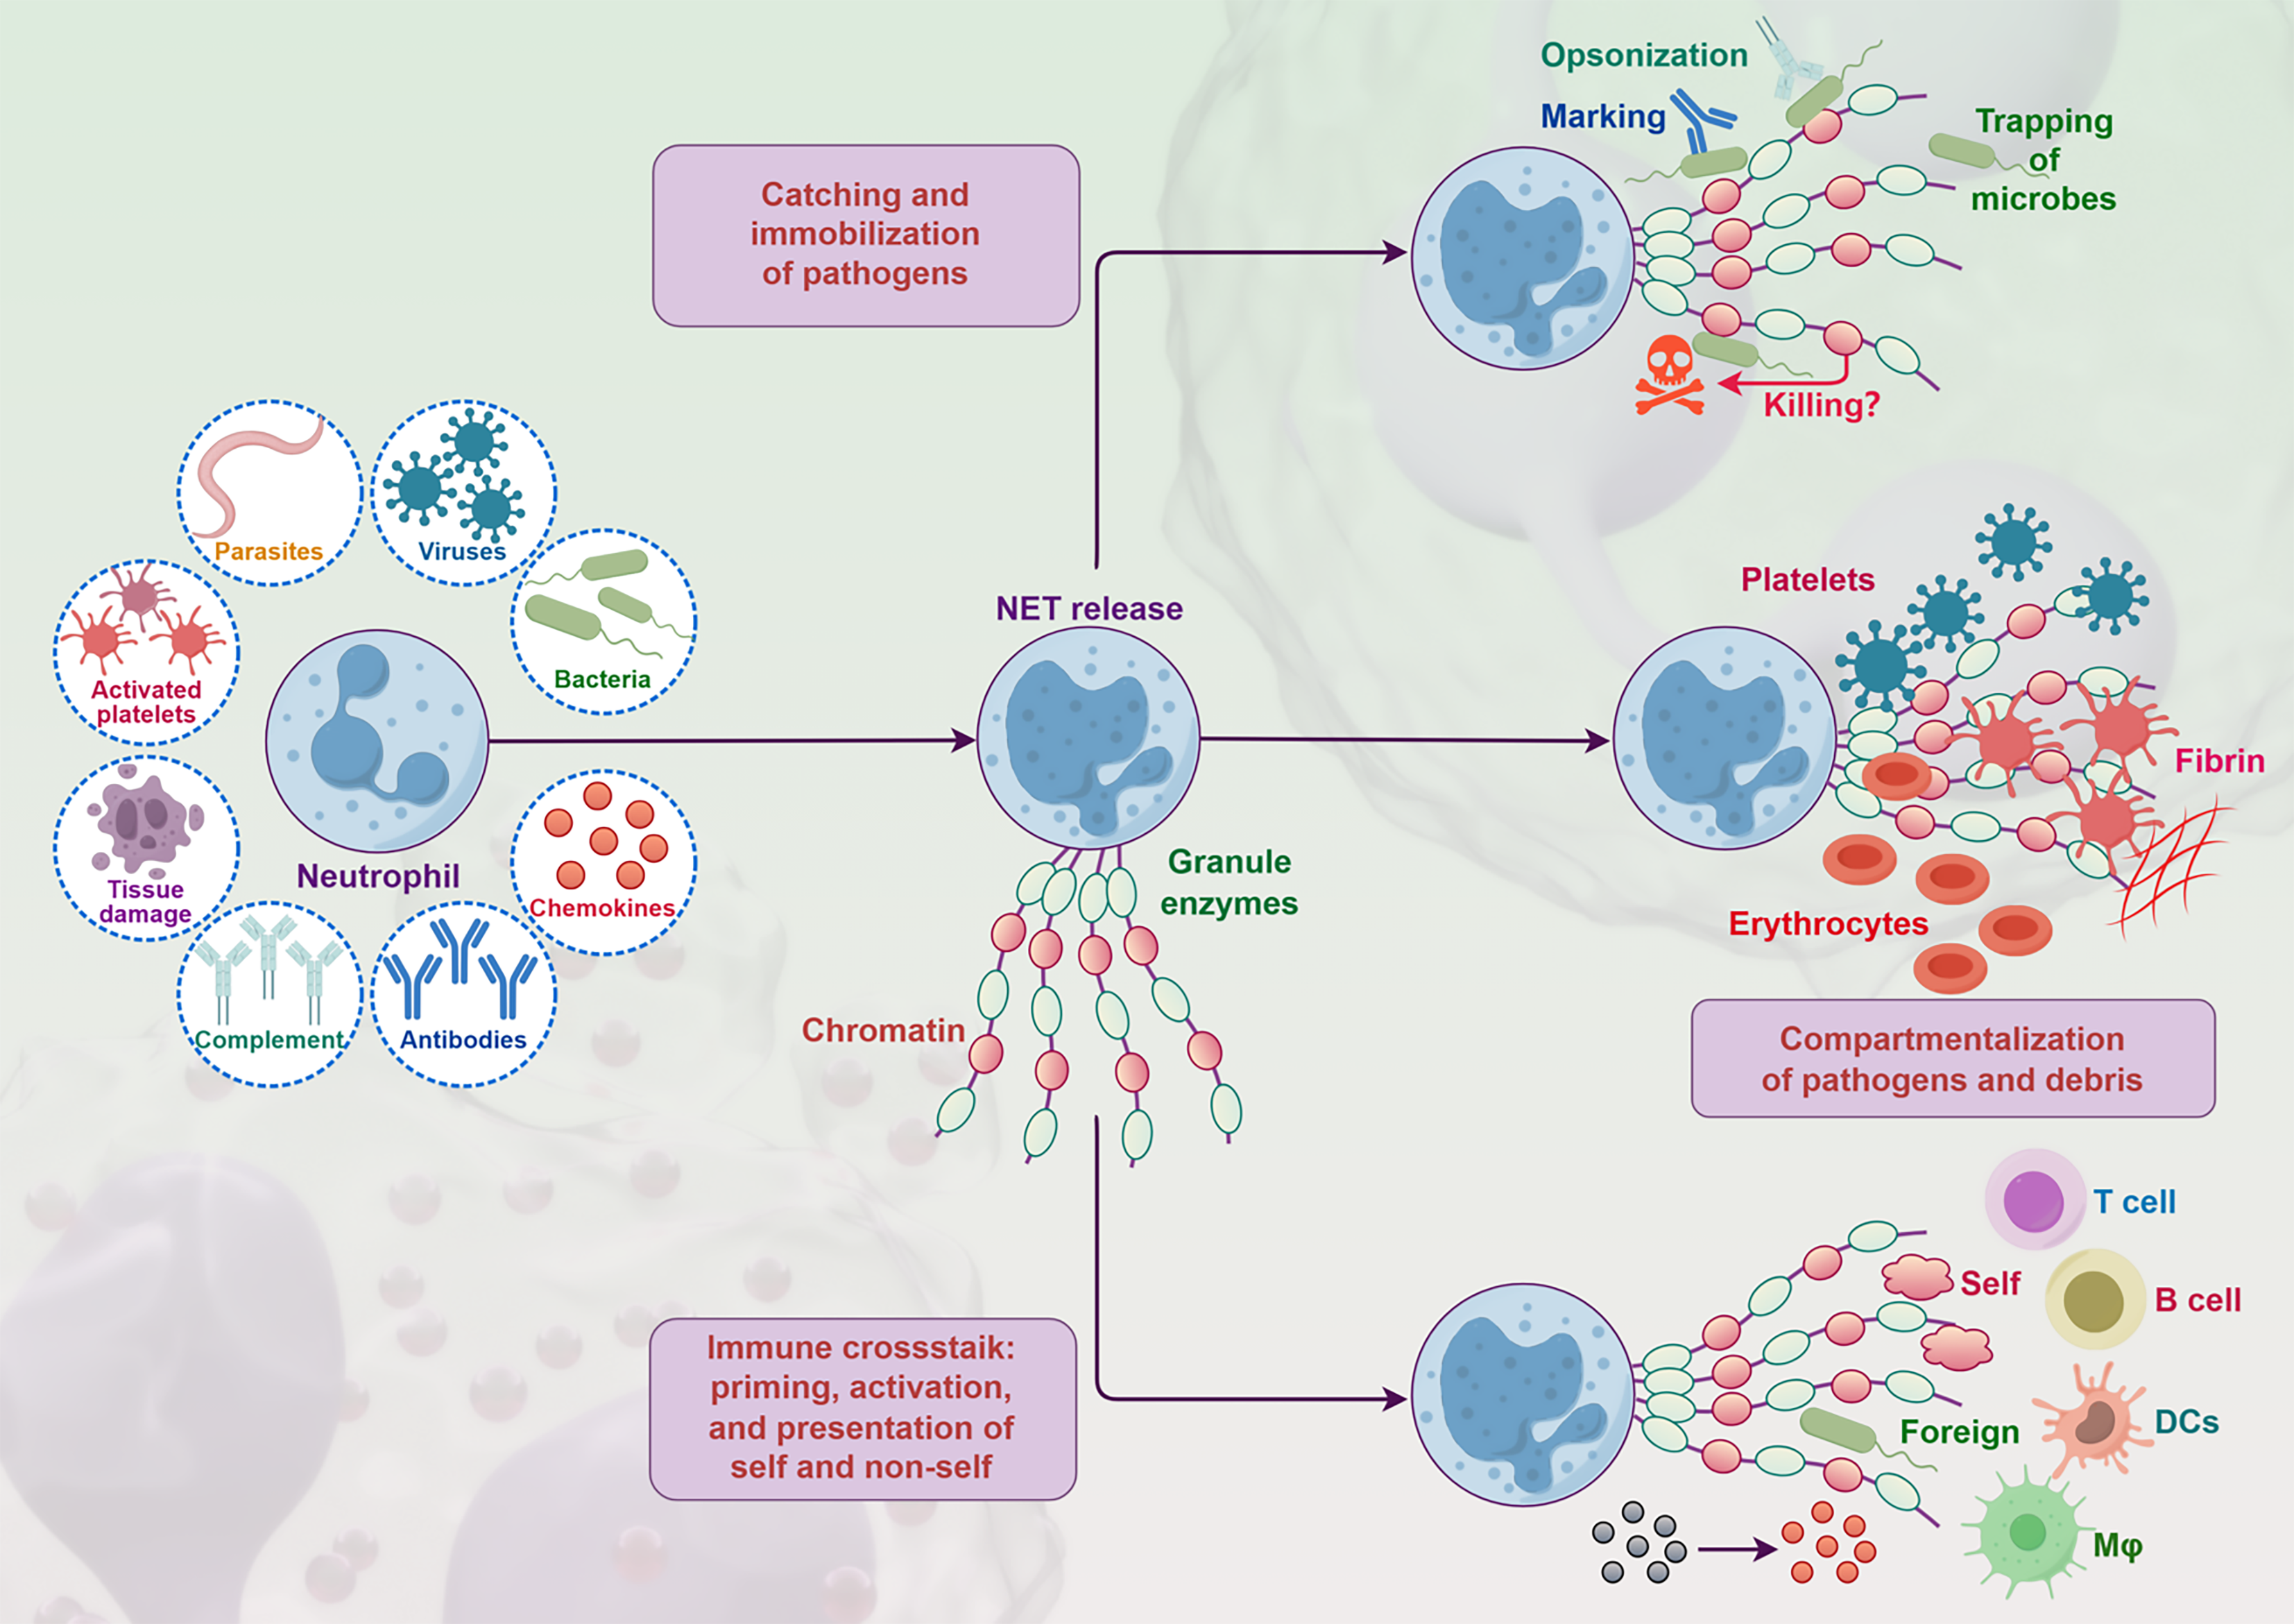
Figure 4 Neutrophil extracellular traps formation process and roles.
When stimulated by pathogens such as parasites, viruses, and bacteria, as well as activated platelets, tissue damage, and immune related substances like chemokines, complement, and antibodies, neutrophils release neutrophil extracellular traps (NETs) composed of chromatin and granule enzymes. The formed NETs can catch and immobilize pathogens. Through opsonization, they assist in the recognition and trapping of microbes. They can also compartmentalize pathogens and debris to limit their spread, and participate in immune crosstalk, priming, activating, and presenting self and non self antigens, involving various immune cells. DC: Dendritic cell.
- Citation: Xu ZX, Qu FY, Zhang Z, Luan WY, Lin SX, Miao YD. Exploring the role of neutrophil extracellular traps in colorectal cancer: Insights from single-cell sequencing. World J Gastrointest Oncol 2025; 17(7): 107589
- URL: https://www.wjgnet.com/1948-5204/full/v17/i7/107589.htm
- DOI: https://dx.doi.org/10.4251/wjgo.v17.i7.107589


