Copyright
©The Author(s) 2025.
World J Gastrointest Oncol. Jul 15, 2025; 17(7): 105981
Published online Jul 15, 2025. doi: 10.4251/wjgo.v17.i7.105981
Published online Jul 15, 2025. doi: 10.4251/wjgo.v17.i7.105981
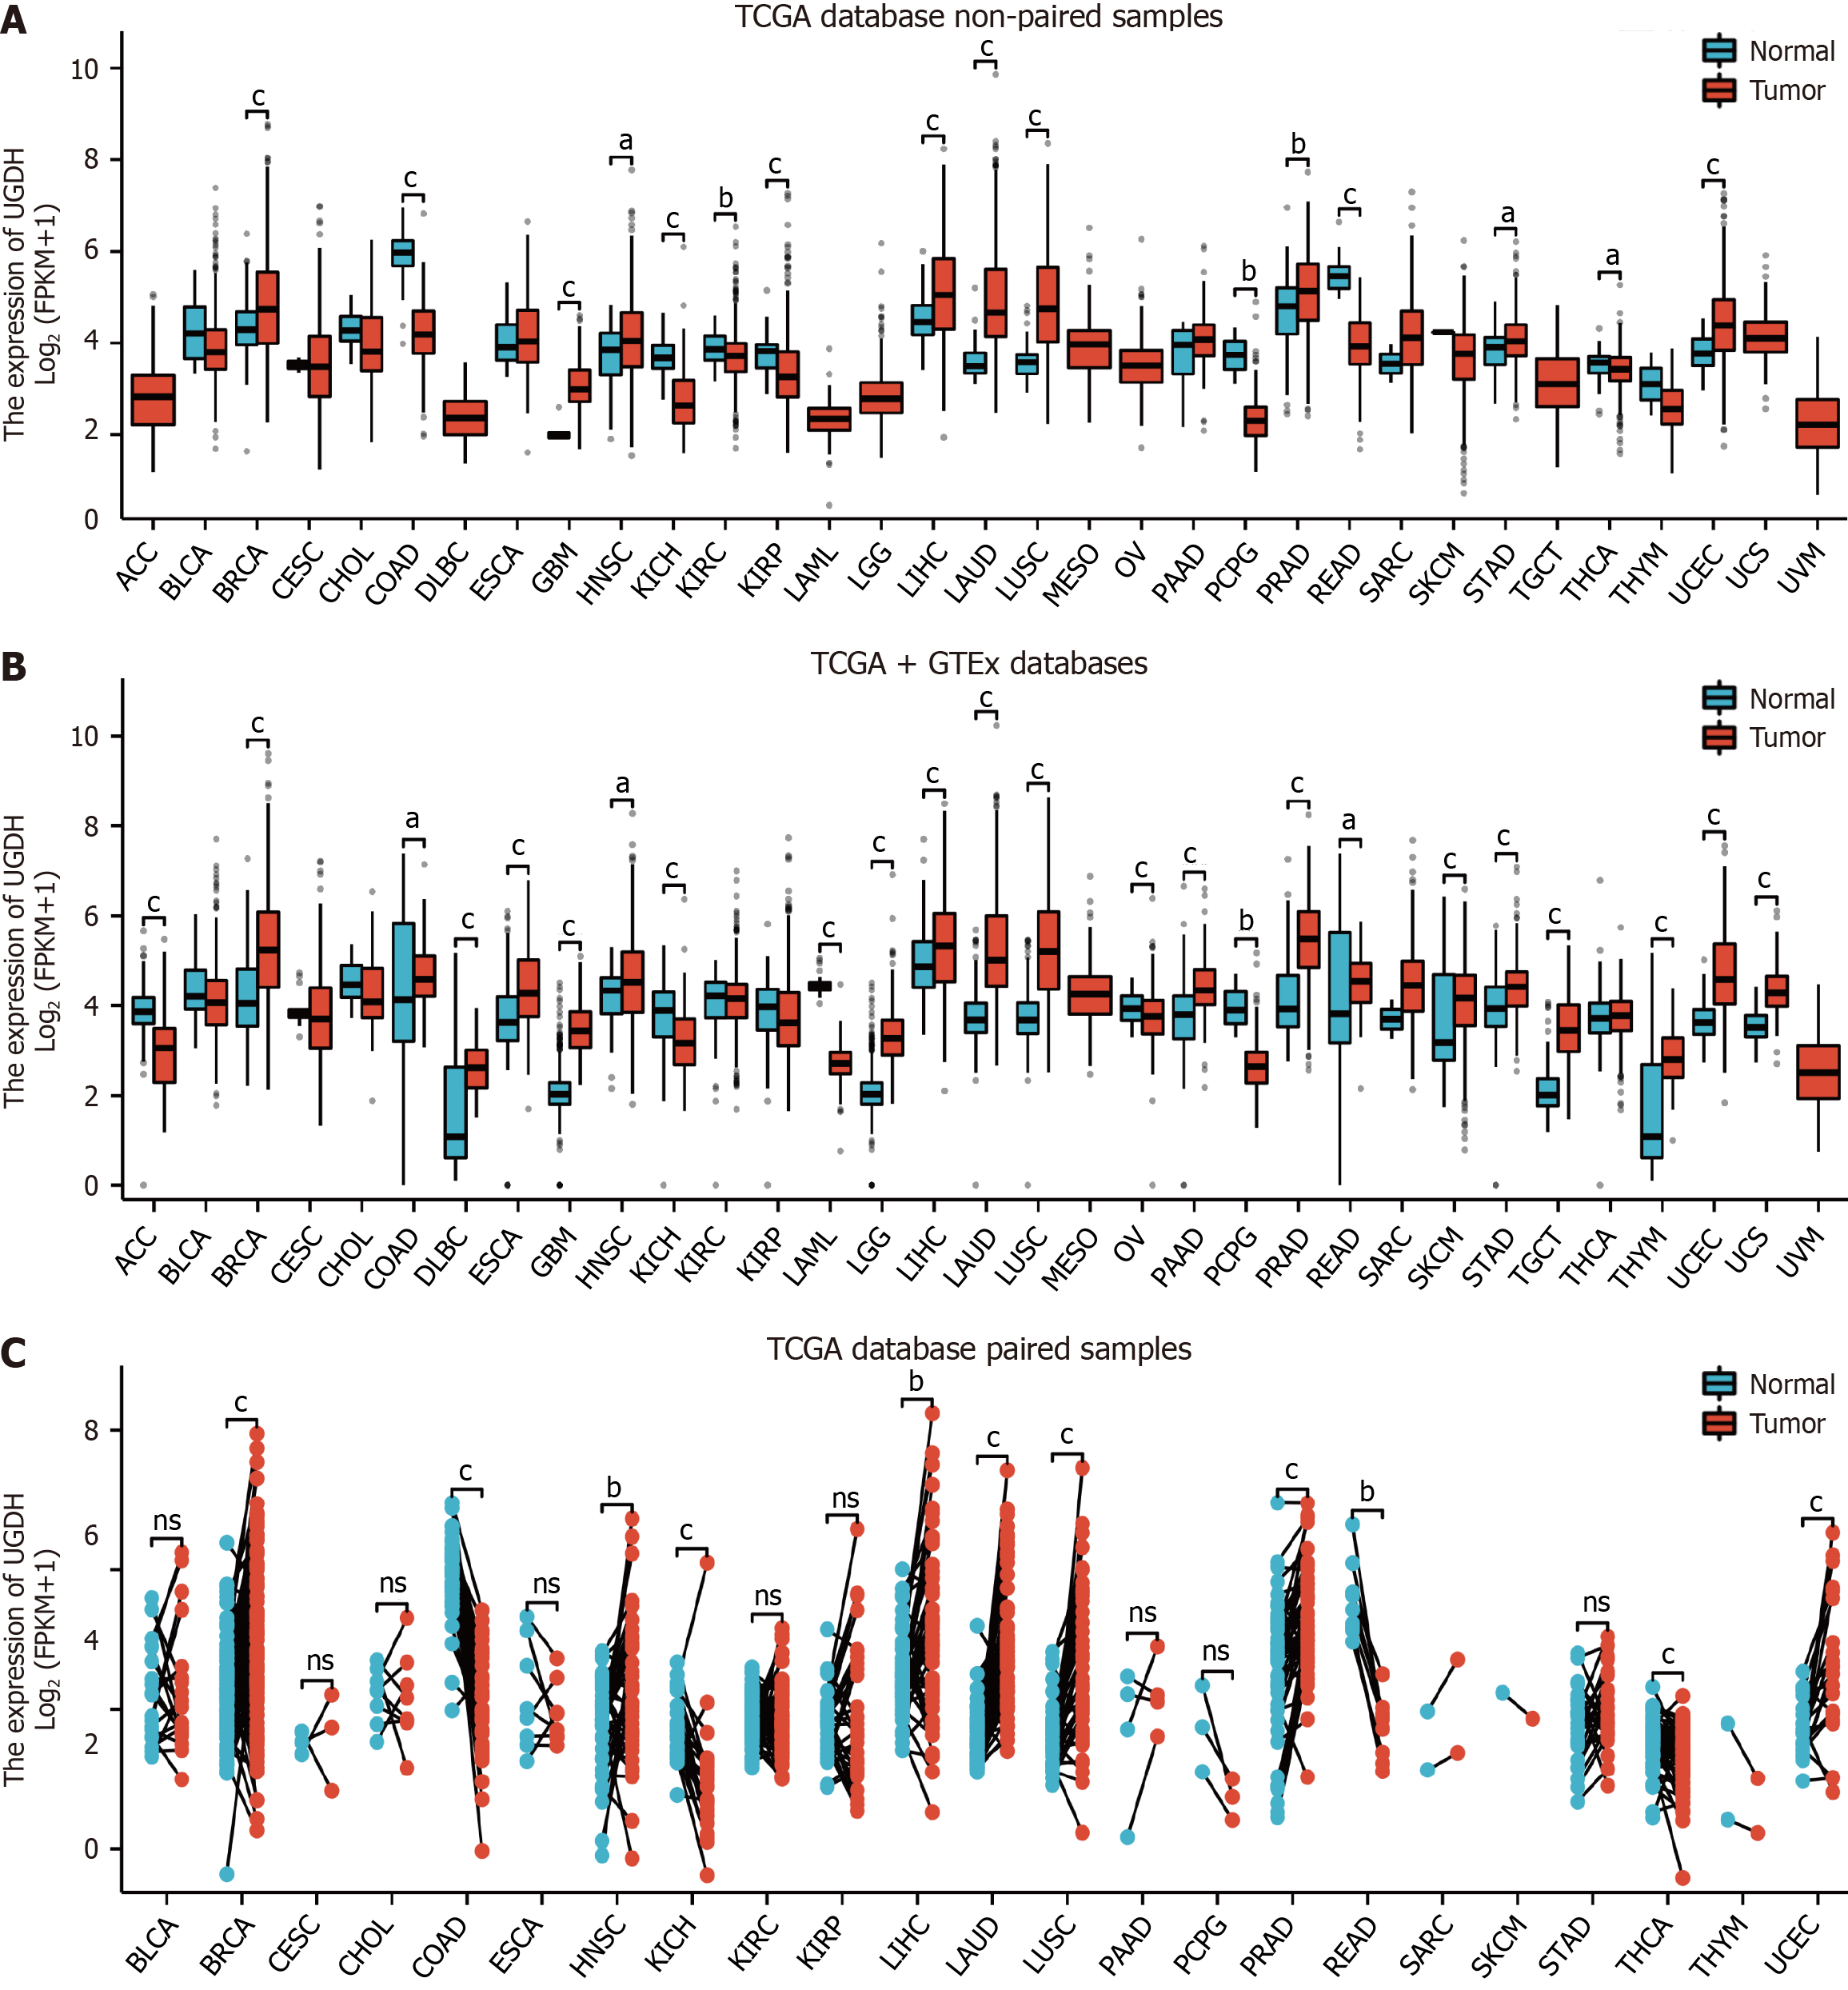
Figure 1 UDP-glucose 6-dehydrogenase mRNA expression across cancers.
A: Comparison of UDP-glucose 6-dehydrogenase (UGDH) expression between cancer and normal tissues via unpaired sample analysis; B: Comparison of UGDH expression between cancer and normal tissues via unpaired sample analysis; C: Paired sample analysis of UGDH mRNA expression between cancer and paracancerous tissues. aP < 0.05, bP < 0.01, cP < 0.001.
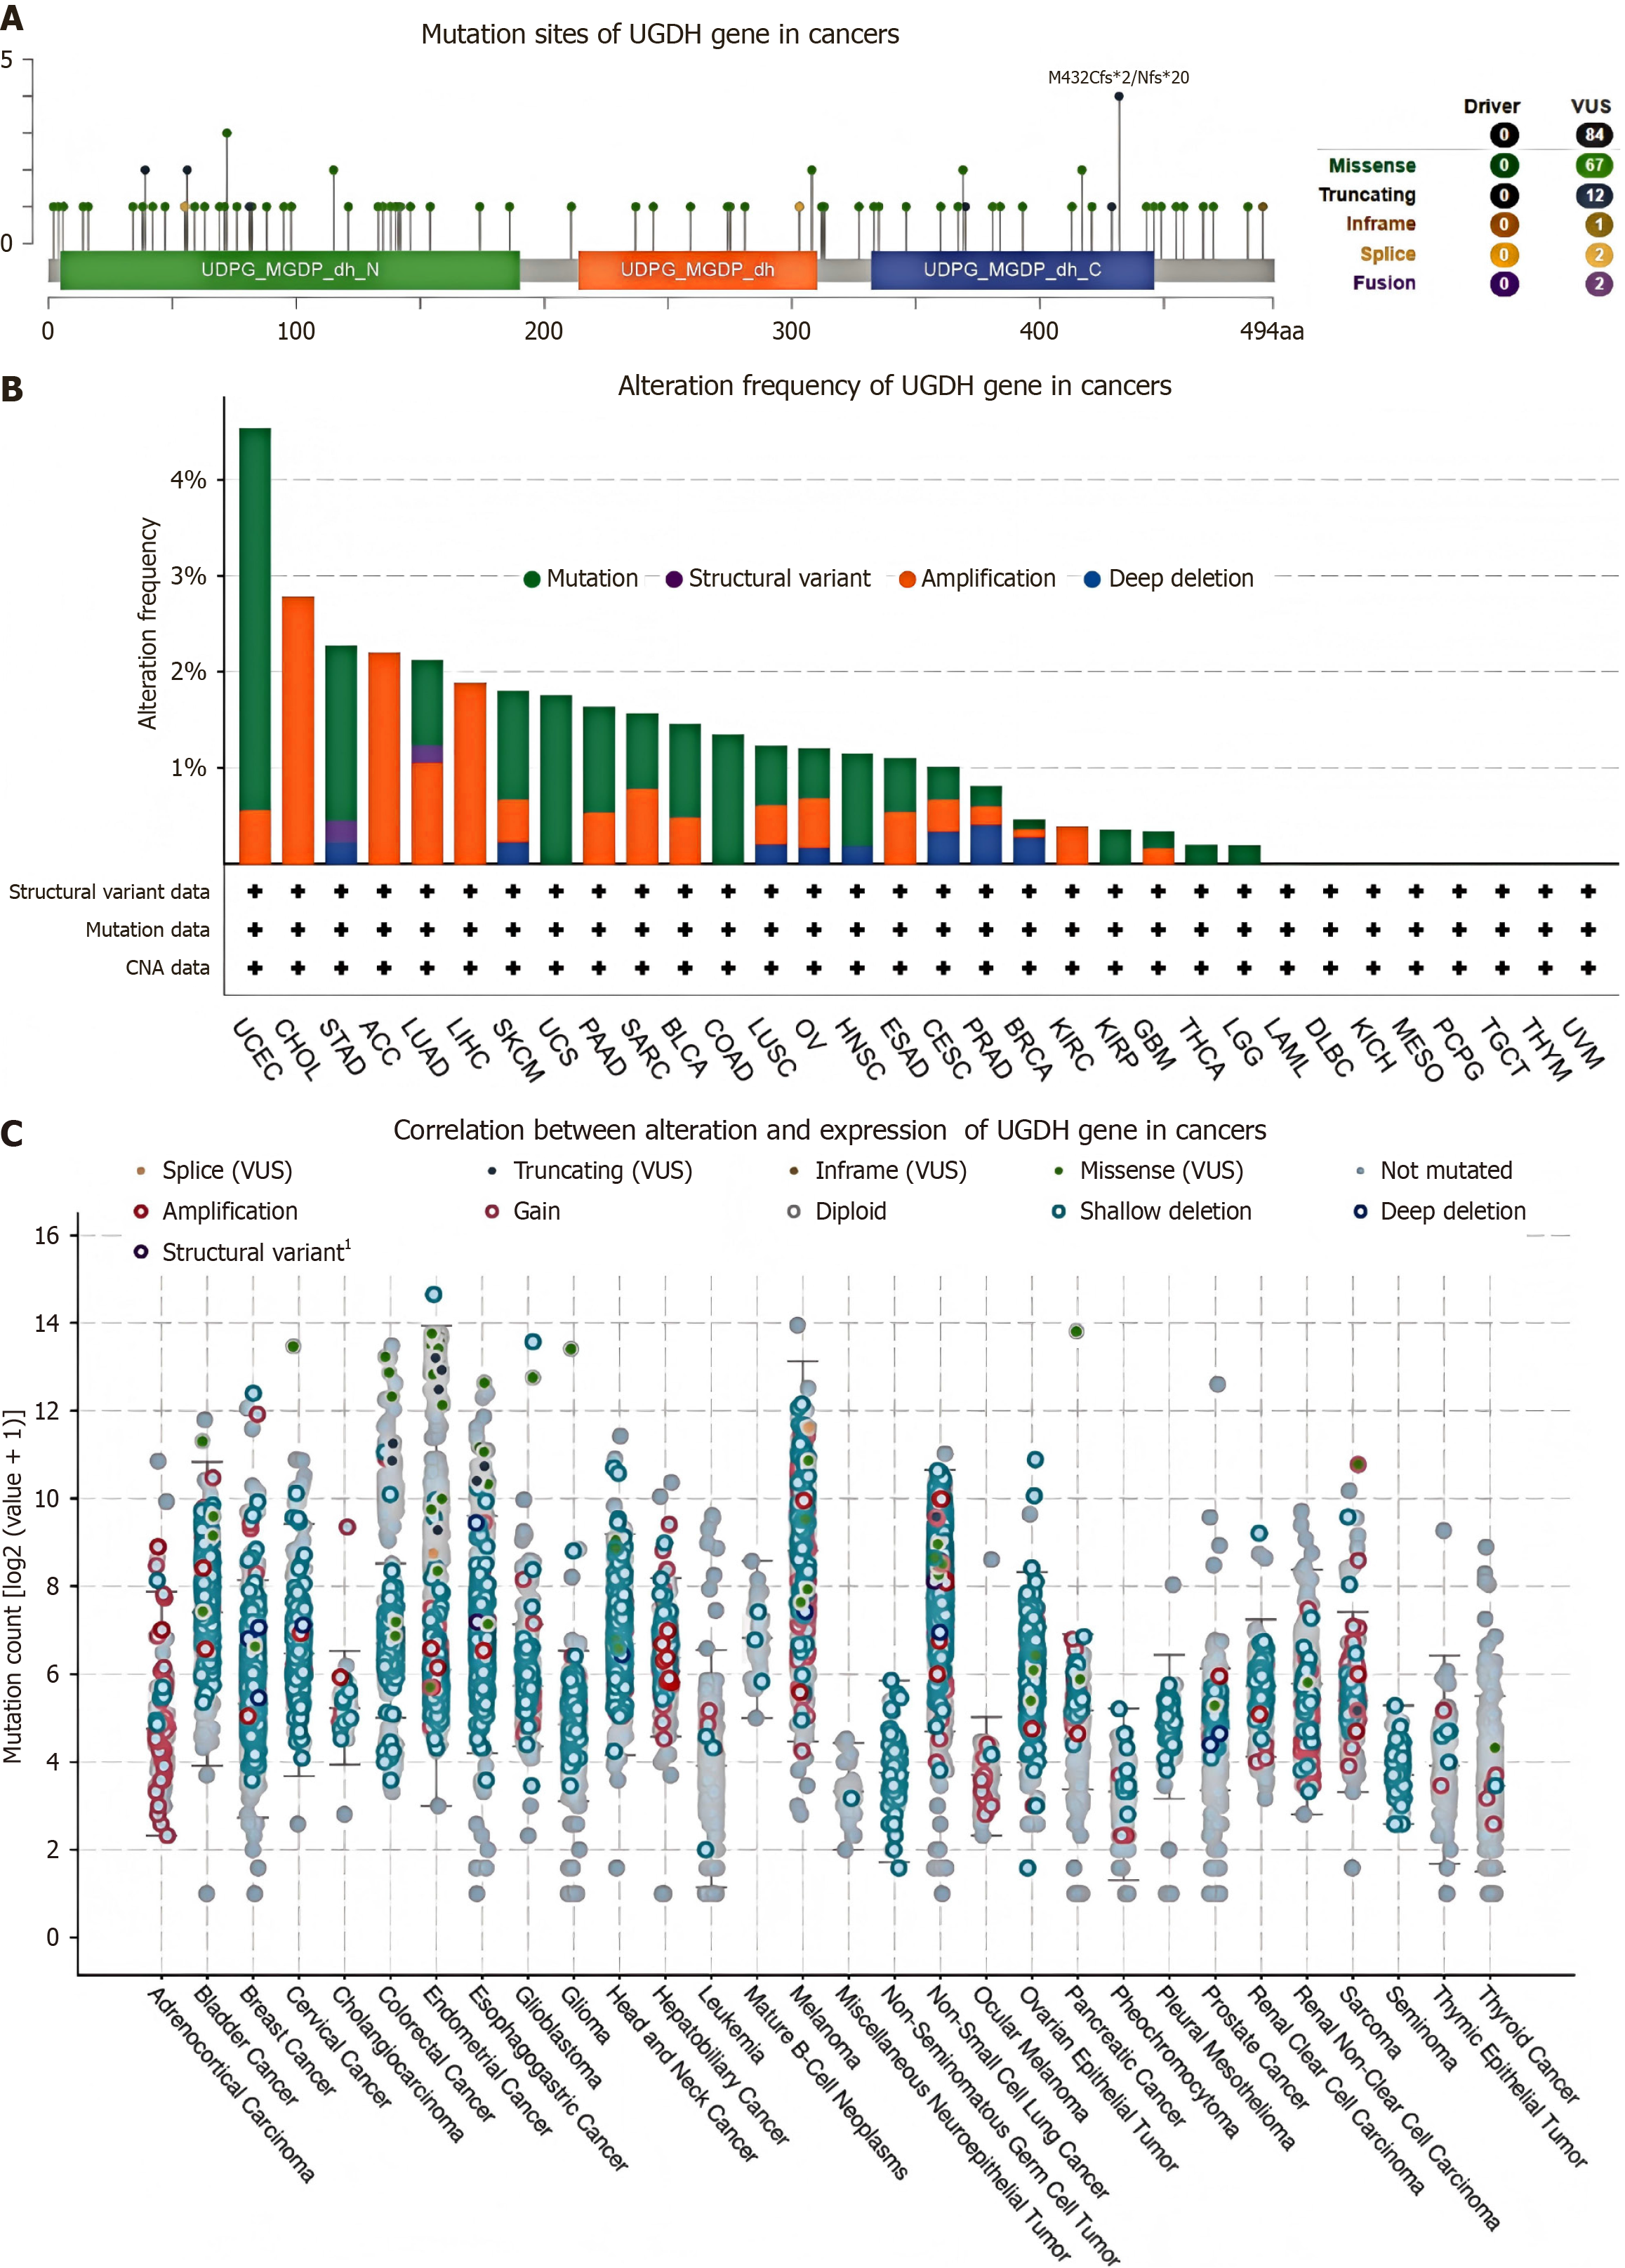
Figure 2 Genetic alterations of UDP-glucose 6-dehydrogenase across cancers.
A: Mutation diagram of UDP-glucose 6-dehydrogenase (UGDH) across protein domains; B: Bar chart of UGDH mutations in cancers; C: Mutation counts and types of UGDH in cancers. UGDH: UDP-glucose 6-dehydrogenase.
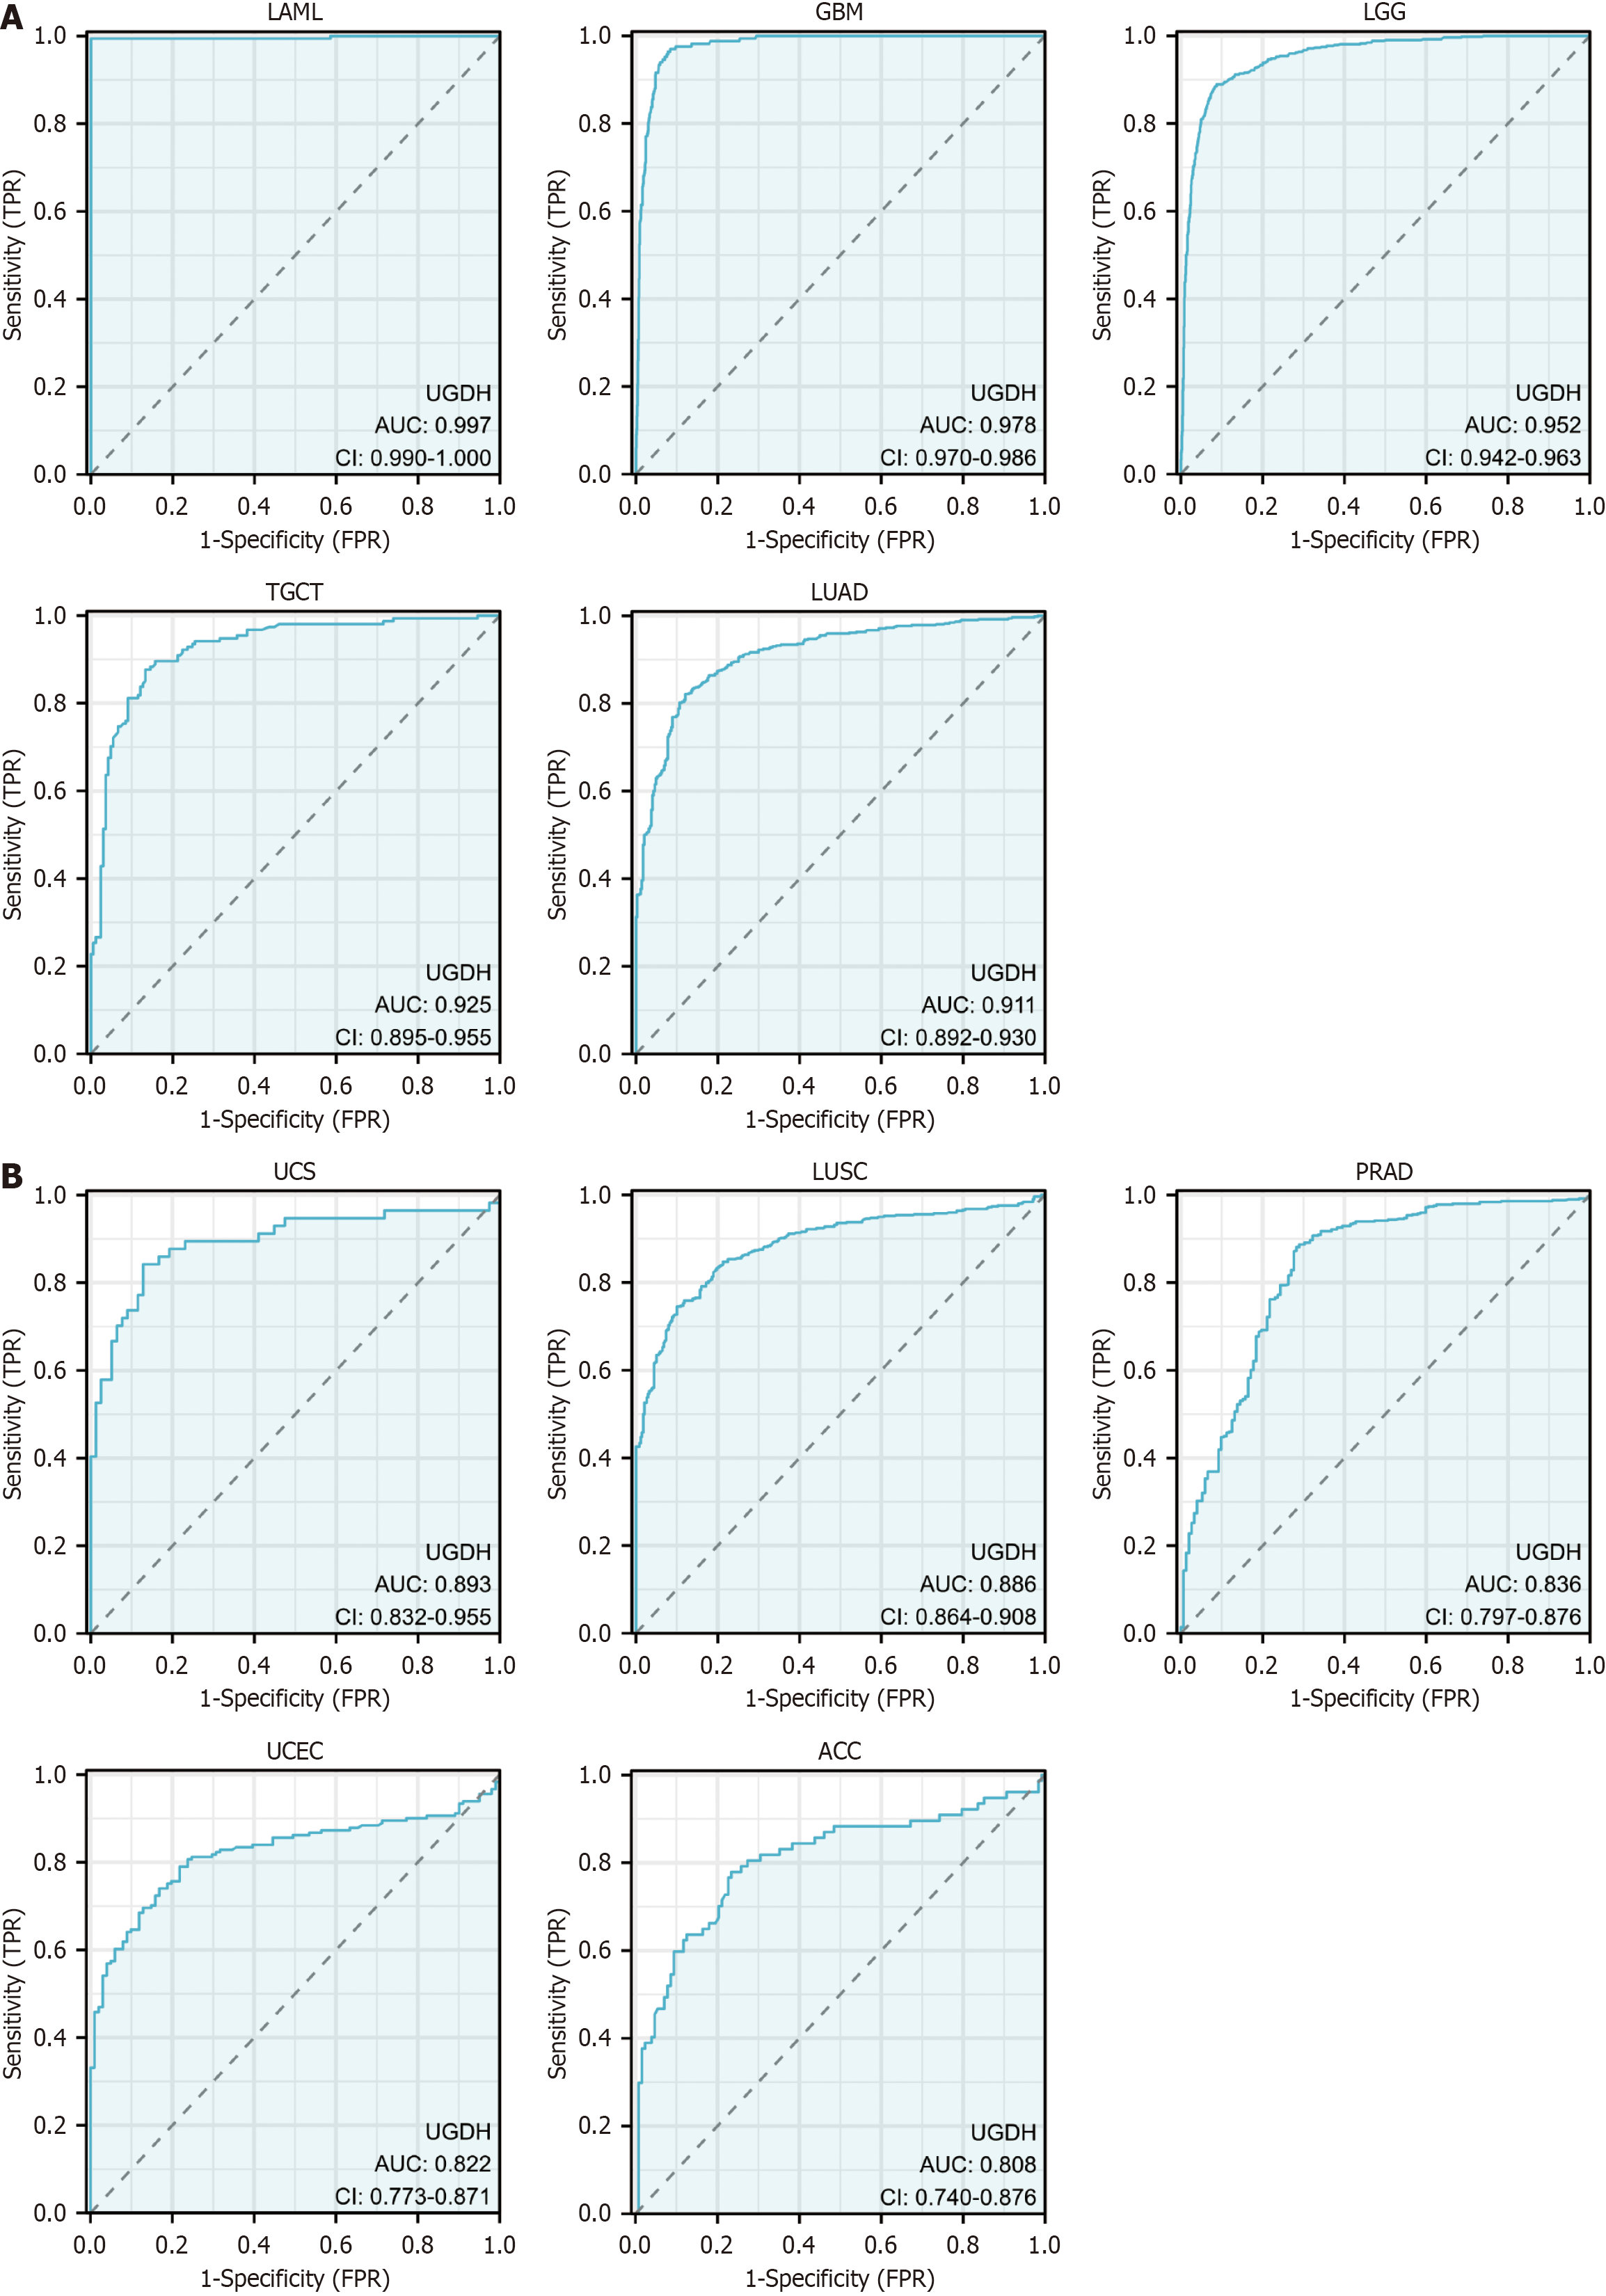
Figure 3 Receiver operating characteristic curves of UDP-glucose 6-dehydrogenase in cancers.
A: Receiver operating characteristic (ROC) curves of UDP-glucose 6-dehydrogenase (UGDH) in five cancers with an area under the curve (AUC) > 0.9; B: ROC curves of UGDH in five cancers with 0.8 < AUC < 0.9.
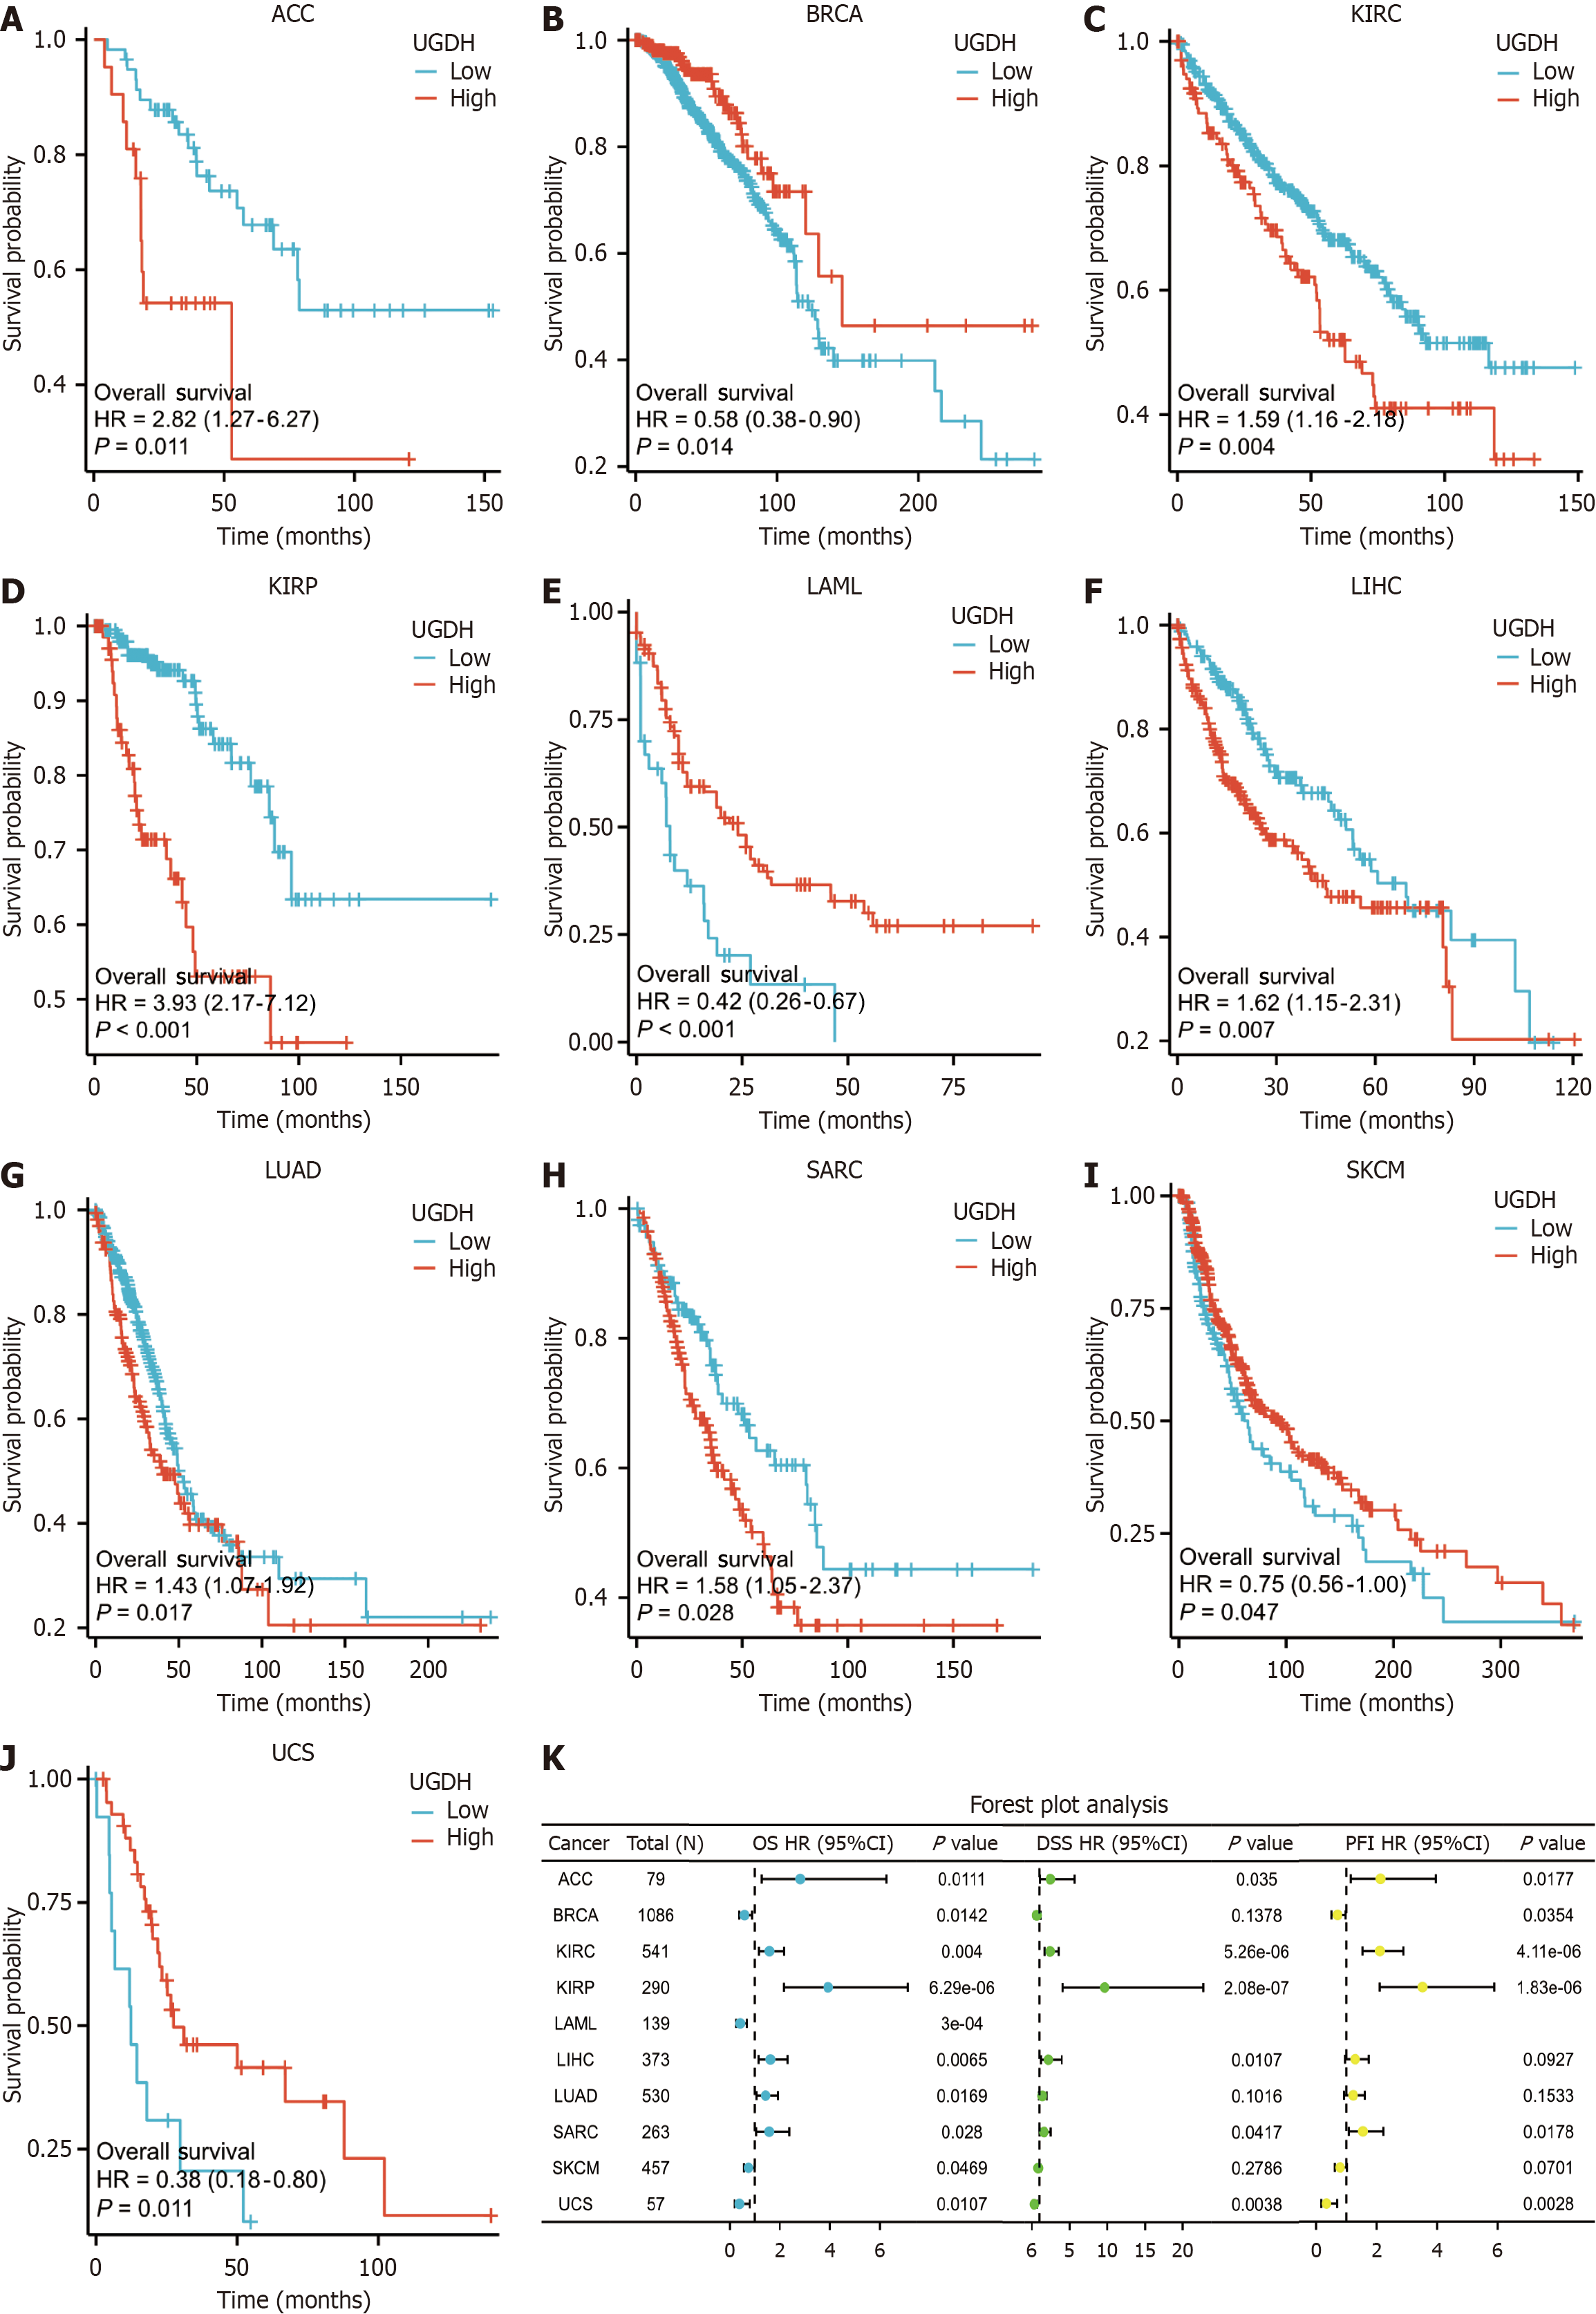
Figure 4 Correlations between UDP-glucose 6-dehydrogenase and prognosis across cancers.
A-J: Overall survival (OS) analysis of UDP-glucose 6-dehydrogenase (UGDH) expression in ten cancers; K: Forest plot of the ability of UGDH to predict OS, disease-specific survival, and progression-free interval in ten cancers. The unit of the X-axis in the Kaplan-Meier curve is months.
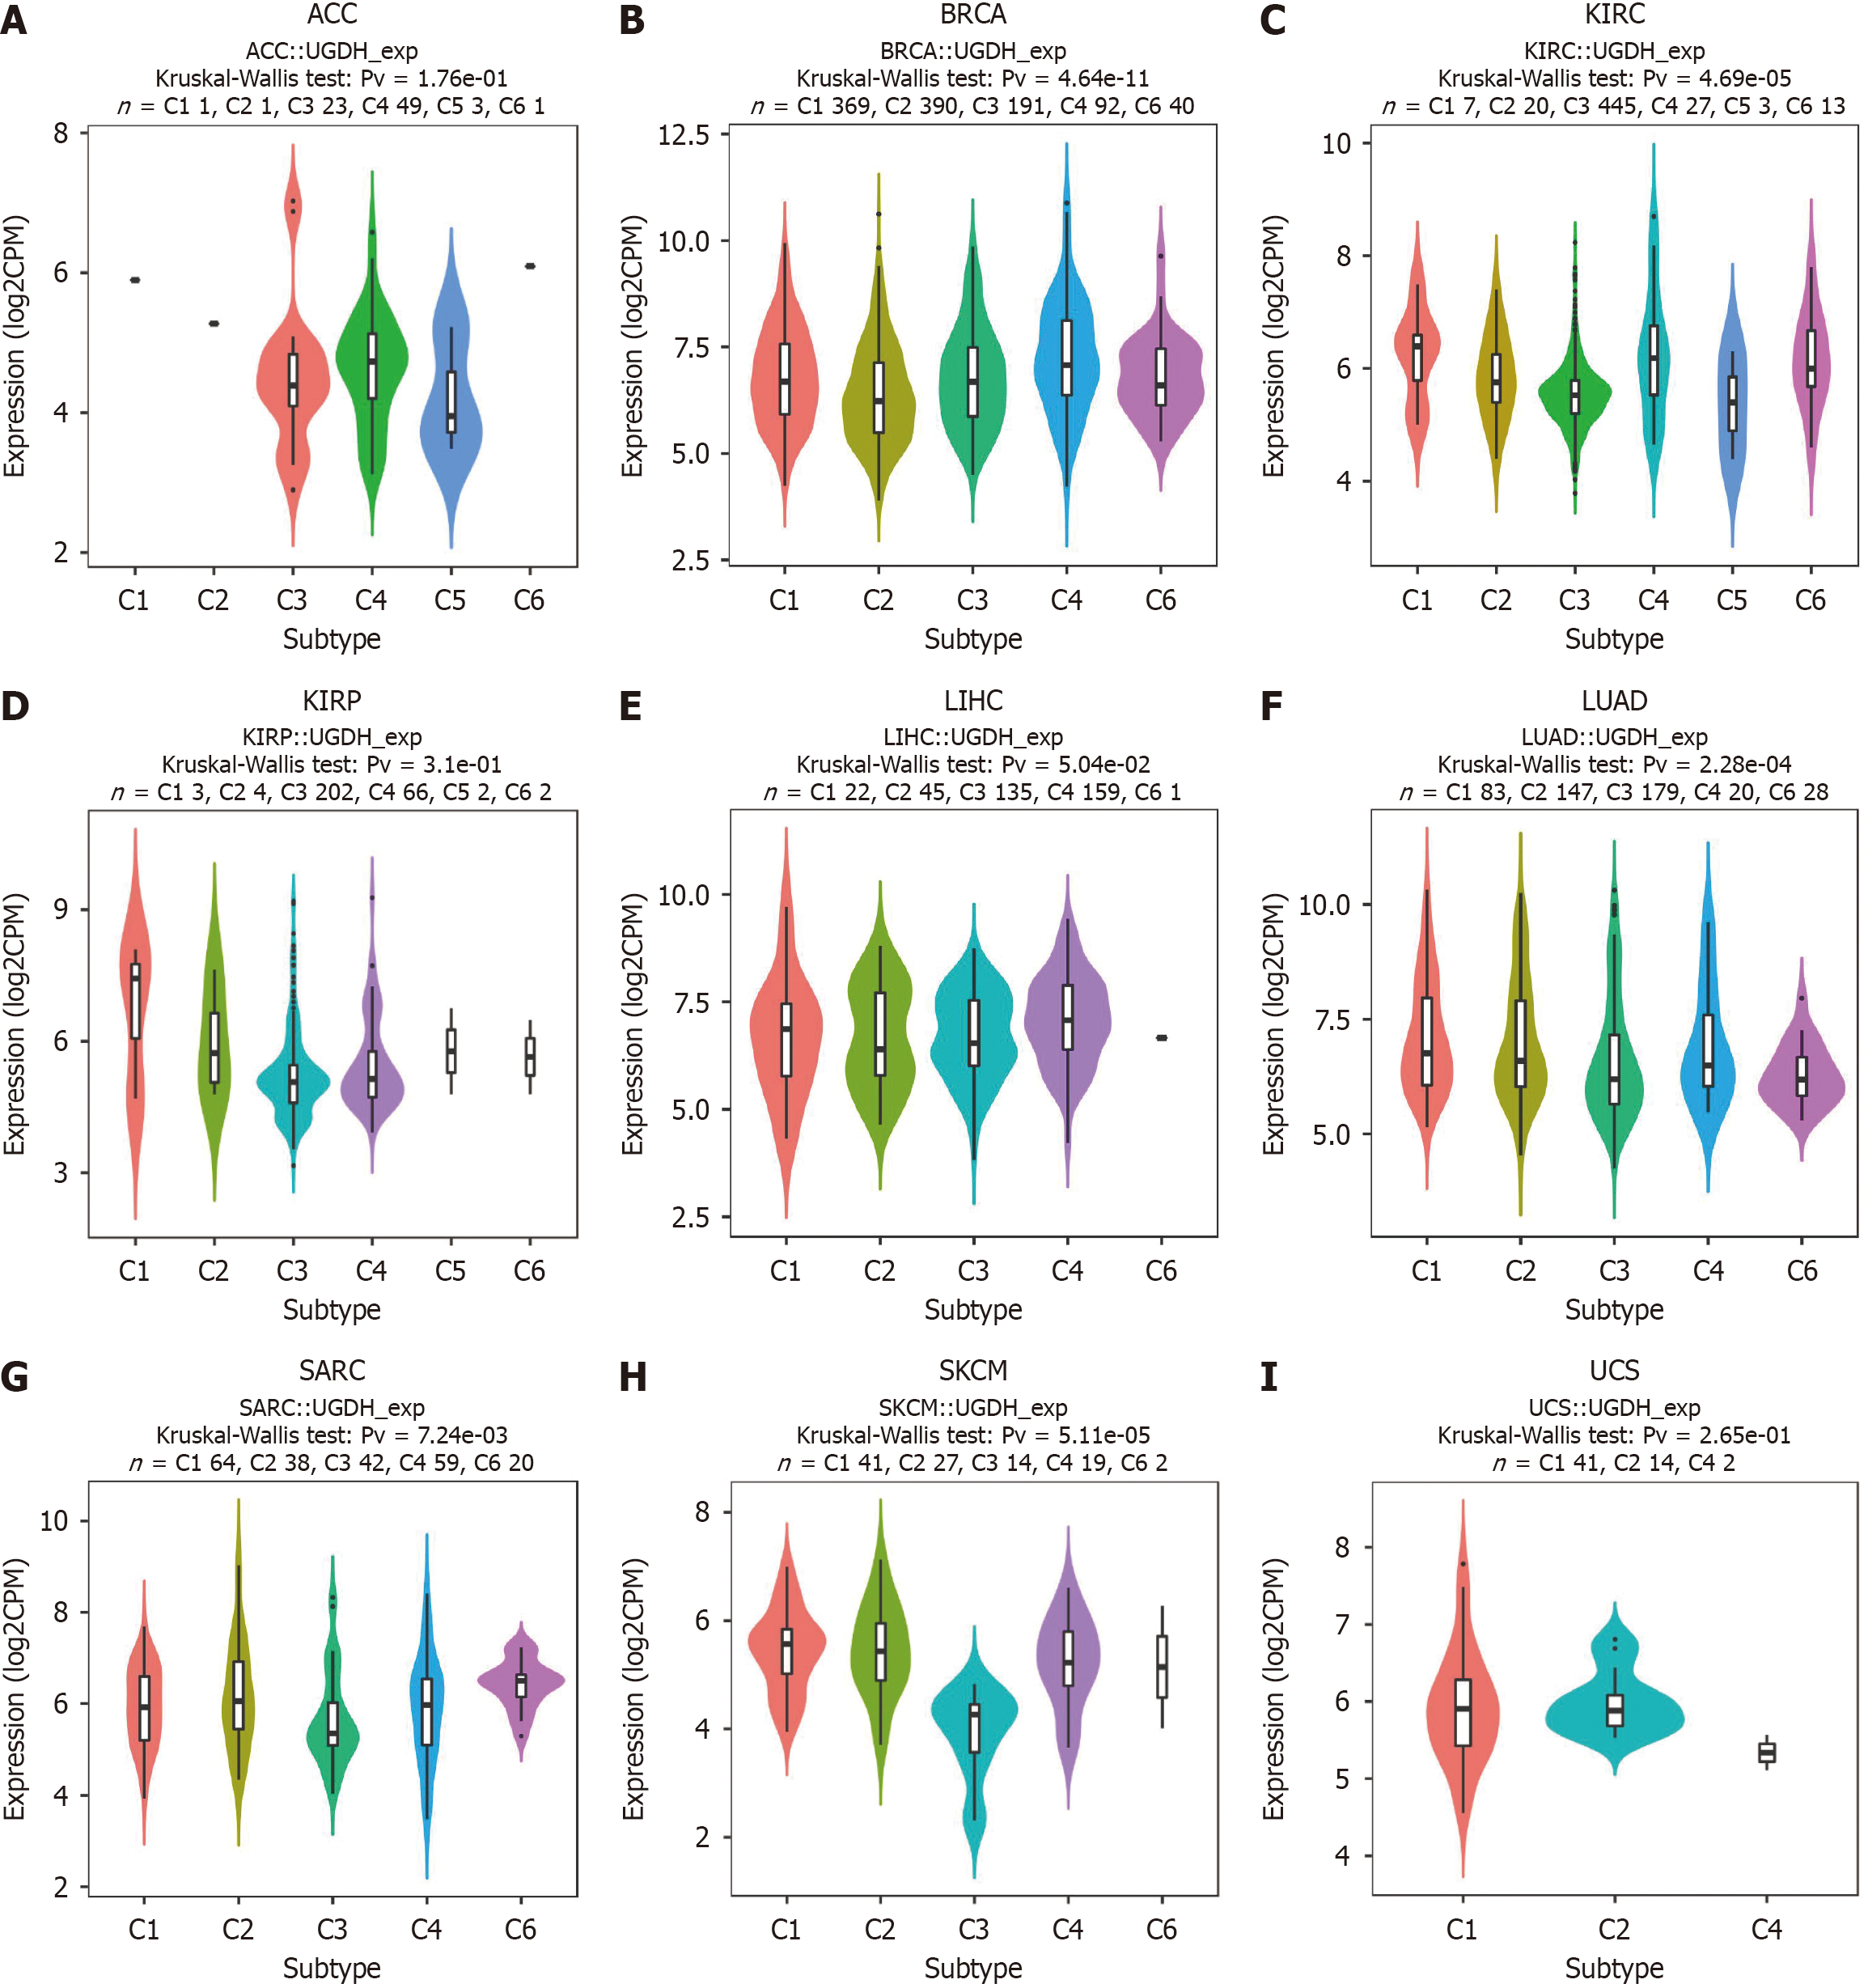
Figure 5 Correlations between UDP-glucose 6-dehydrogenase expression and immune subtypes in 9 cancers.
A: Correlations between UDP-glucose 6-dehydrogenase (UGDH) expression and immune subtypes in ACC; B: Correlations between UGDH expression and immune subtypes in BRCA; C: Correlations between UGDH expression and immune subtypes in KIRC; D: Correlations between UGDH expression and immune subtypes in KIRP; E: Correlations between UGDH expression and immune subtypes in LIHC; F: Correlations between UGDH expression and immune subtypes in LUAD; G: Correlations between UGDH expression and immune subtypes in SARC; H: Correlations between UGDH expression and immune subtypes in SKCM; I: Correlations between UGDH expression and immune subtypes in UCS. C1 (wound healing), C2 (IFN-γ dominant), C3 (inflammatory), C4 (lymphocyte-depleted), C5 (immunologically quiet), and C6 (TGF-β dominant).
Figure 6 Correlation of UDP-glucose 6-dehydrogenase with tumor infiltrating lymphocytes and immunoregulation-related genes in 33 cancers.
A: Correlation between UDP-glucose 6-dehydrogenase (UGDH) and tumor infiltrating lymphocytes; B: Correlation between UGDH and MHC molecules; C: Correlation between UGDH and immunostimulators; D: Correlation between UGDH and immunoinhibitors; E: Correlation between UGDH and chemokines; F: Correlation between UGDH and chemokine receptors.
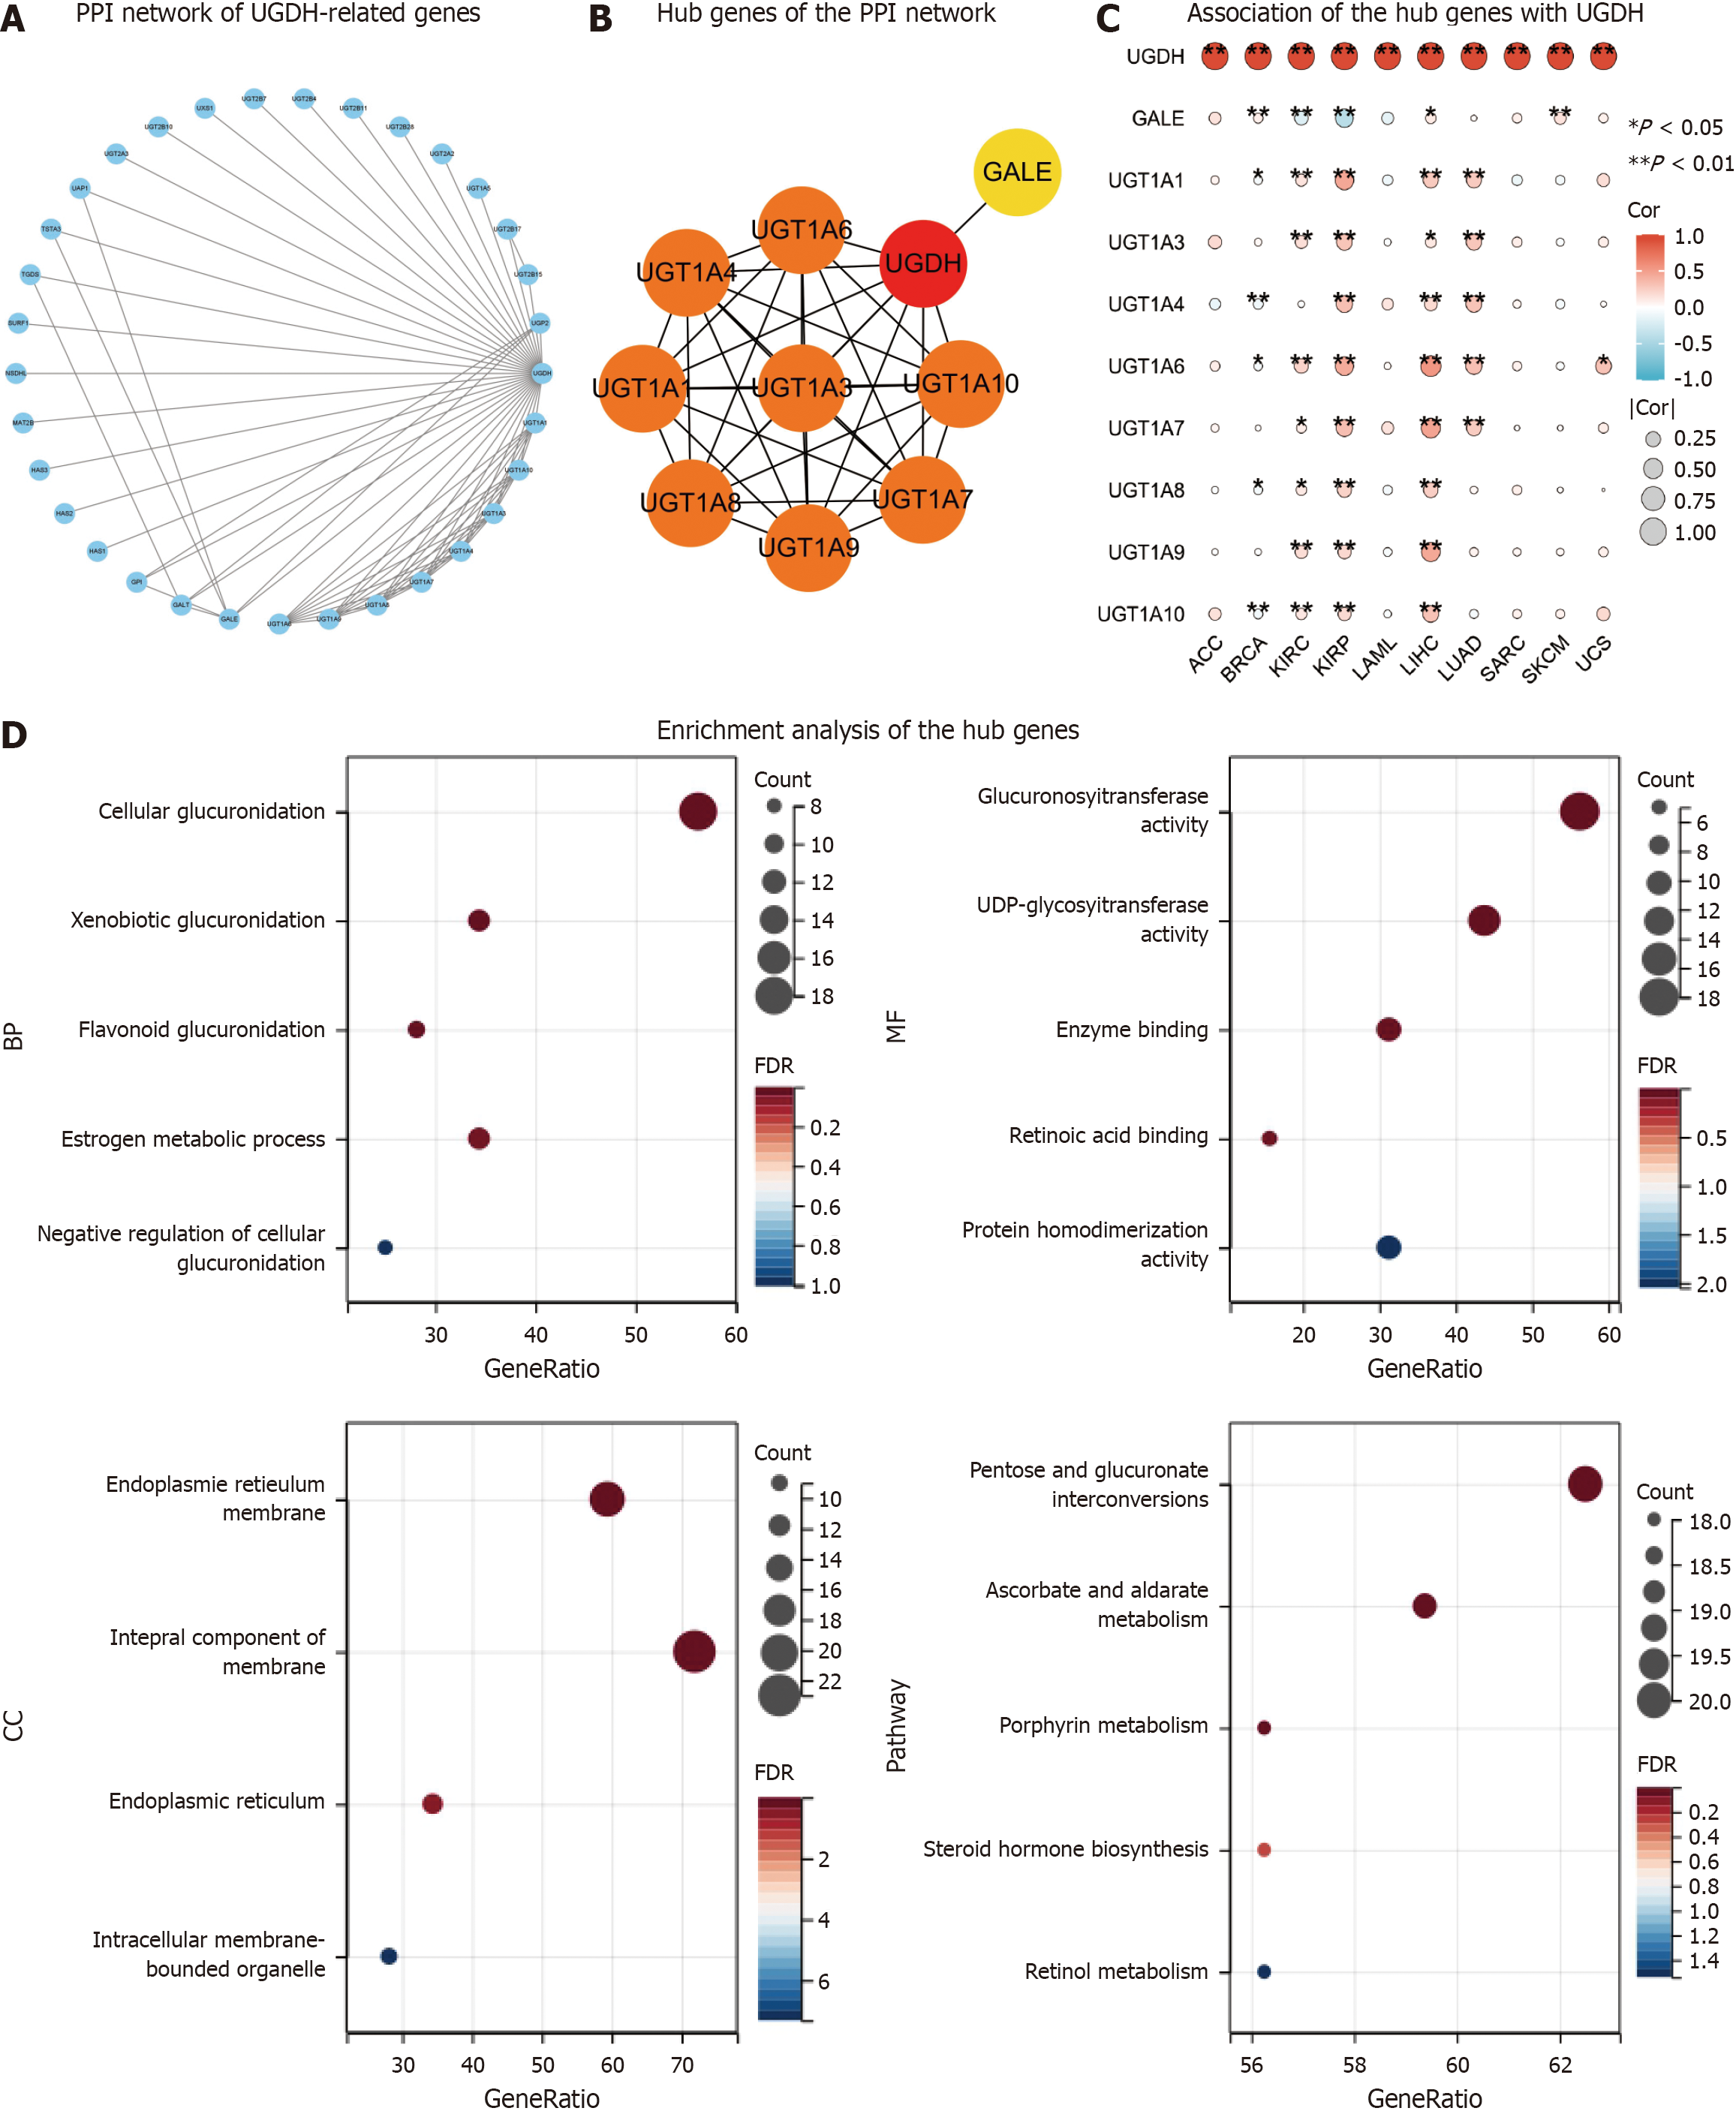
Figure 7 The network and enrichment analysis of UDP-glucose 6-dehydrogenase-related genes.
A: The protein-protein interaction (PPI) network of UDP-glucose 6-dehydrogenase (UGDH)-related genes; B: The top ten hub genes of the PPI network; C: The association of the hub gene with UGDH in ten cancers is presented as a heatmap; D: Gene Ontology/Kyoto Encyclopedia of Genes and Genomes pathway enrichment of UGDH-related genes in the PPI network.
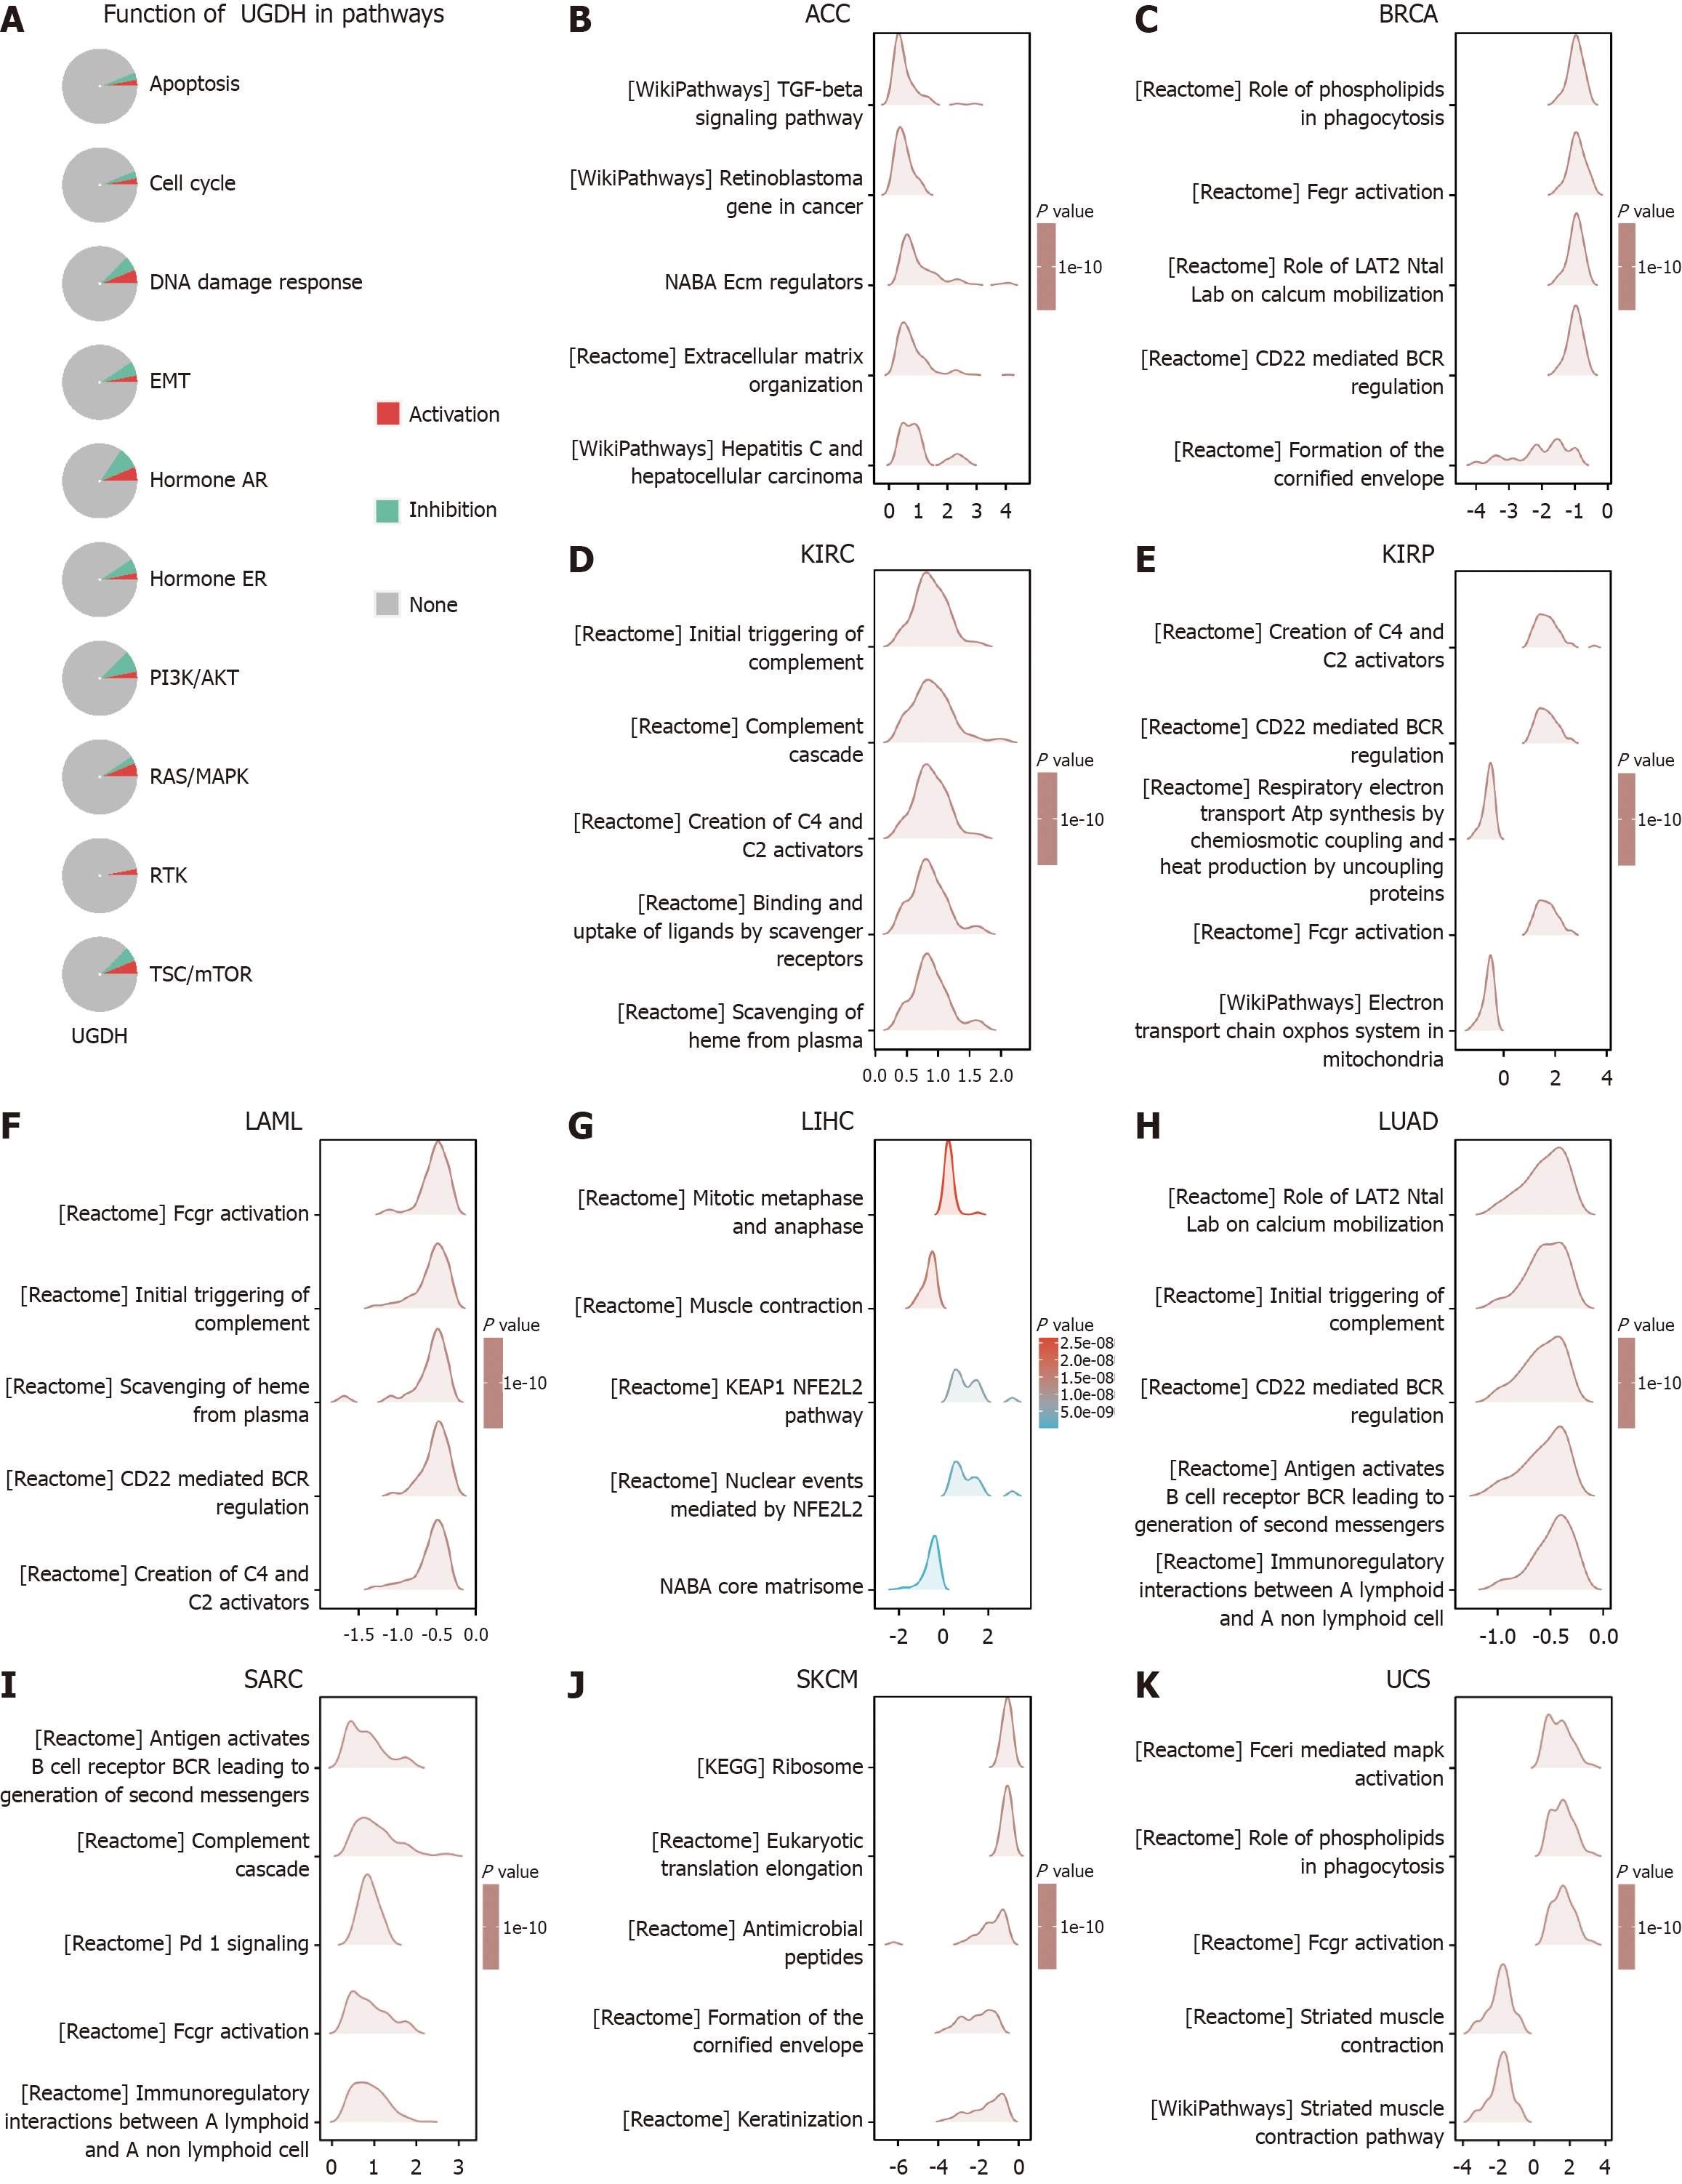
Figure 8 GSEA functional enrichment analysis of UDP-glucose 6-dehydrogenase expression in ten cancers.
A: UGDH function in pathways with activation or inhibition; B: GSEA analysis of UGDH in ACC; C: GSEA analysis of UGDH in BRCA; D: GSEA analysis of UGDH in KIRC; E: GSEA analysis of UGDH in KIRP; F: GSEA analysis of UGDH in LAML; G: GSEA analysis of UGDH in LIHC; H: GSEA analysis of UGDH in LUAD; I: GSEA analysis of UGDH in SARC; J: GSEA analysis of UGDH in SKCM; K: GSEA analysis of UGDH in UCS. The Y-axis represents one gene set, and the X-axis represents the distribution of log (FC) values corresponding to the core molecules in each gene set.
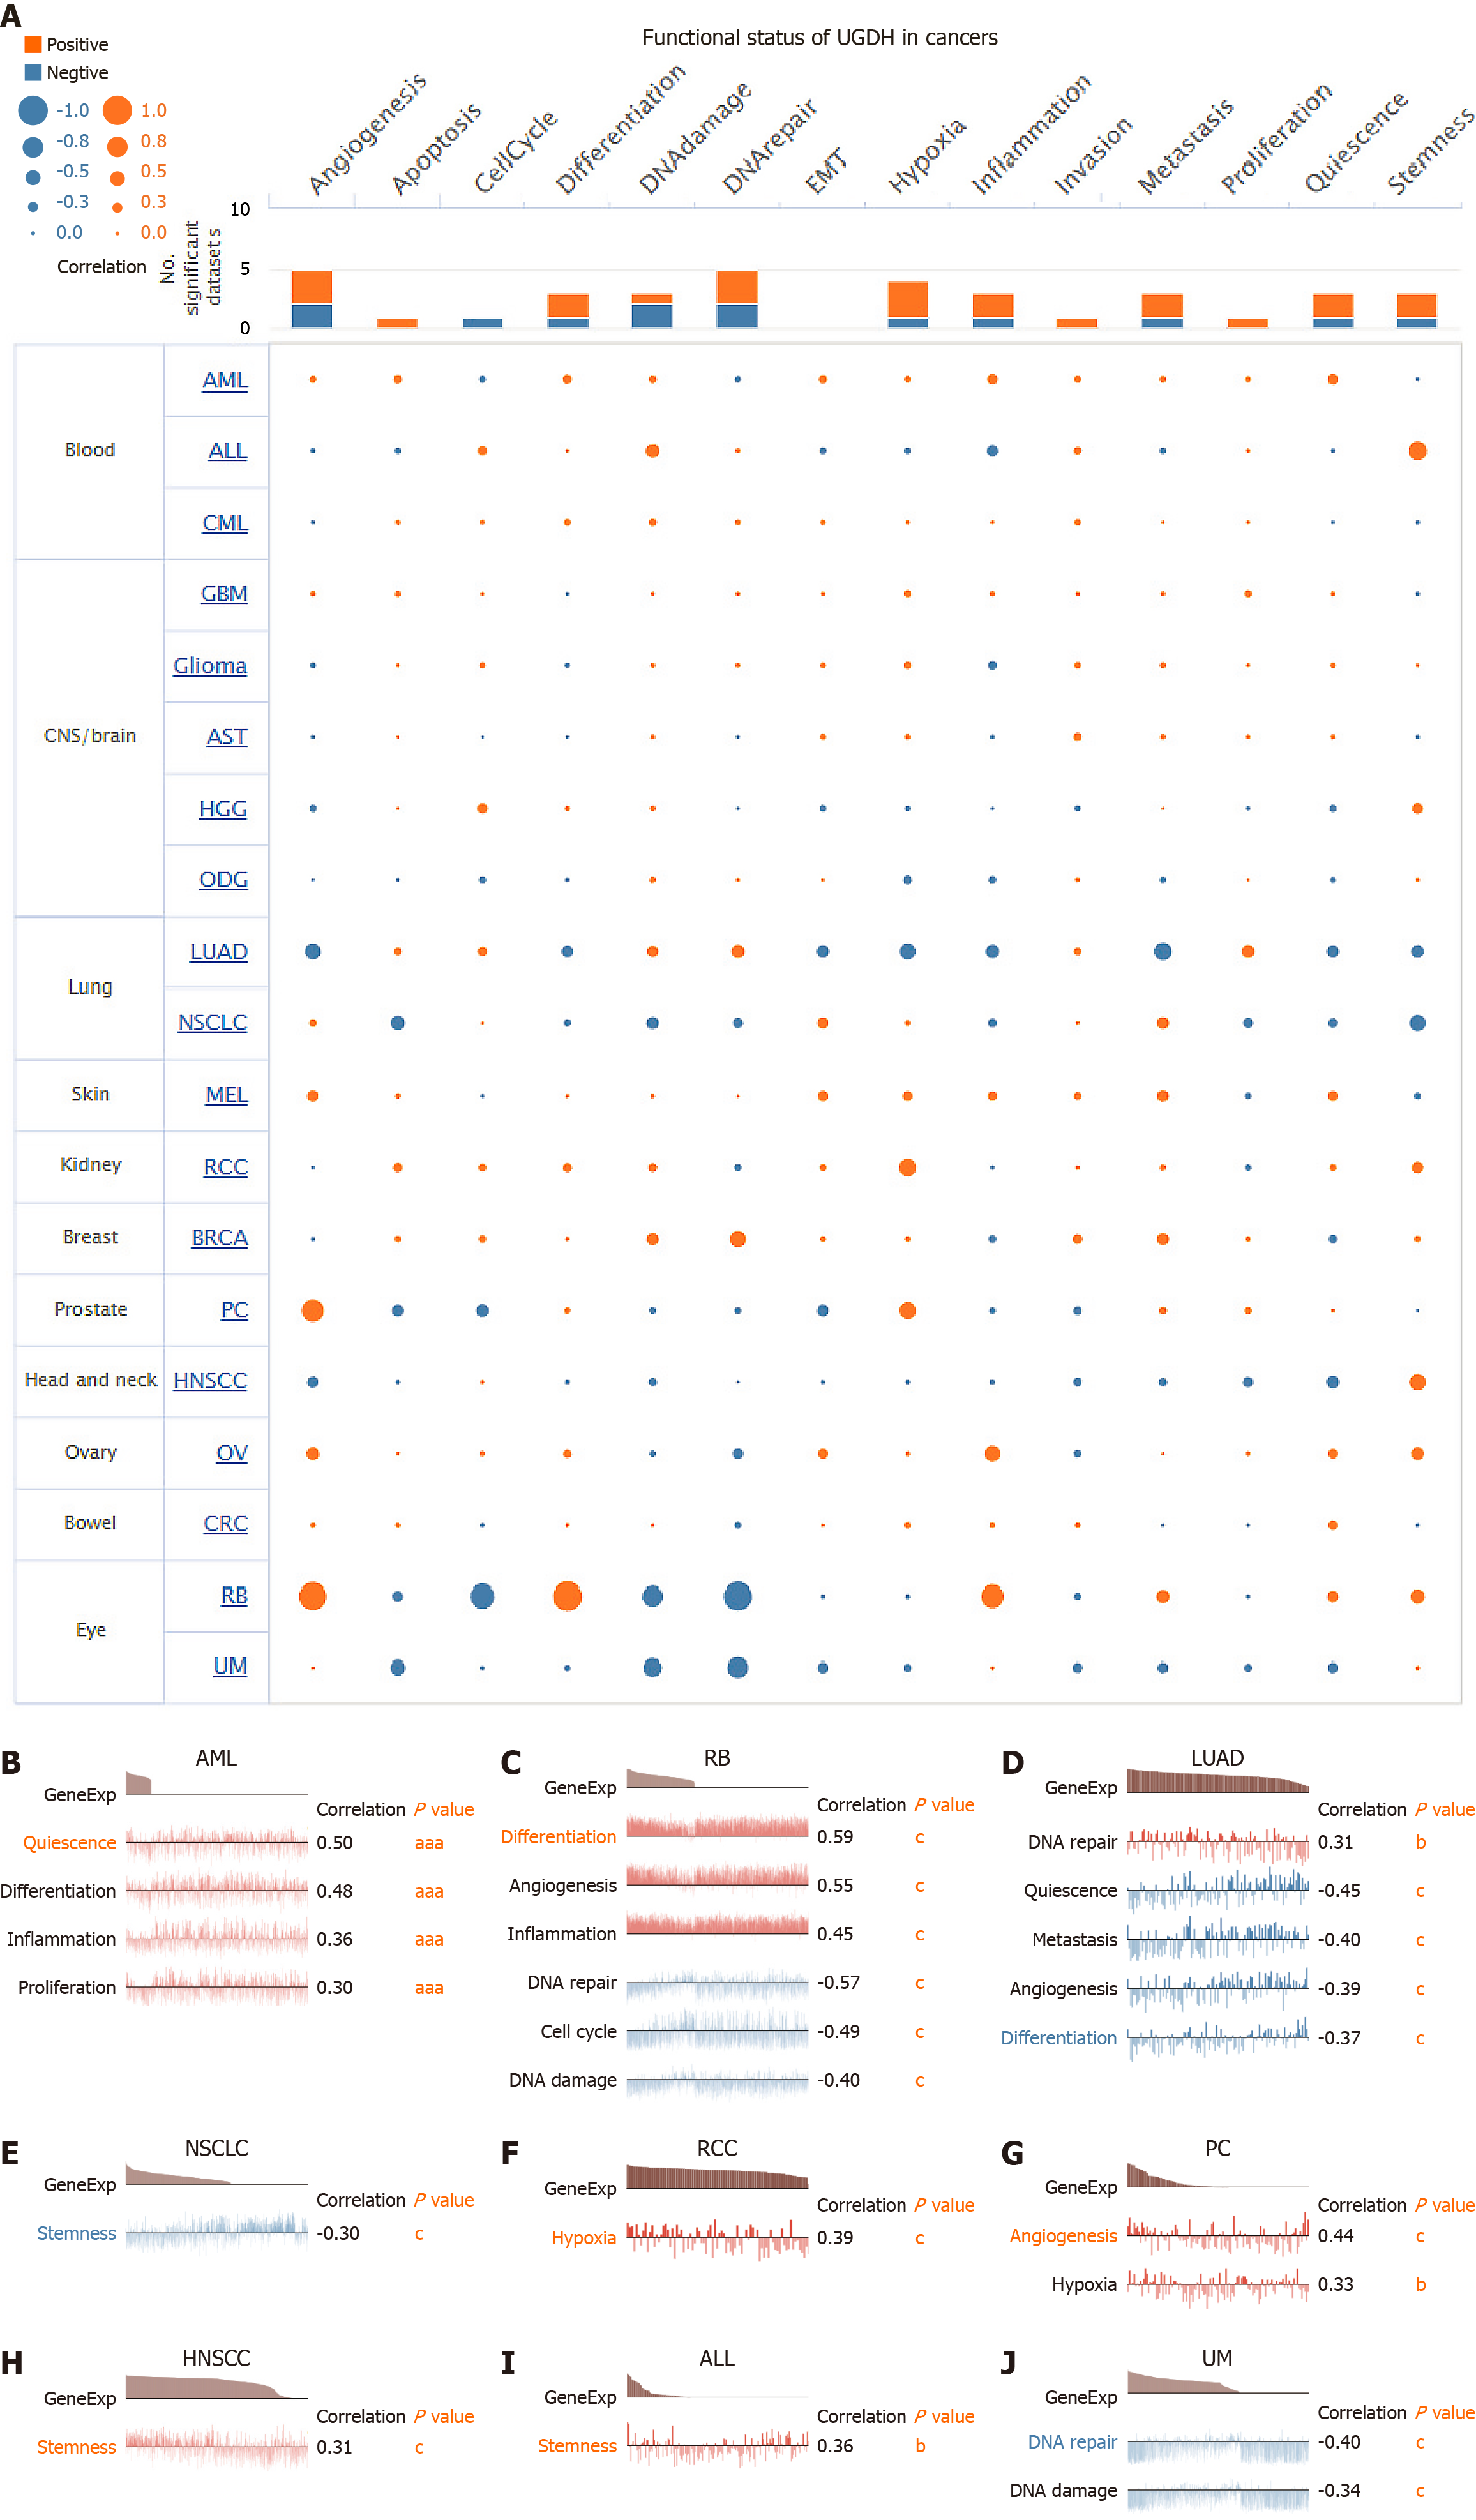
Figure 9 Correlation of UDP-glucose 6-dehydrogenase with functional state in cancers.
A: The interactive bubble chart presents the correlation of UDP-glucose 6-dehydrogenase (UGDH) with the functional state in 19 cancers; B-J: Correlation analysis between UGDH expression and functional states in nine cancers. The X-axis represents different gene sets. aP < 0.05, bP < 0.01, cP < 0.001.
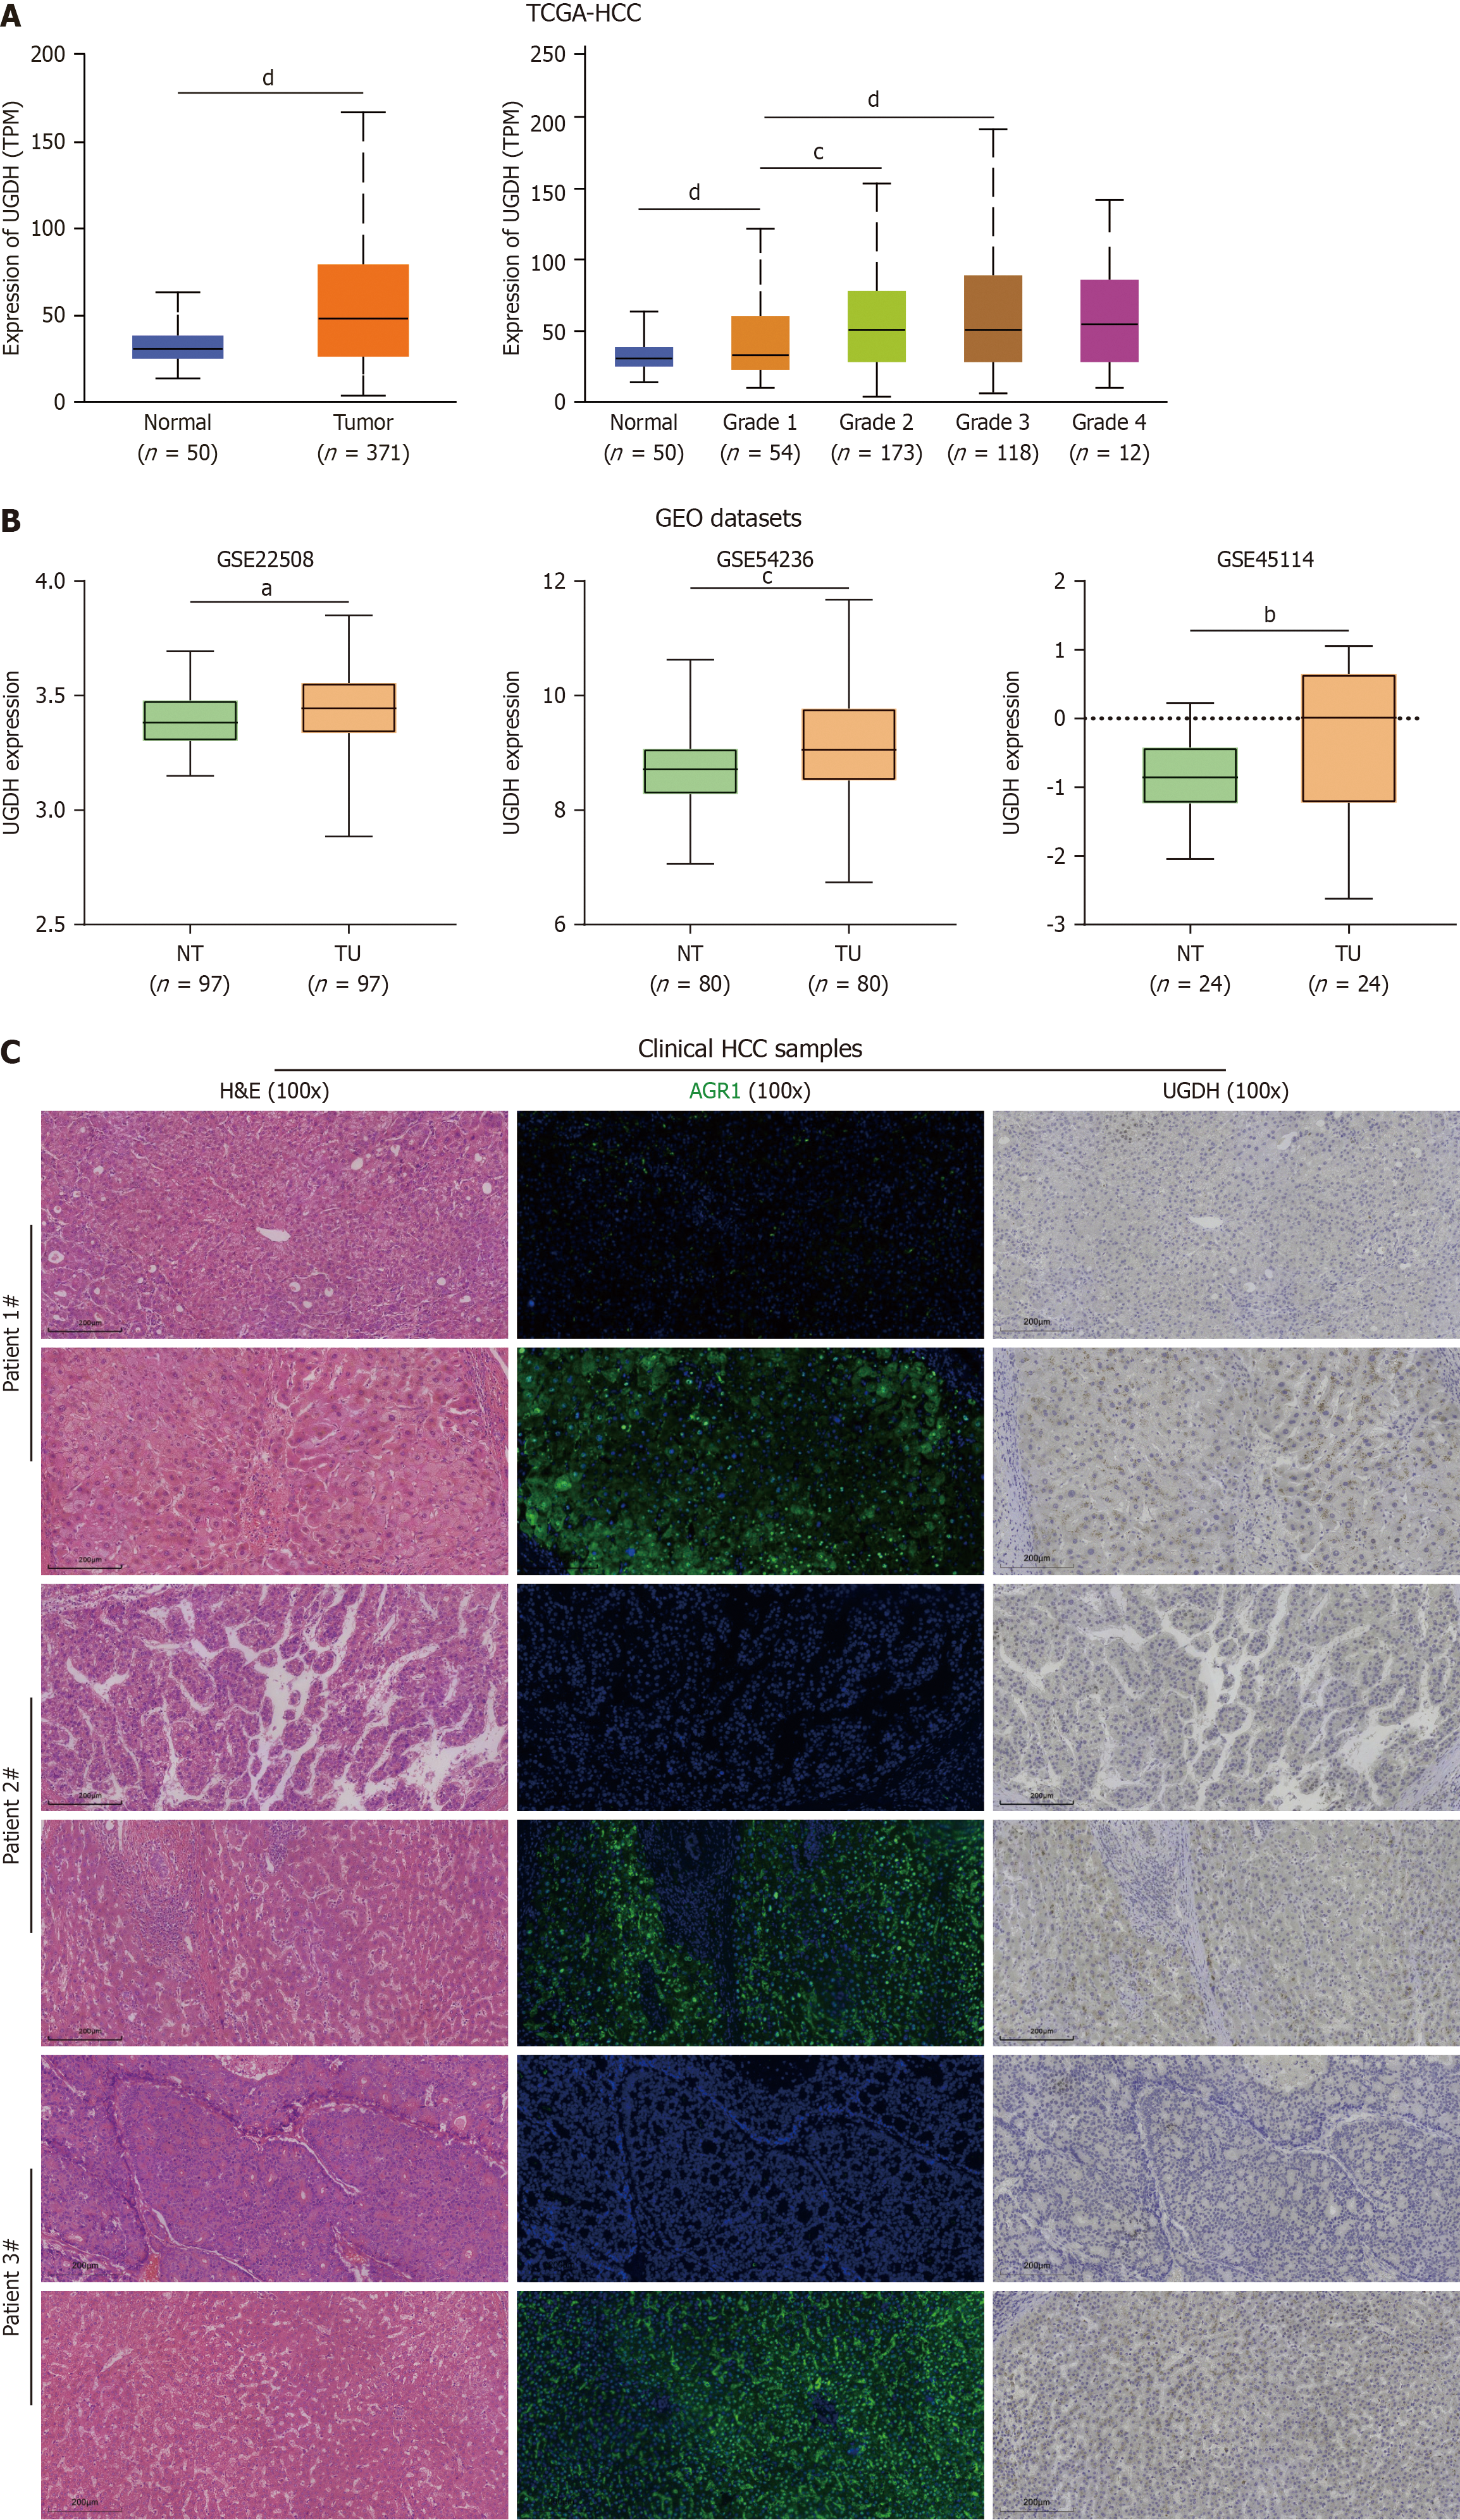
Figure 10 The expression of UDP-glucose 6-dehydrogenase in hepatocellular carcinoma.
A: UDP-glucose 6-dehydrogenase (UGDH) mRNA expression in the TCGA-HCC database; B: UGDH mRNA expression in the GEO database; C: Staining of clinical HCC samples. aP < 0.05, bP < 0.01, cP < 0.001, dP < 0001.
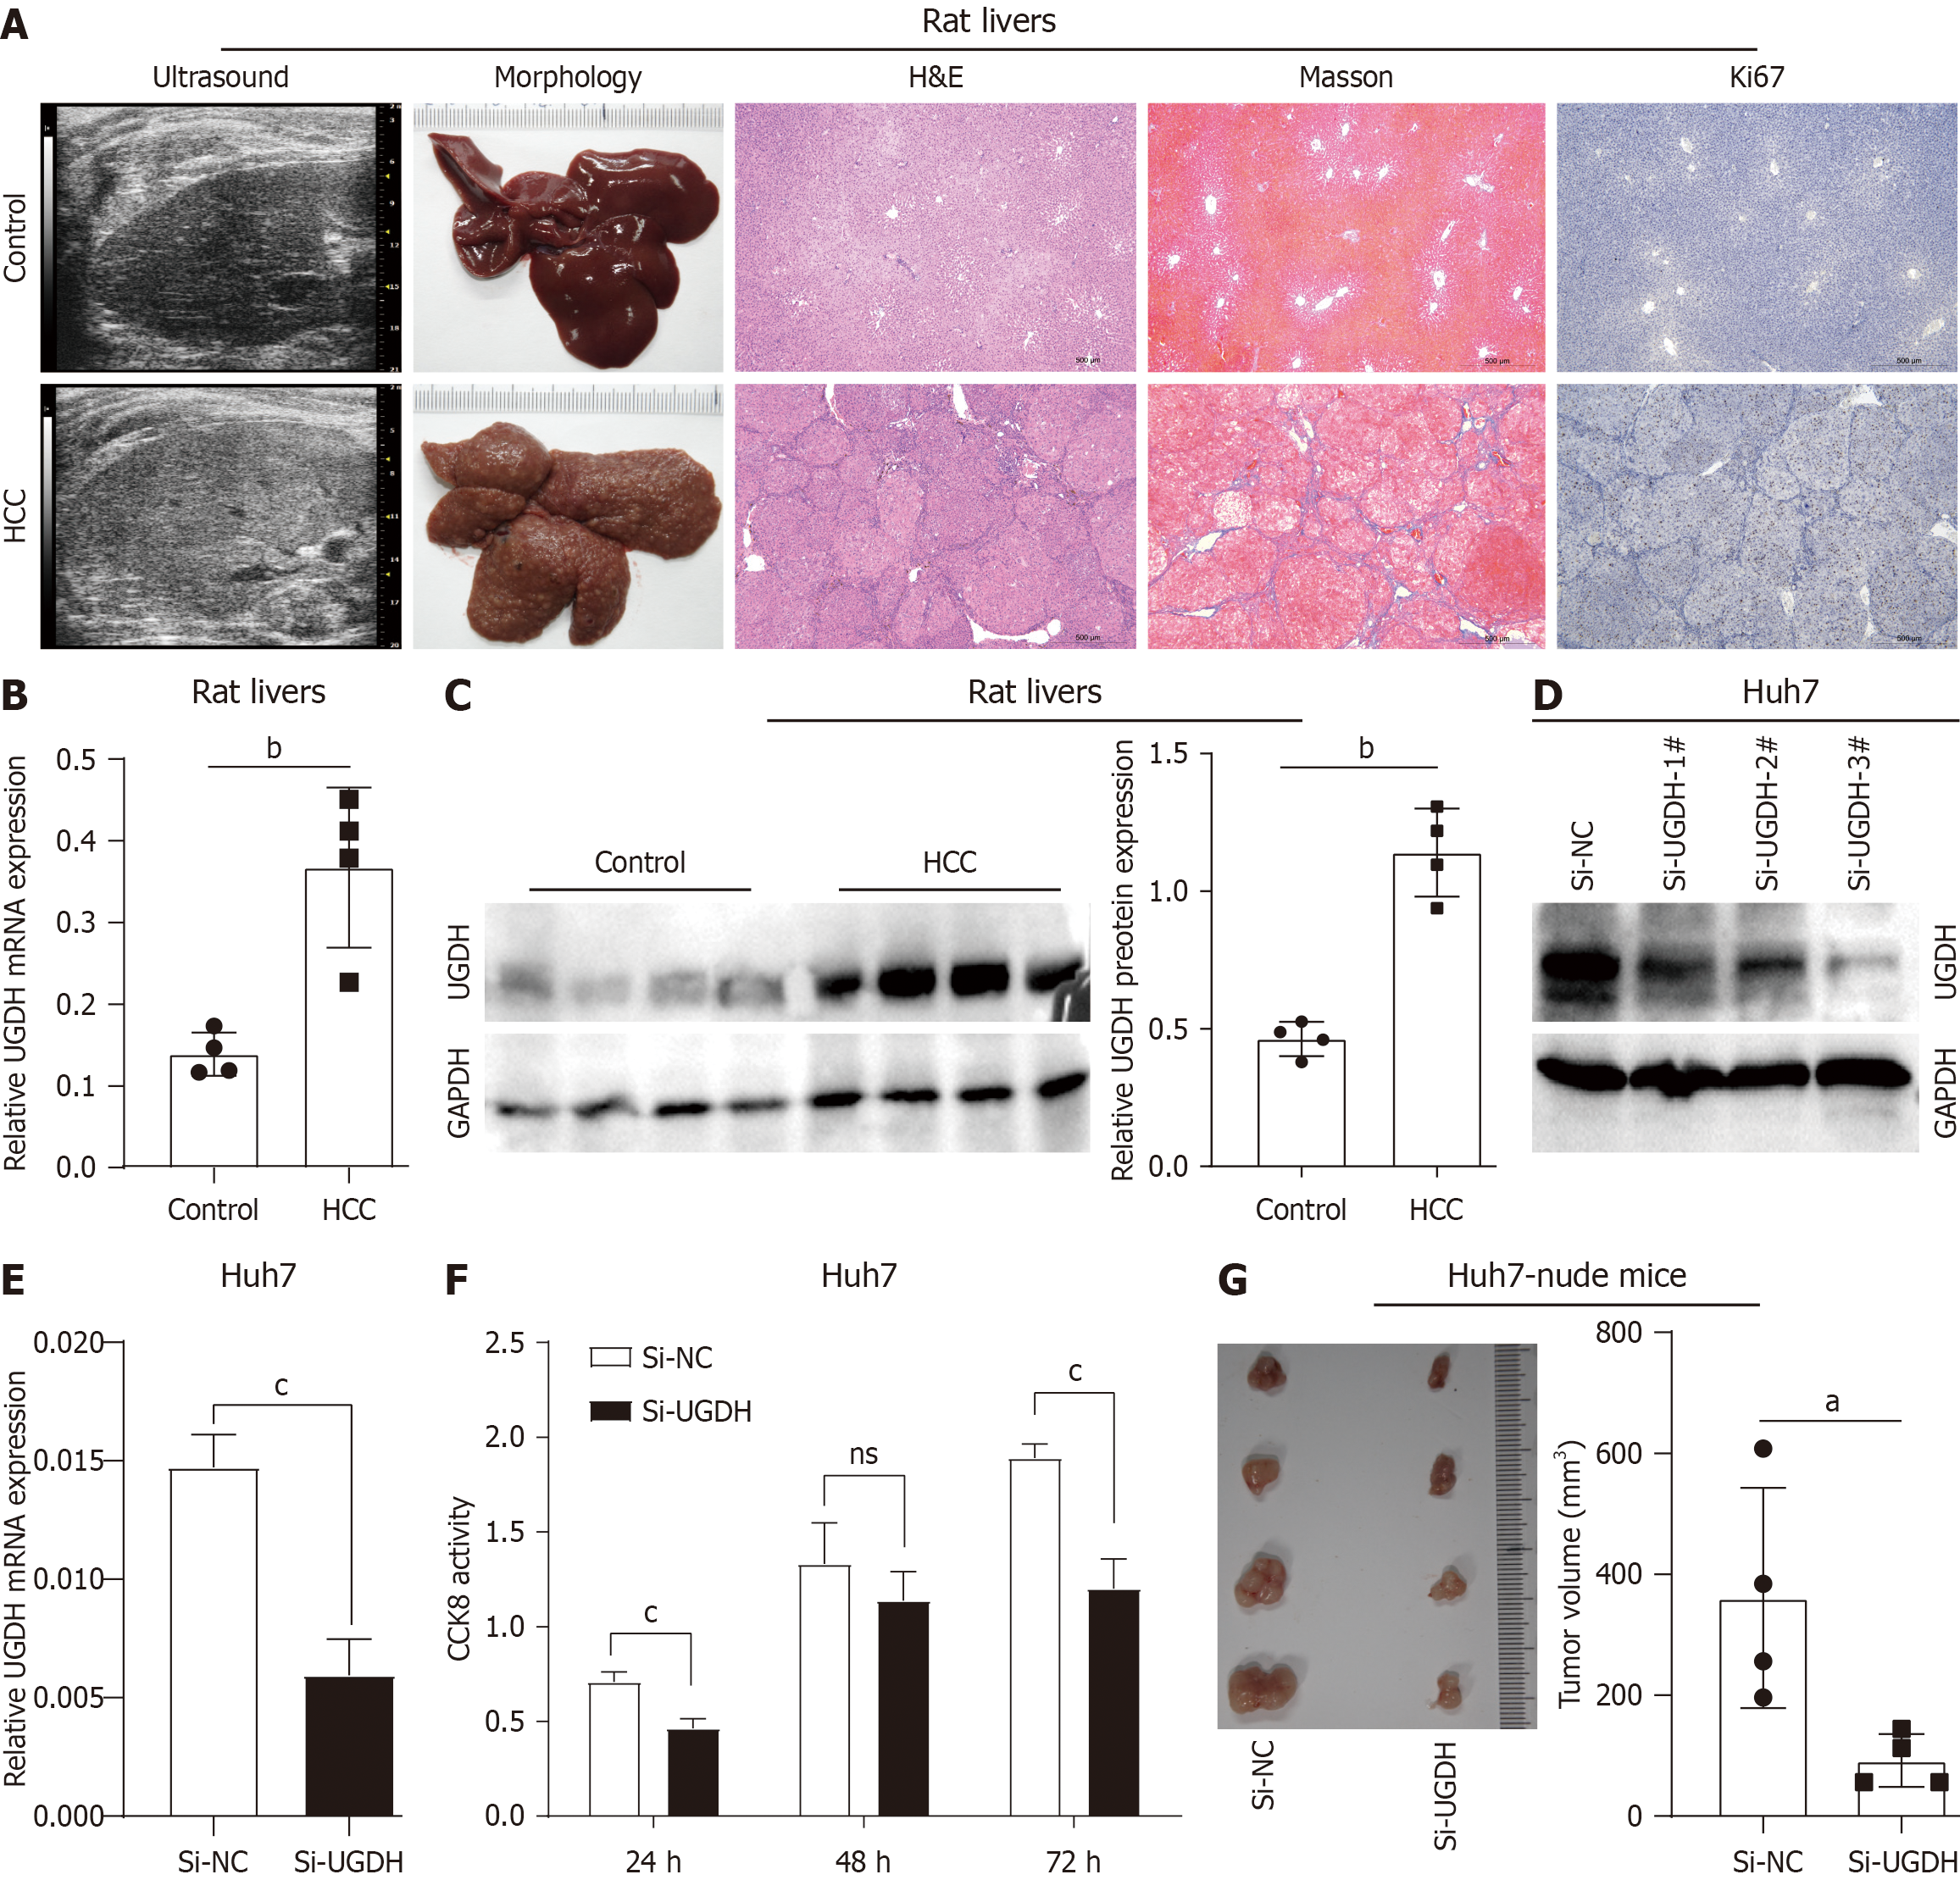
Figure 11 In vivo and in vitro experimental results.
A: Ultrasound, morphology, and histology of rat livers; B: UDP-glucose 6-dehydrogenase (UGDH) mRNA expression in rat livers; C: UGDH protein expression in rat livers; D: UGDH protein expression in Huh7 cells; E: UGDH mRNA expression in Huh7 cells; F: Cell viability of Huh7 cells; G: Xenograft tumor assay of Huh7 cells in nude mice. aP < 0.05, bP < 0.01, cP < 0.001.
- Citation: Cao X, Zheng SH, Shen JM, Li SZ, Hou L, Zhang JX, Li XK, Du HB, Zhang LP, Ye YA, Zao XB. Pan-cancer analysis of UDP-glucose 6-dehydrogenase in human tumors and its function in hepatocellular carcinoma. World J Gastrointest Oncol 2025; 17(7): 105981
- URL: https://www.wjgnet.com/1948-5204/full/v17/i7/105981.htm
- DOI: https://dx.doi.org/10.4251/wjgo.v17.i7.105981


