Copyright
©The Author(s) 2025.
World J Gastrointest Oncol. Jul 15, 2025; 17(7): 105264
Published online Jul 15, 2025. doi: 10.4251/wjgo.v17.i7.105264
Published online Jul 15, 2025. doi: 10.4251/wjgo.v17.i7.105264
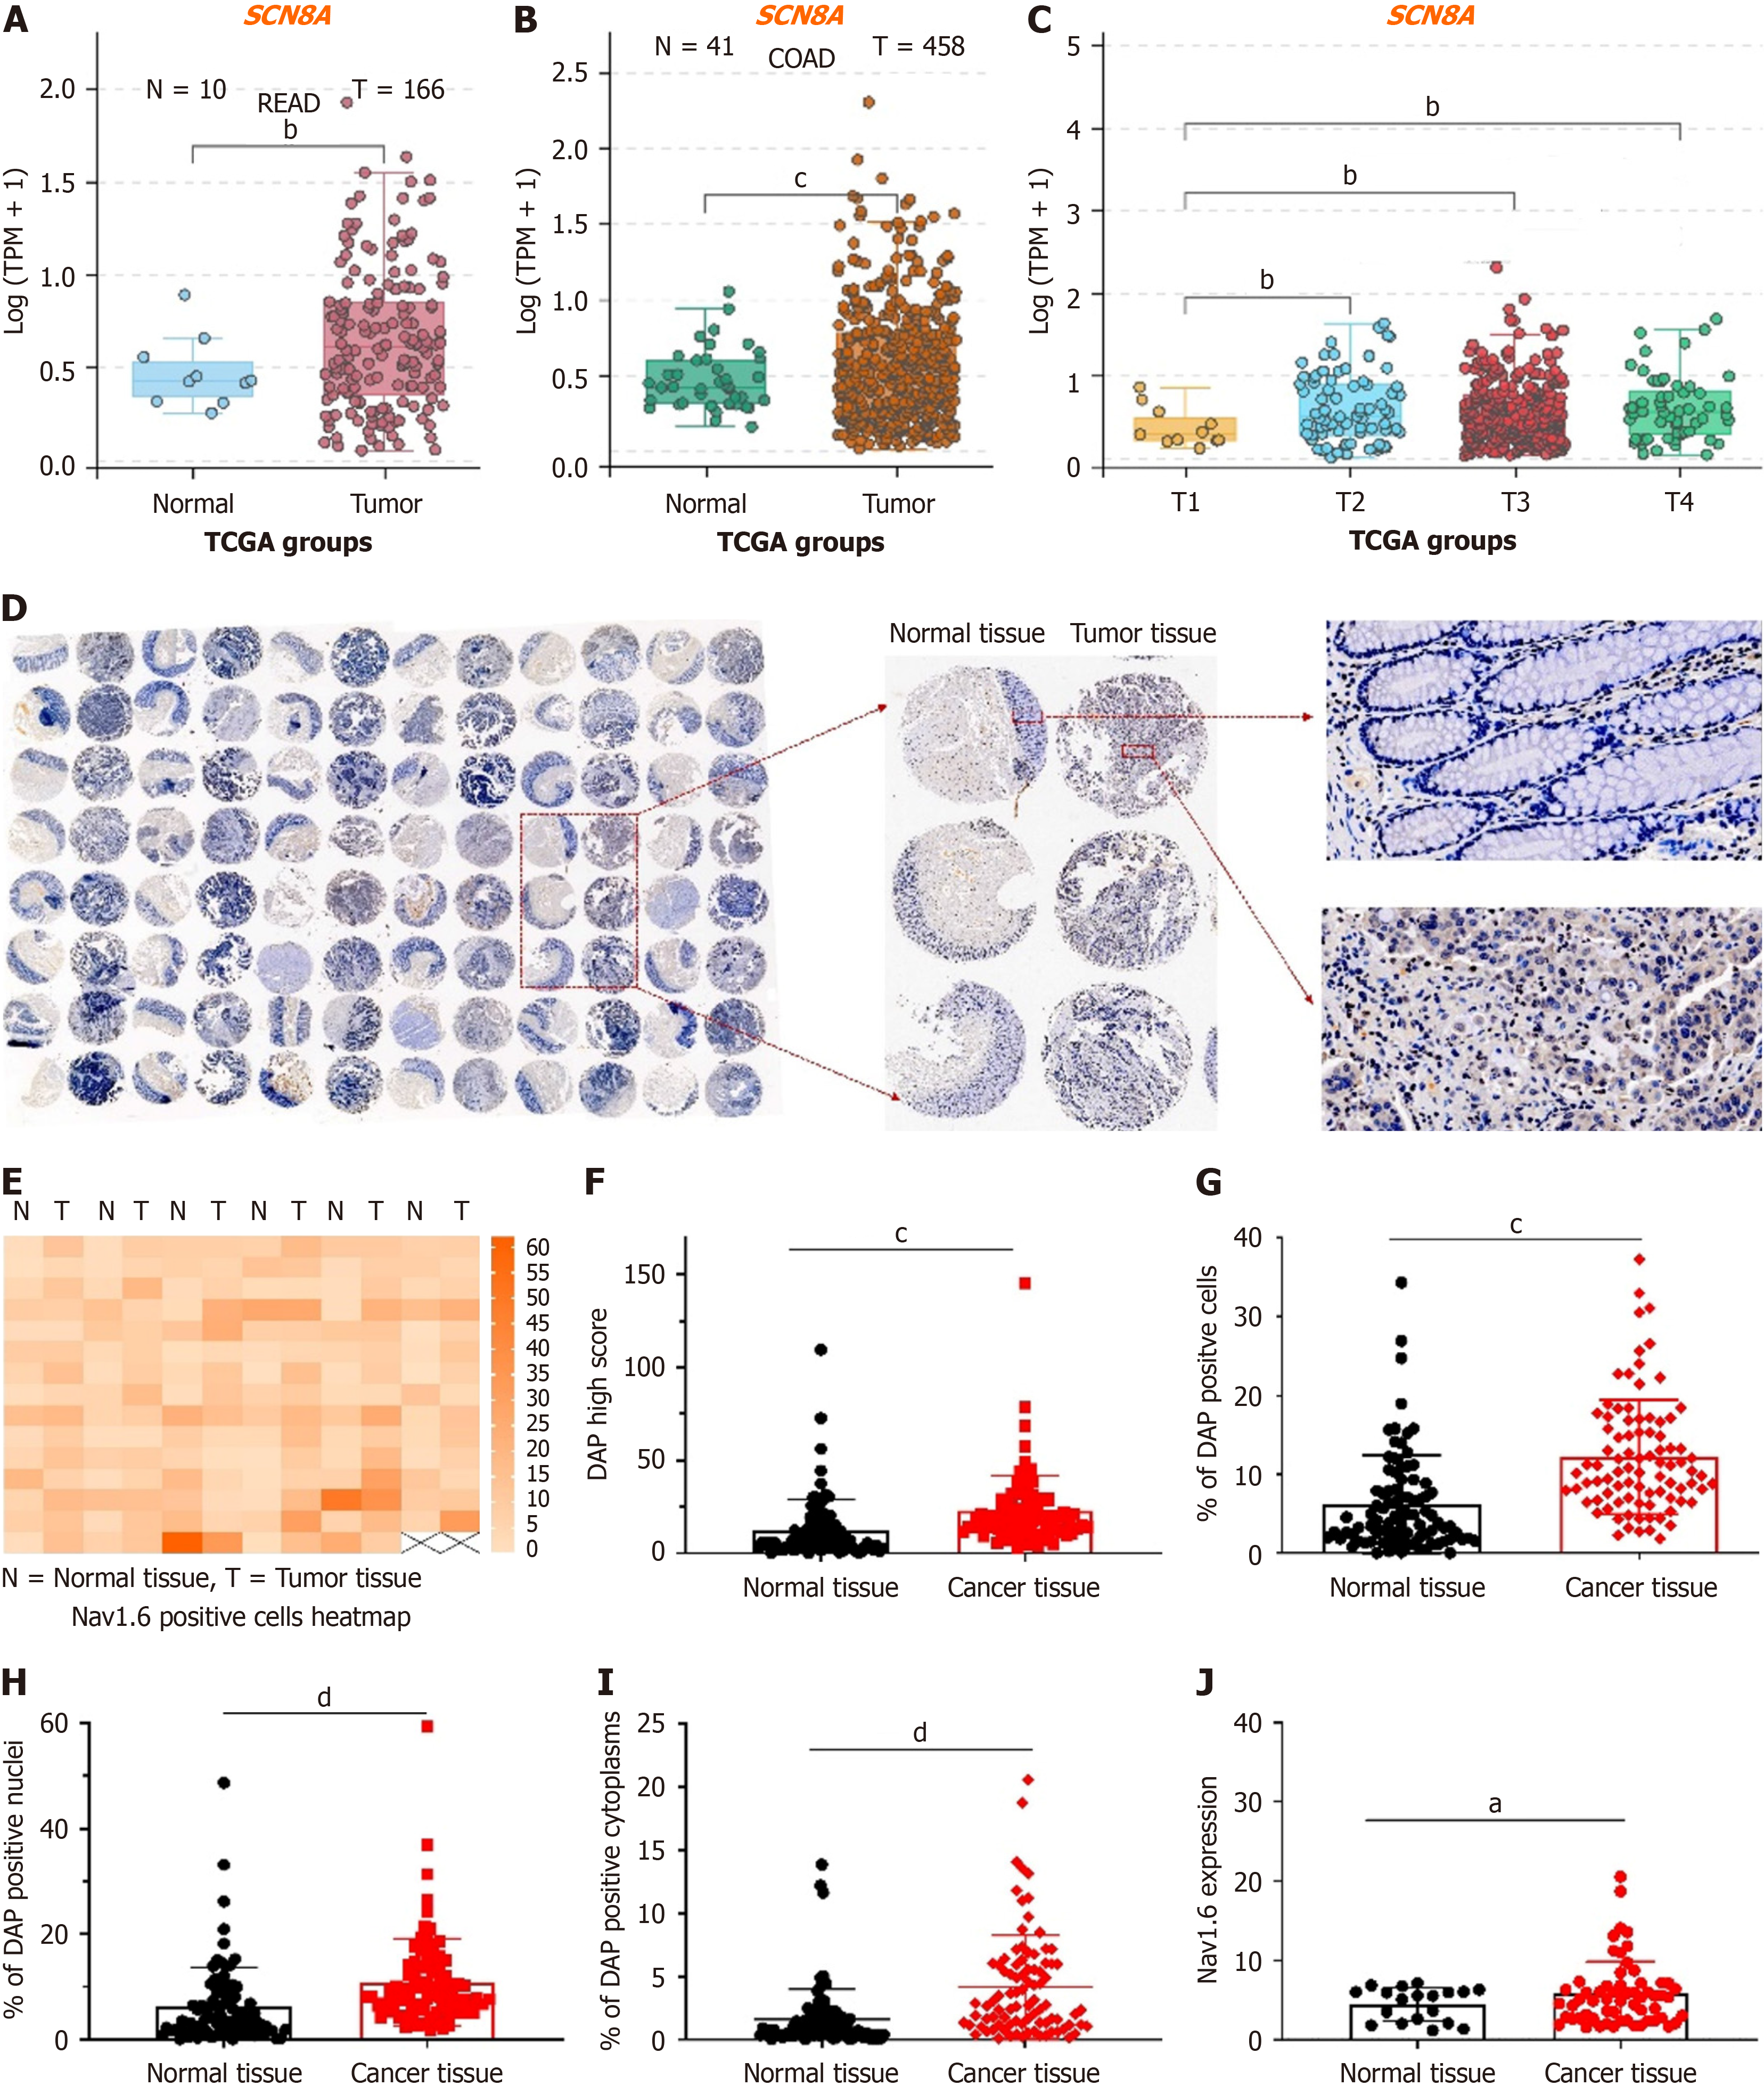
Figure 1 Expression of SCN8A (Nav1.
6) in colorectal cancer cells. A and B: Expression of Nav1.6 in rectal adenocarcinoma and colon adenocarcinoma. Each dot represents a patient; C: Expression of Nav1.6 in different stages of colorectal cancer; D: Representative images of immunohistochemical staining of Nav1.6 in cancer tissues and adjacent normal tissues from 90 colorectal cancer (CRC) patients; E: Heatmap showing the expression level of Nav1.6 in tumor and normal colon tissues after staining with Nav1.6 antibody. The orange-red color indicates a high quantitative value, while white represents a low quantitative value; F: H-Score of Nav1.6 signal intensity in 97 cancer and adjacent tissues; G-I: Proportion of DAP-positive cells (G), positive nuclei (H), and positive cytoplasm (I) in cancer and normal colon tissues; J: Cytoplasmic expression of Nav1.6 in different stages of CRC. aP < 0.05; bP < 0.01; cP < 0.001; dP < 0.0001; READ: Rectal adenocarcinoma; COAD: Colon adenocarcinoma; TCGA: The Cancer Genome Atlas.
Figure 2 Weighted correlation network analysis of the gene set associated with Nav1.
6 expression. A: Screening of SCN8A-correlated genes from tumors vs normal differentially expressed genes (DEGs) in the colon adenocarcinoma and rectal adenocarcinoma databases of The Cancer Genome Atlas; B: Volcano plot showing the upregulated genes (red) and downregulated genes in the 575 intersecting DEGs; C: Selection of soft-threshold power. Panel C shows the scale-free fit index (left) and average connectivity (right) vs soft-threshold power. A power of 12 was selected as the fit index curve flattens at high values (> 0.9); D: Cluster dendrogram and module assignment from weighted correlation network analysis. Genes were clustered based on dissimilarity measures (1-TOM). The branches represent modules of highly interconnected genes. The dynamic tree cut colors indicate modules identified by the Dynamic TreeCut method. Some modules were merged based on similarity, and the final merged modules were used for subsequent analysis; E: Heatmap representing the topological overlap matrix (TOM) of all genes in the analysis. The degree of overlap is indicated by color shading, with darker colors representing higher overlap and lighter colors indicating lower overlap. The gene dendrogram is shown on the left, and module assignments are shown on the top; F: Correlation of module eigengenes with clinical and pathological traits. Each row corresponds to a module eigengene, and the columns represent clinical traits. The values in the cells are presented as "Pearson r (P value)" and are color-coded based on the direction and magnitude of the correlation (red = positive correlation; blue = negative correlation). The 16 co-expressed transcript modules are shown along with their respective correlation parameters with clinical and pathological traits; G: Distribution of genes positively correlated with T stage in colorectal cancer (blue). READ: Rectal adenocarcinoma; COAD: Colon adenocarcinoma.
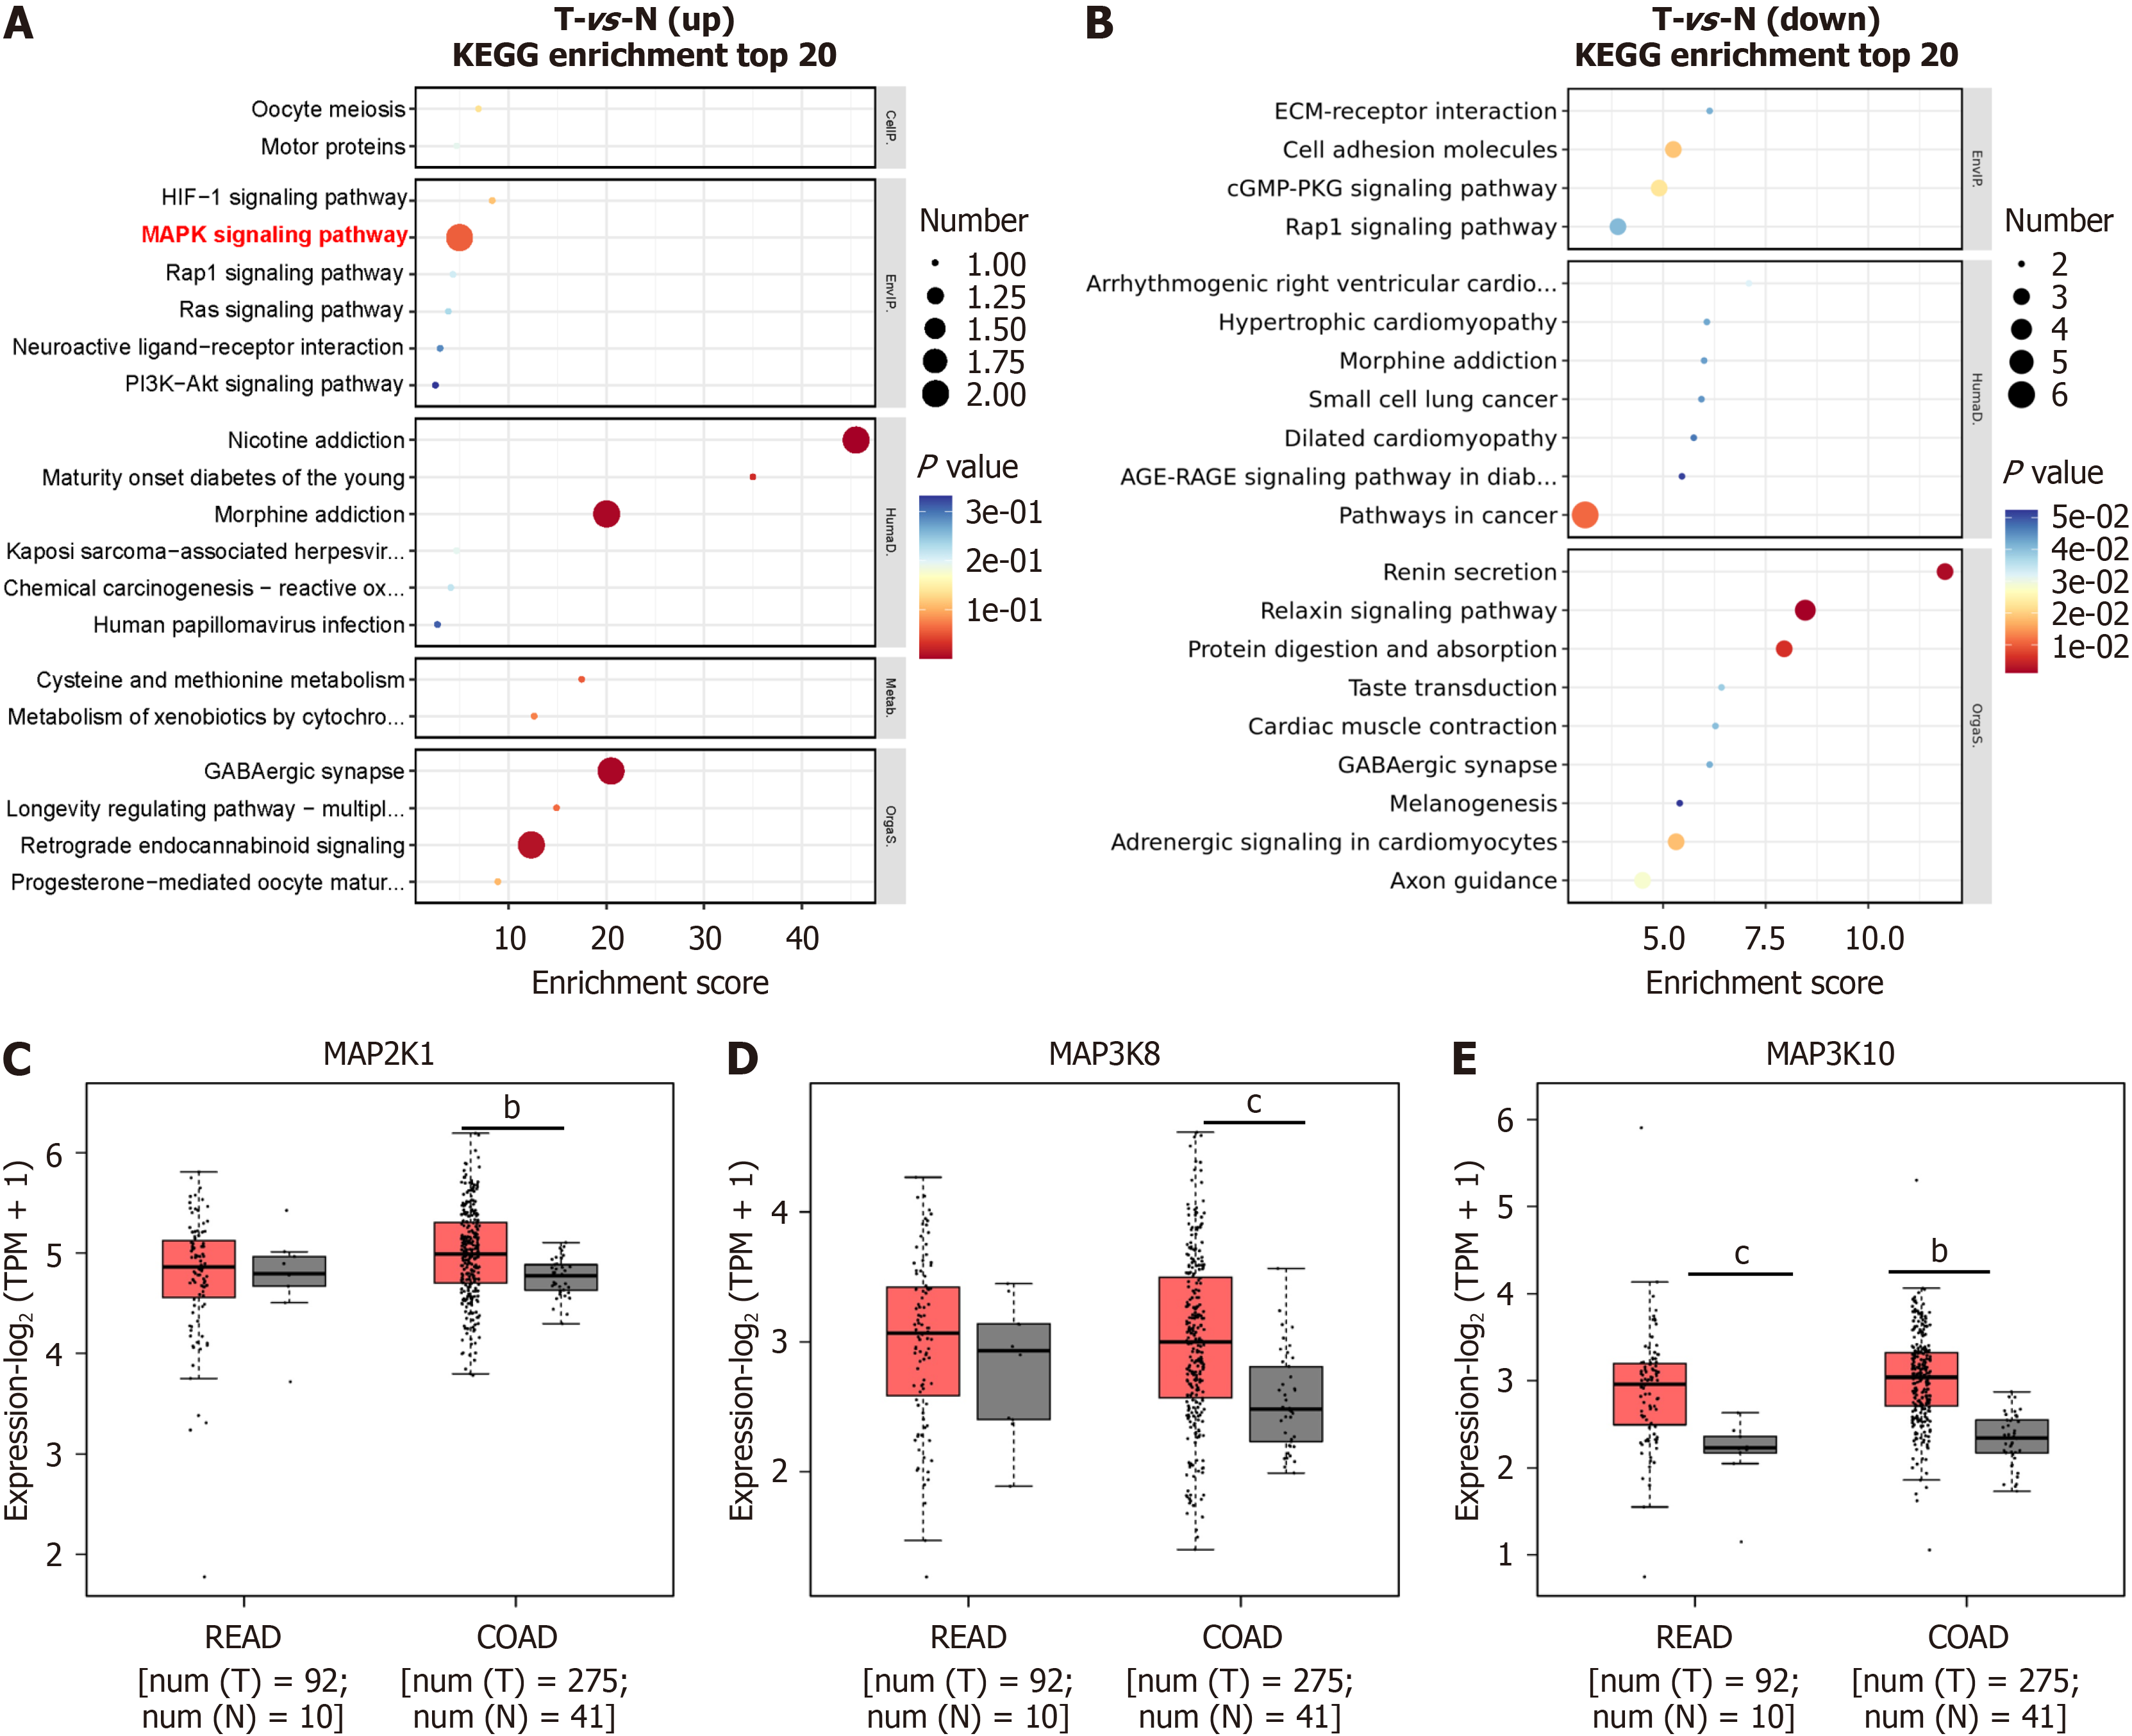
Figure 3 KEGG enrichment analysis of Nav1.
6-related differentially expressed genes from weighted correlation network analysis-enriched molecules. A and B: KEGG pathway analysis of differentially expressed genes (DEGs). Upregulated DEGs are shown in red (A), while downregulated DEGs are shown in blue (B). The advanced bubble chart shows the top 20 enriched signaling pathways for DEGs. The X-axis represents the rich factor (rich factor = number of DEGs enriched in the pathway/total number of genes in the background gene set), and the Y-axis represents the enriched pathway. The color indicates the significance of the enrichment, and the size of the bubble corresponds to the number of DEGs enriched in the pathway; C-E: Expression of KEGG-enriched MAPK genes in colon and rectal cancer tissues. bP < 0.01; cP < 0.001; READ: Rectal adenocarcinoma; COAD: Colon adenocarcinoma.
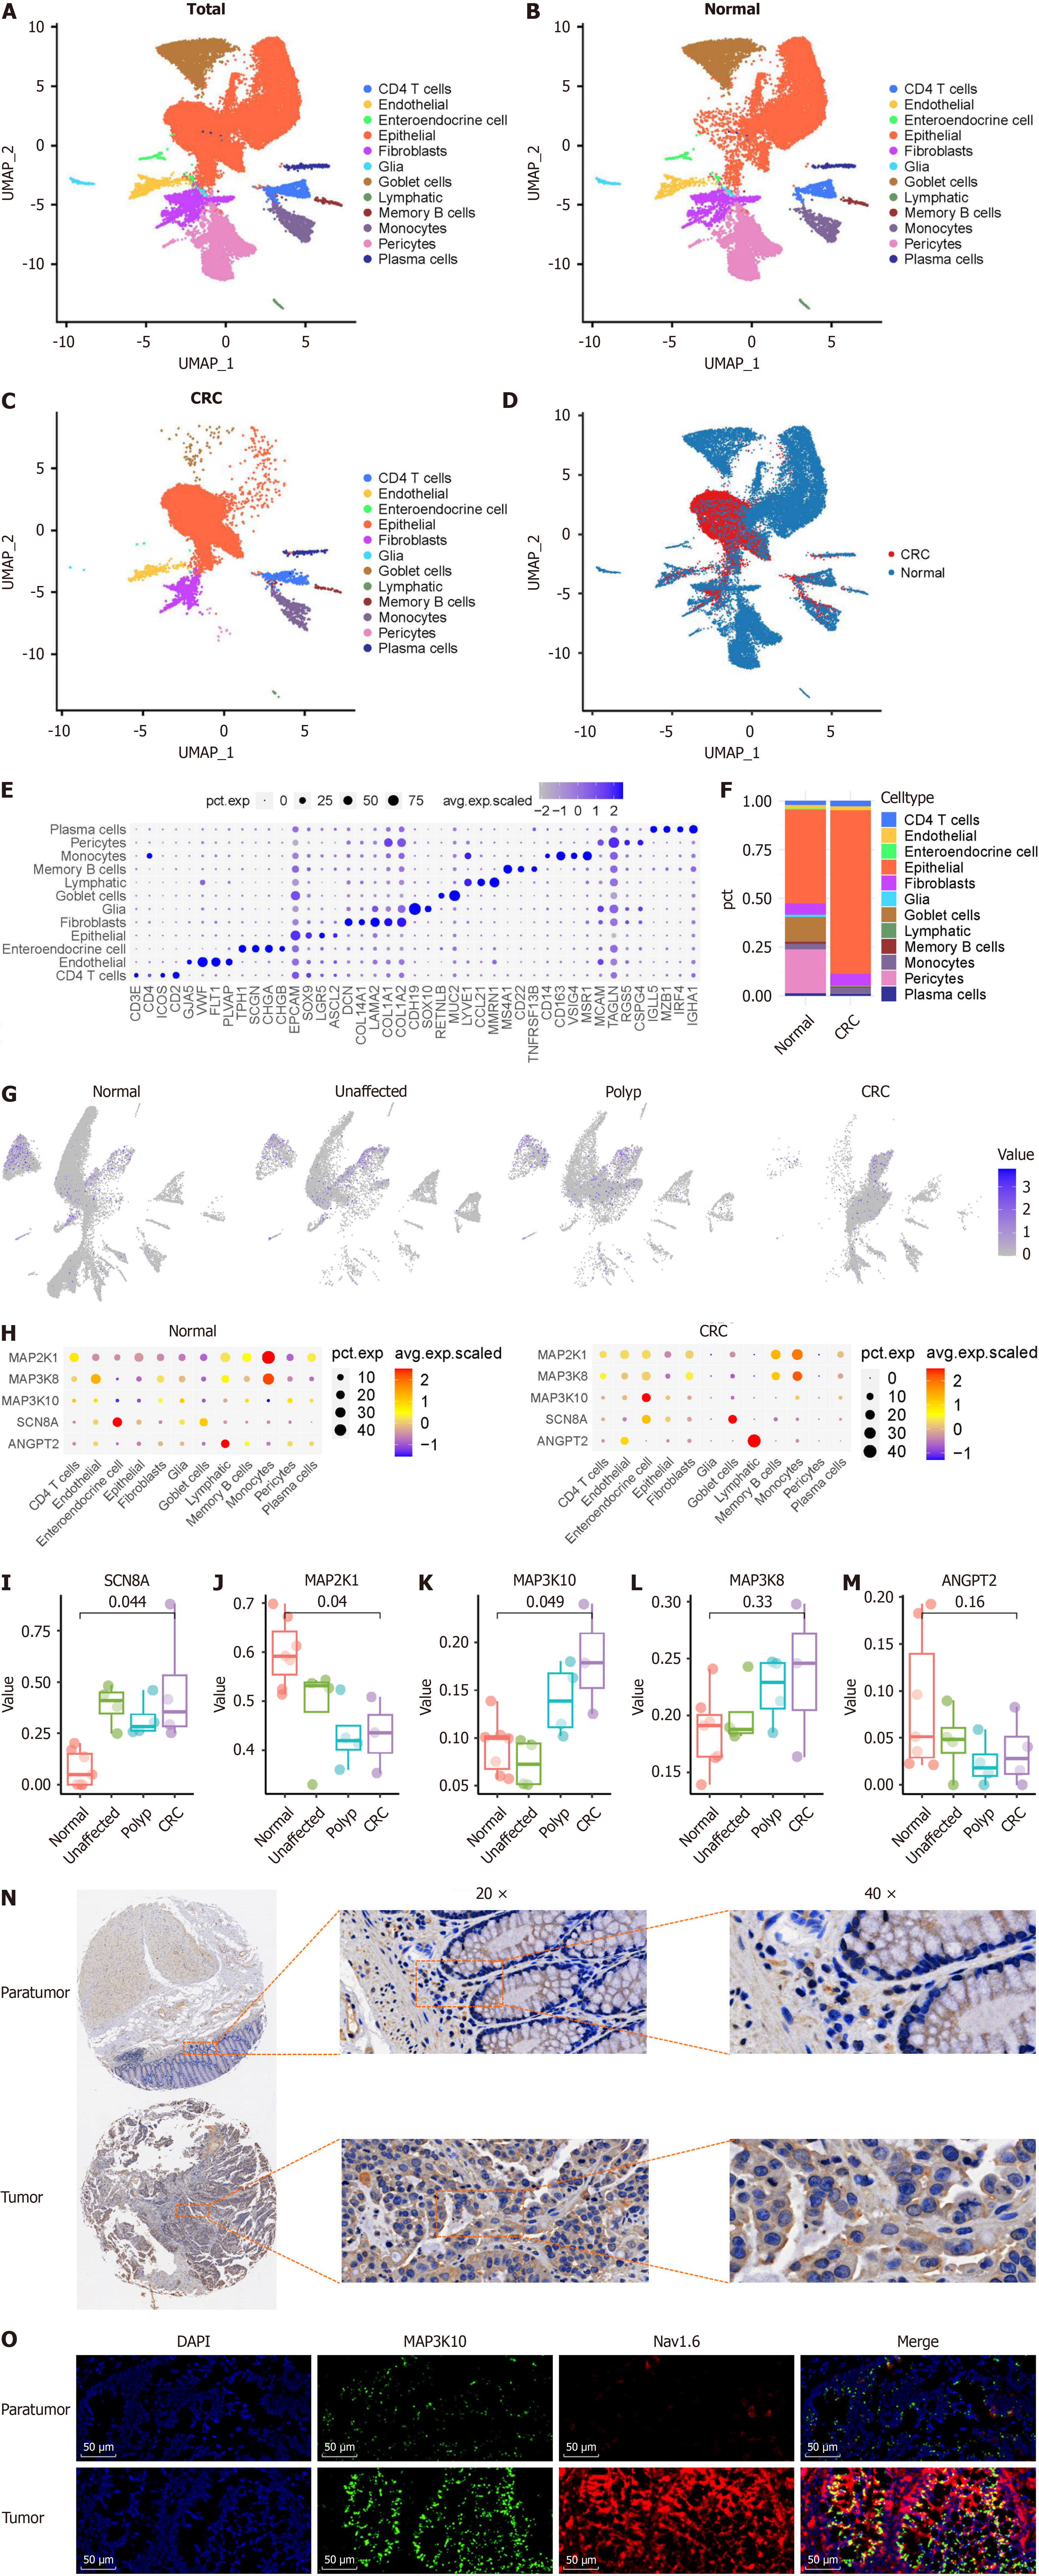
Figure 4 Expression distribution of top differentially expressed genes enriched in different cell types by KEGG analysis.
A-D: UMAP visualization of single cells in normal colon tissue and tumor tissue. Each dot represents a cell, color-coded by cell type; E: Dot plot showing the top three marker genes for each identified cell type. The size of each dot indicates the proportion of the cell population expressing each gene, while the color reflects the expression level; F: Bar graph representing the average proportion of different cell types in normal and tumor tissues; G: UMAP distribution of Nav1.6 expression in different cell types in normal colon tissue and tumor tissue; H: Bubble plot showing the relative expression of differentially expressed genes enriched according to weighted correlation network analysis. The color and size of the dot represent the average expression and the percentage of positively expressed hepatocytes in each cluster, respectively; I-M: Expression of Nav1.6-related MAPK genes in epithelial cells in different stages of colorectal cancer; N: Tumor tissue microarray analysis of expression of MAP3K10 in tumor tissues and paratumor tissues; O: Immunofluorescence analysis of expression of MAP3K10 and Nav1.6 in tumor tissues and paratumor tissues. CRC: Colorectal cancer.
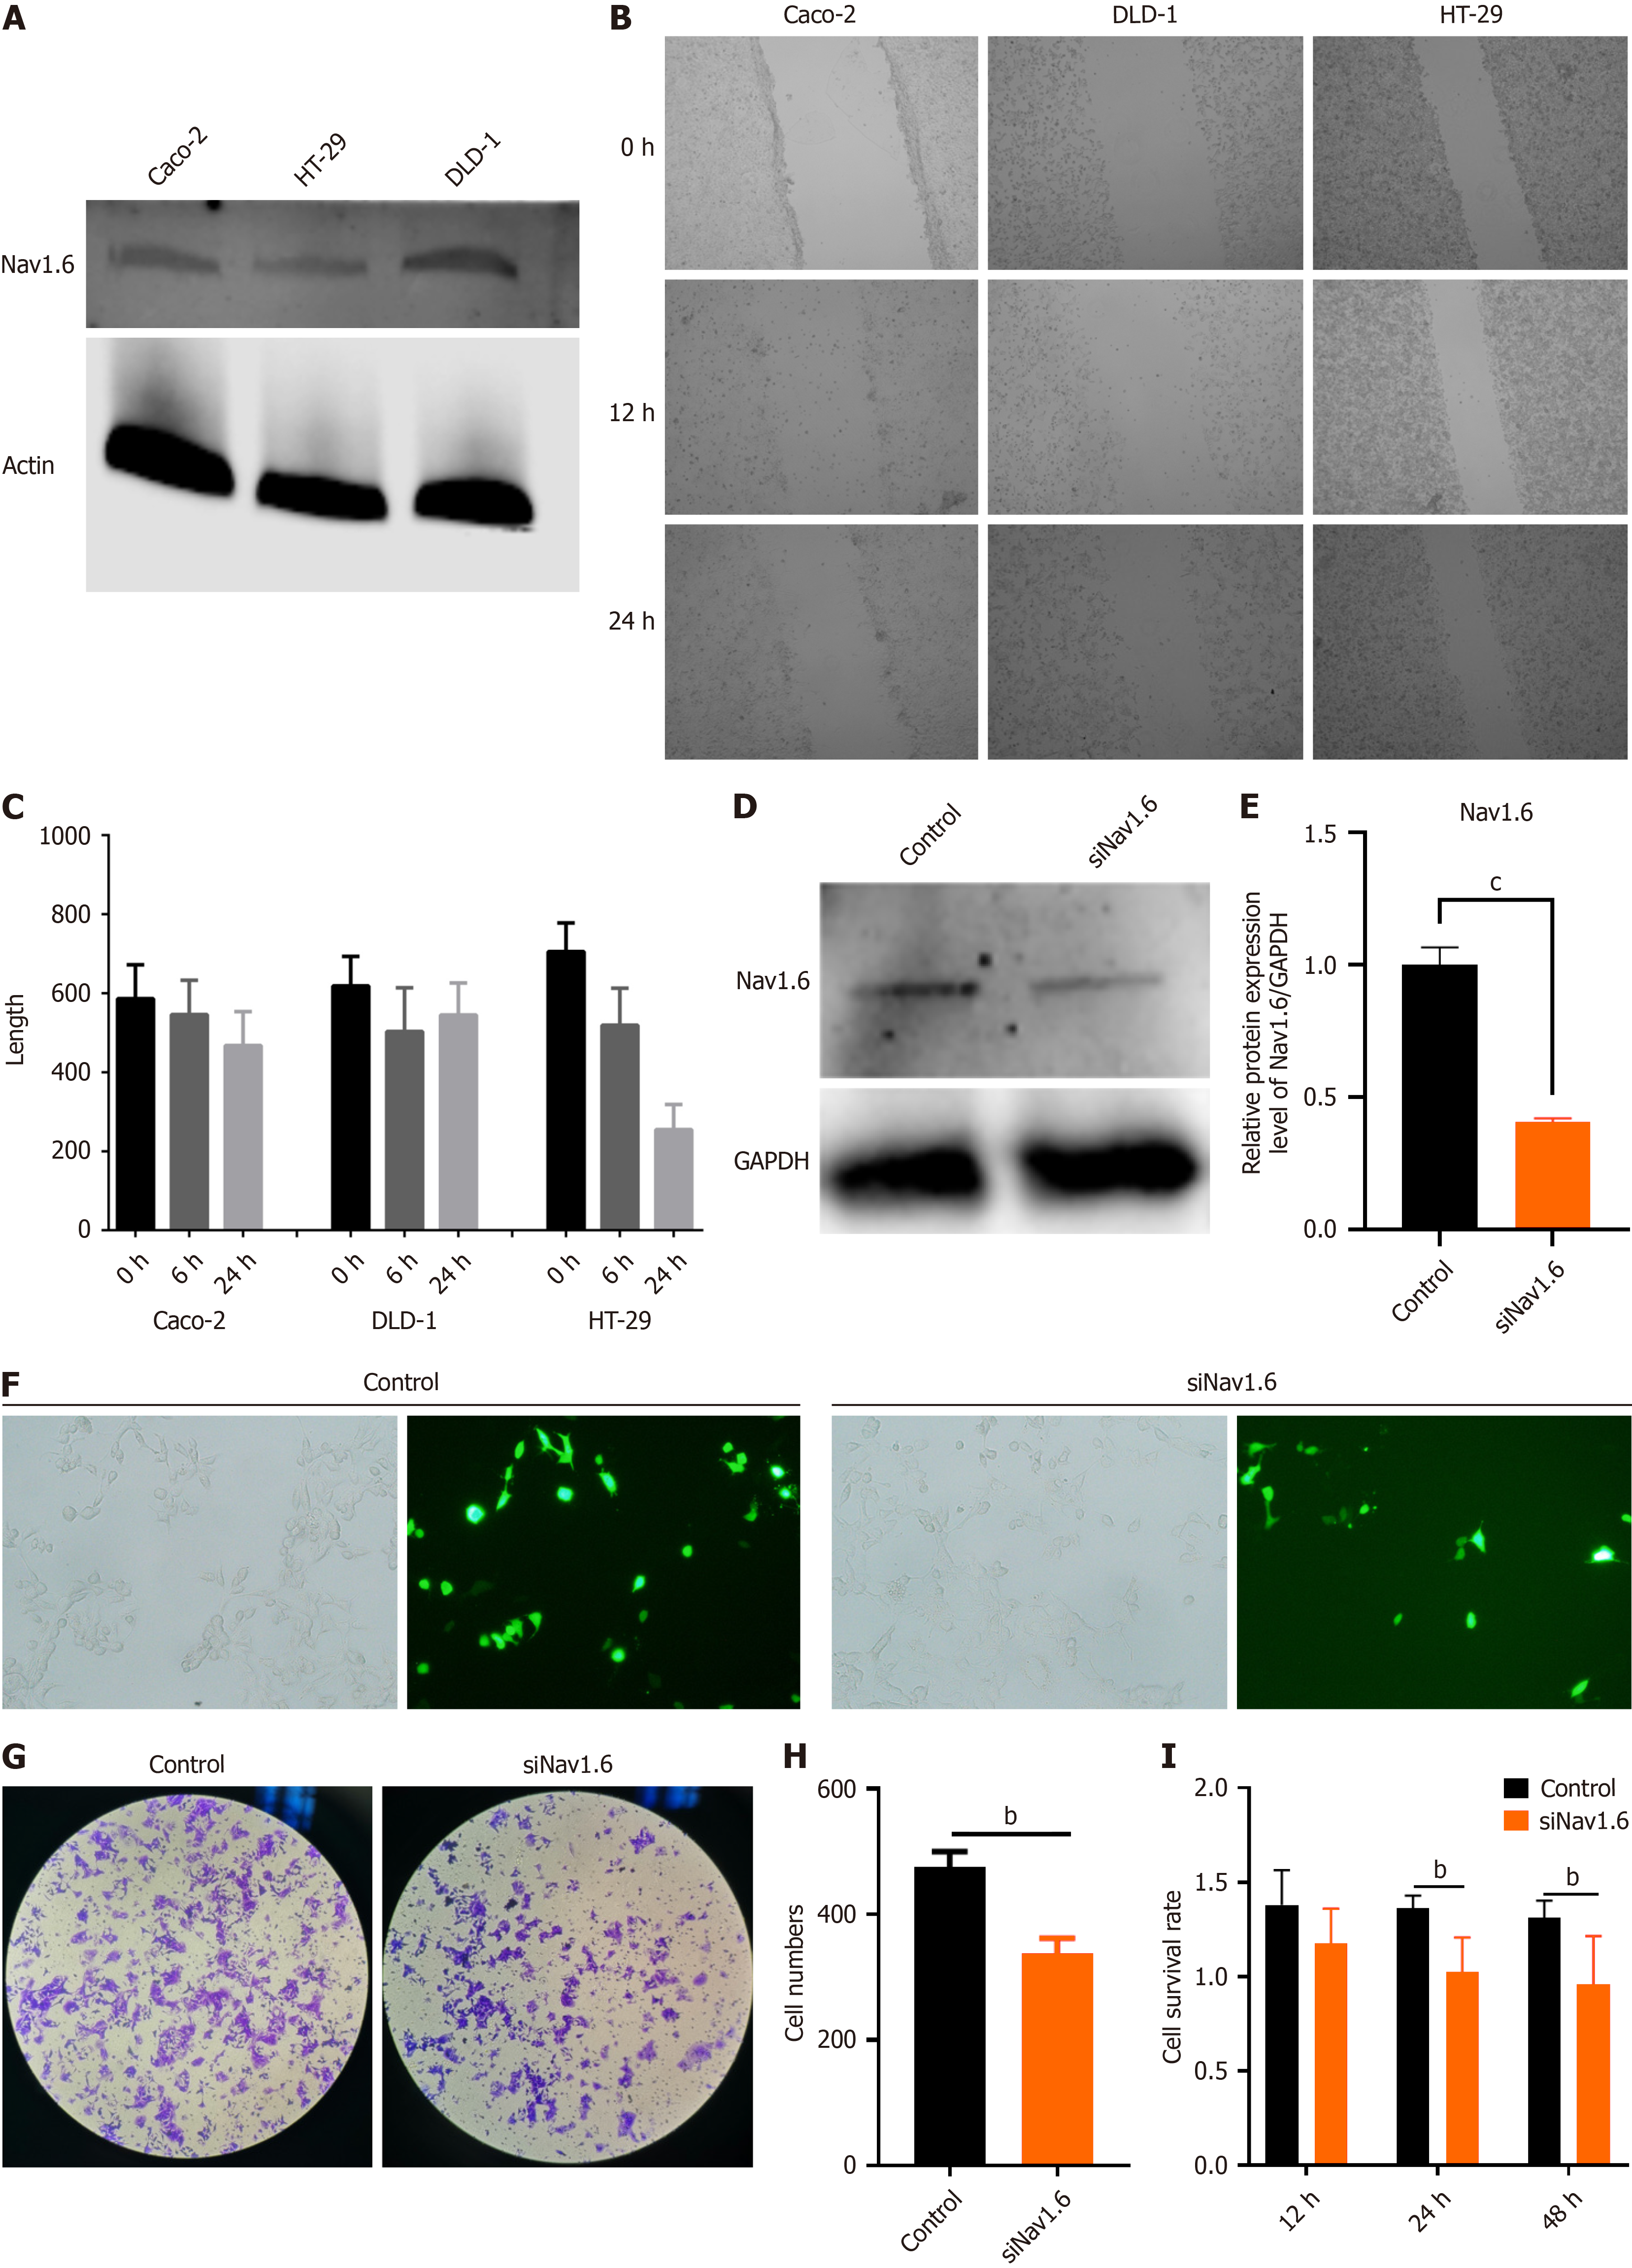
Figure 5 Knockdown of Nav1.
6 inhibits the invasion and proliferation of colorectal cancer cells. A: Expression of Nav1.6 in three different human colorectal cancer cell lines; B and C: Wound healing assays of cell migration in CaCo2, HT-29, and DLD-1 cells. Images of wound closure are shown at the indicated time points (0, 12, and 24 hours) after scratching; D and E: Expression of Nav1.6 in DLD-1 cells before and after siRNA-mediated interference; F: Images of DLD-1 cells after transfection with Control siRNA or siNav1.6; G: Transwell invasion assay before and after Nav1.6 knockdown in DLD-1 cells; H: Statistical analysis of the Transwell invasion assay results; I: Cell viability of DLD1 cells at different time points after transfection with SiNav1.6. bP < 0.01; cP < 0.001.
Figure 6 Knockdown of Nav1.
6 inhibits the RAF-MAPK signaling pathway. A: Volcano plot of differentially expressed genes (DEGs) before and after Nav1.6 knockdown; B: Heatmap of the top DEGs before and after Nav1.6 knockdown. Red indicates upregulated DEGs, and blue indicates downregulated DEGs; C: Expression of MAPK-related proteins MAP3K10, c-RAF, p-cRAF, ERK, p-ERK, and MEK1/2 before and after Nav1.6 knockdown in DLD-1 cells; D-G: Ratios of MAP3K10 to β-actin, p-ERK1/2 to total ERK1/2, p-cRAF to total c-RAF, and MEK1/2 to GAPDH in DLD-1 cells before and after Nav1.6 knockdown. aP < 0.05; cP < 0.001; dP < 0.0001; NS: Not significant.
- Citation: Zhao LM, Hong WY, Xu JG, Lin SQ, Liu MS, Wang LH, Jiang XL, Sang M, Lv YB. Nav1.6 drives colorectal cancer proliferation and invasion through MAPK signaling pathway. World J Gastrointest Oncol 2025; 17(7): 105264
- URL: https://www.wjgnet.com/1948-5204/full/v17/i7/105264.htm
- DOI: https://dx.doi.org/10.4251/wjgo.v17.i7.105264


