©The Author(s) 2025.
World J Gastrointest Oncol. Mar 15, 2025; 17(3): 98746
Published online Mar 15, 2025. doi: 10.4251/wjgo.v17.i3.98746
Published online Mar 15, 2025. doi: 10.4251/wjgo.v17.i3.98746
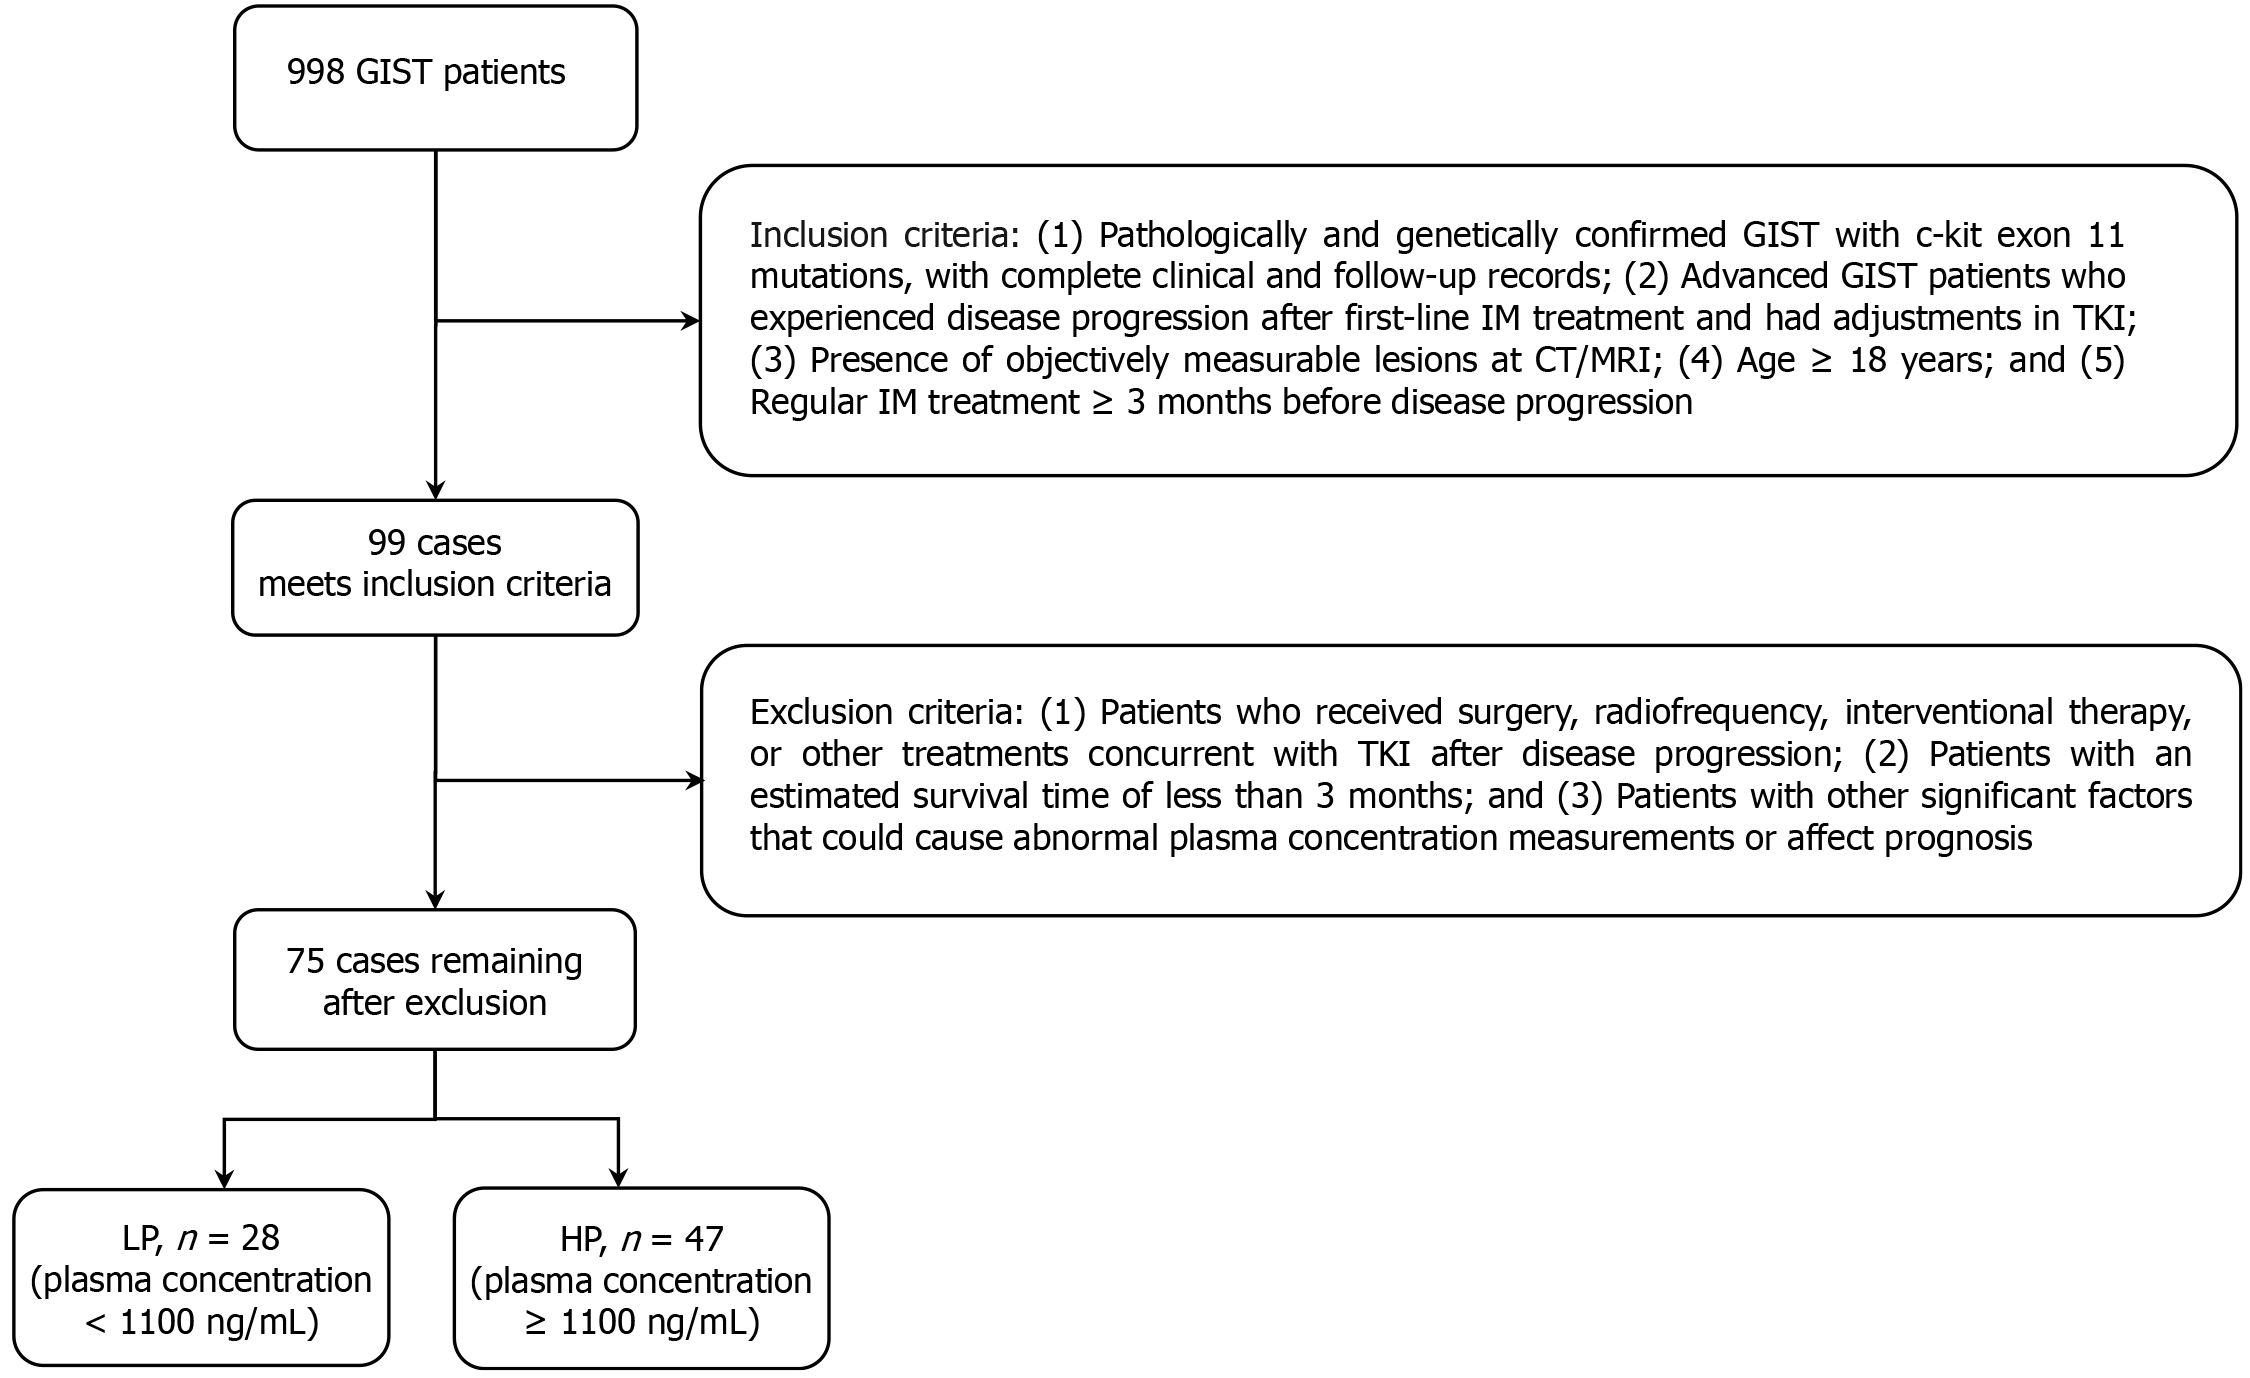
Figure 1 Flowchart of patient selection.
A total of 998 patients diagnosed with gastrointestinal stromal tumors (GISTs) were extracted from our database; 75 patients ultimately met the eligibility criteria for the final analysis. Based on their drug plasma concentrations, these patients were categorized into two groups: Low plasma (LP) concentration group (< 1100 ng/mL) and high plasma (HP) concentration group (≥ 1100 ng/mL). IM: Imatinib; TKI: Tyrosine kinase inhibitor.
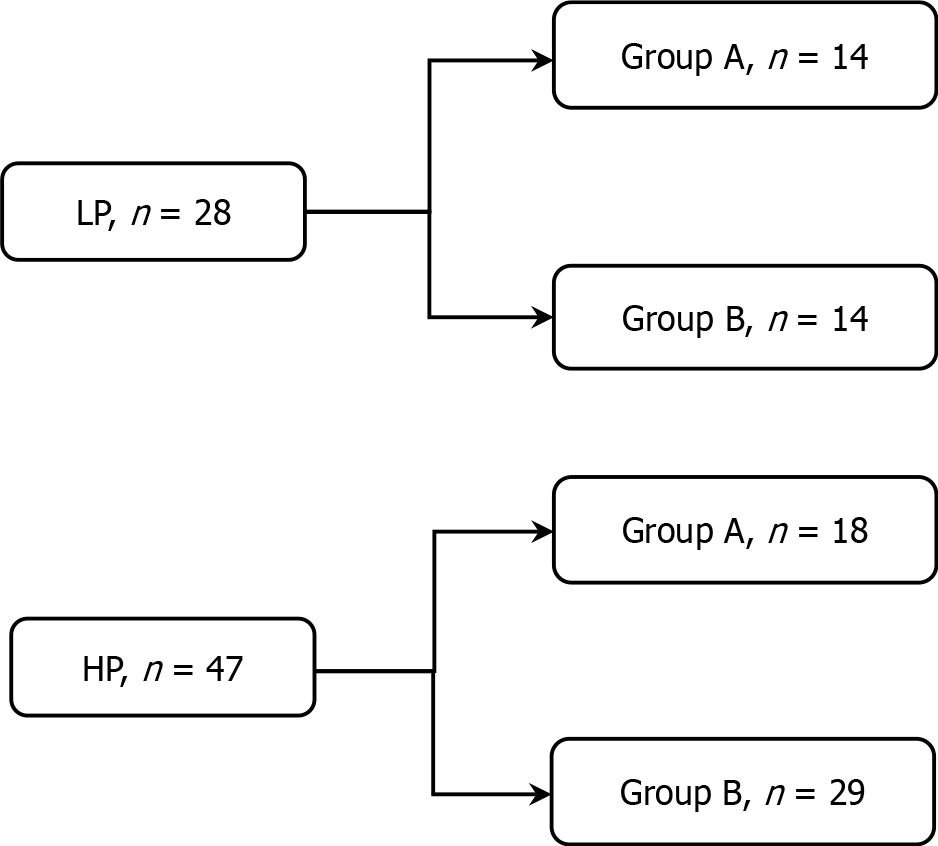
Figure 2 Diagram of patient groups.
Each group was further subdivided into Group A (dose-escalation group) and Group B (drug switch group) based on whether they received increased imatinib dosage (600 mg/day) or switched to another tyrosine kinase inhibitor. LP: Low plasma concentration group; HP: High plasma concentration group.
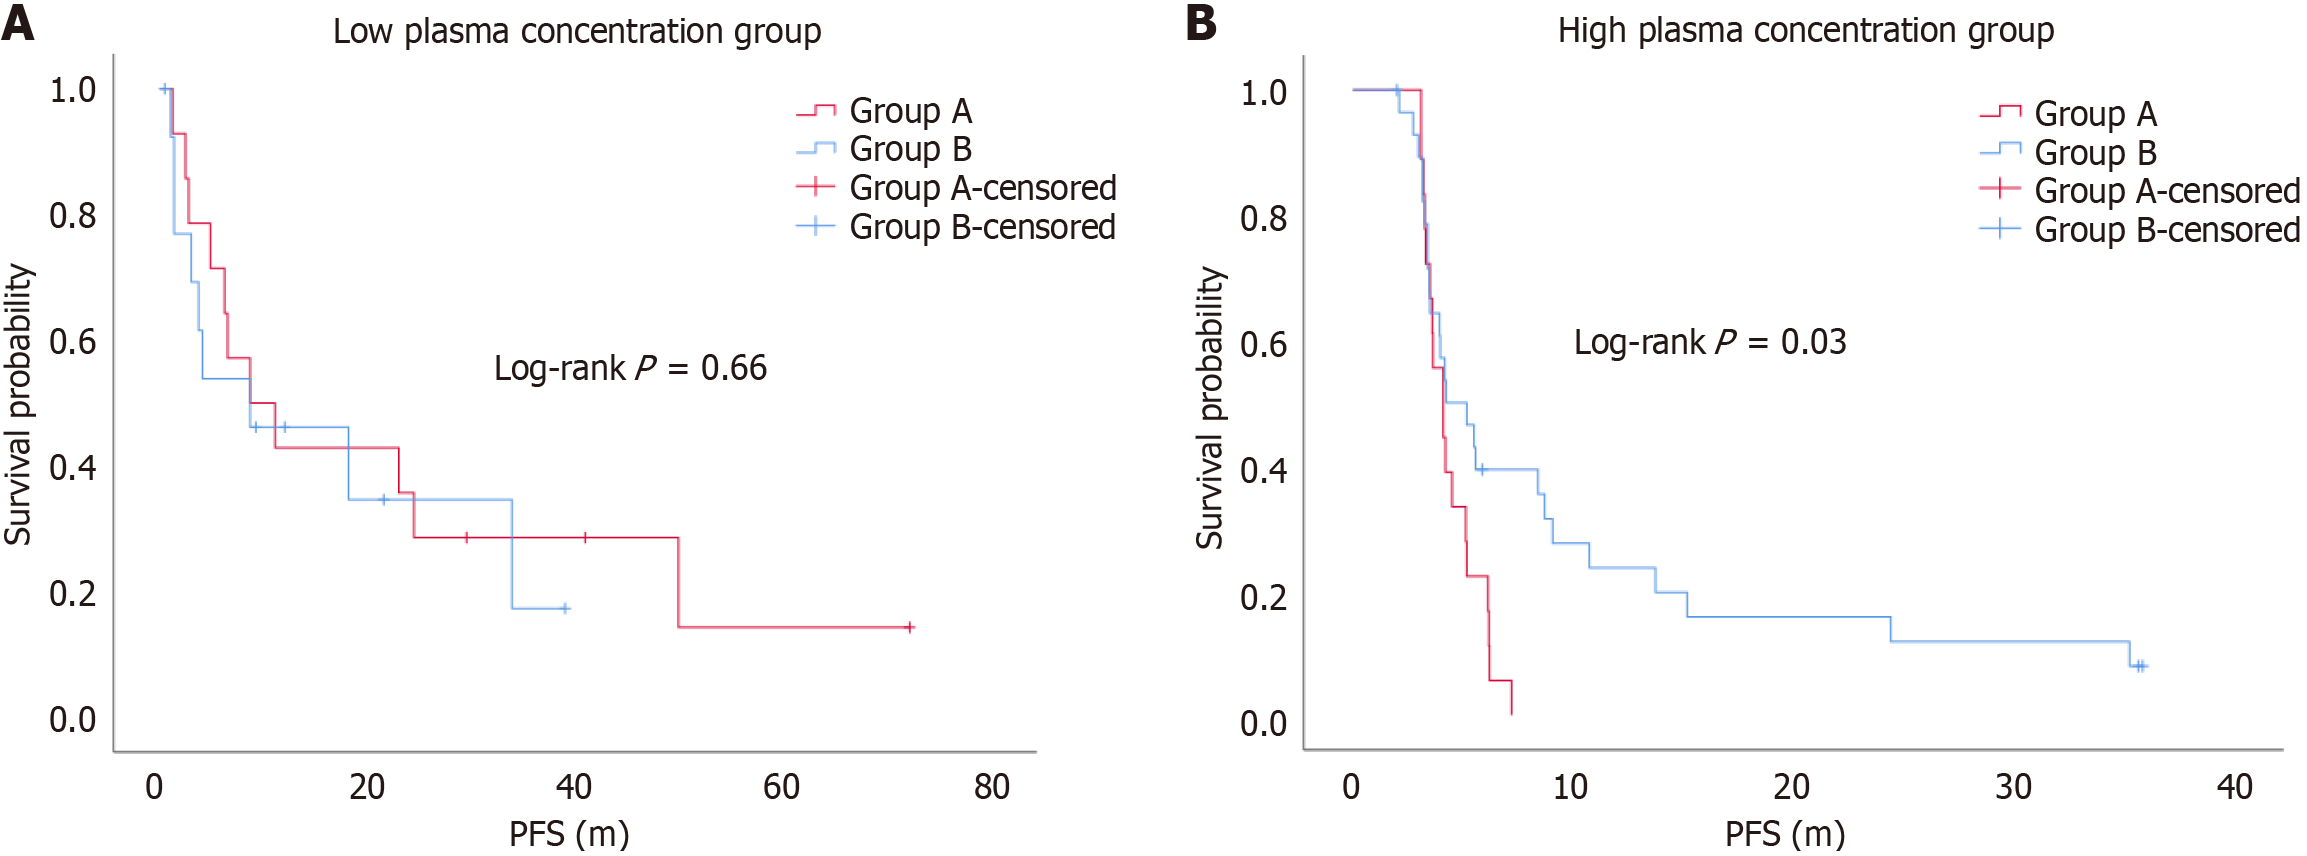
Figure 3 Kaplan-Meier curves of progression-free survival between dose-escalation group (Group A) and drug switch group (Group B).
A: The Kaplan-Meier curves indicated that there was no significant difference in progression-free survival (PFS) between the dose-escalation group and drug-switch group in the low plasma concentration group (log-rank P = 0.66); B: The Kaplan-Meier curves indicated that the drug switch group had a longer overall survival than the dose-escalation group (log-rank P = 0.03).
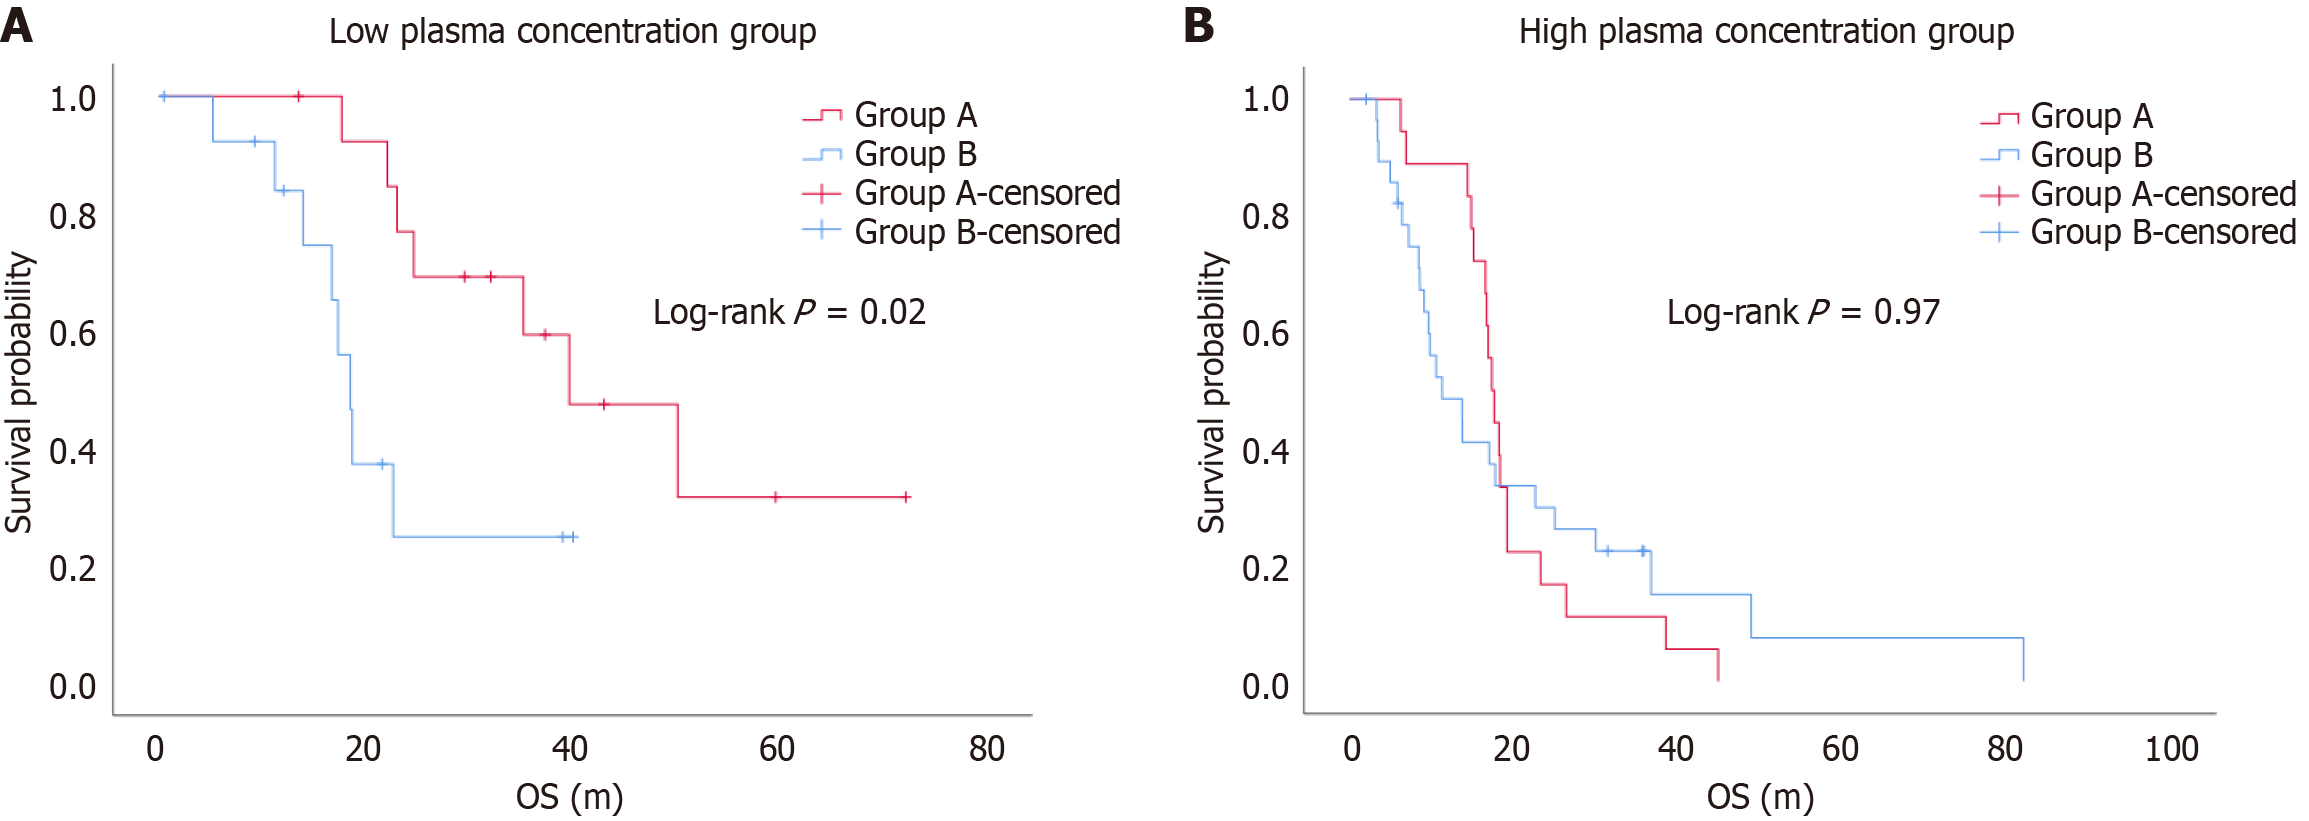
Figure 4 Kaplan-Meier curves of overall survival between the dose-escalation group (Group A) and drug-switch group (Group B).
A: The Kaplan-Meier curves indicated that the dose-escalation group (Group A) had a longer overall survival (OS) than the drug-switch group (Group B) (log-rank P = 0.02); B: The Kaplan-Meier curves indicated that there was no significant difference in OS between the dose-escalation group (Group A) and drug-switch group (Group B) (log-rank P = 0.97).
- Citation: Li HT, Du YY, Huang Z, Li JJ, Zhang J. Significance of monitoring imatinib plasma concentration in second-line treatment decisions for c-kit 11 gene-mutated gastrointestinal stromal tumors. World J Gastrointest Oncol 2025; 17(3): 98746
- URL: https://www.wjgnet.com/1948-5204/full/v17/i3/98746.htm
- DOI: https://dx.doi.org/10.4251/wjgo.v17.i3.98746


