©The Author(s) 2025.
World J Gastrointest Oncol. Mar 15, 2025; 17(3): 101174
Published online Mar 15, 2025. doi: 10.4251/wjgo.v17.i3.101174
Published online Mar 15, 2025. doi: 10.4251/wjgo.v17.i3.101174
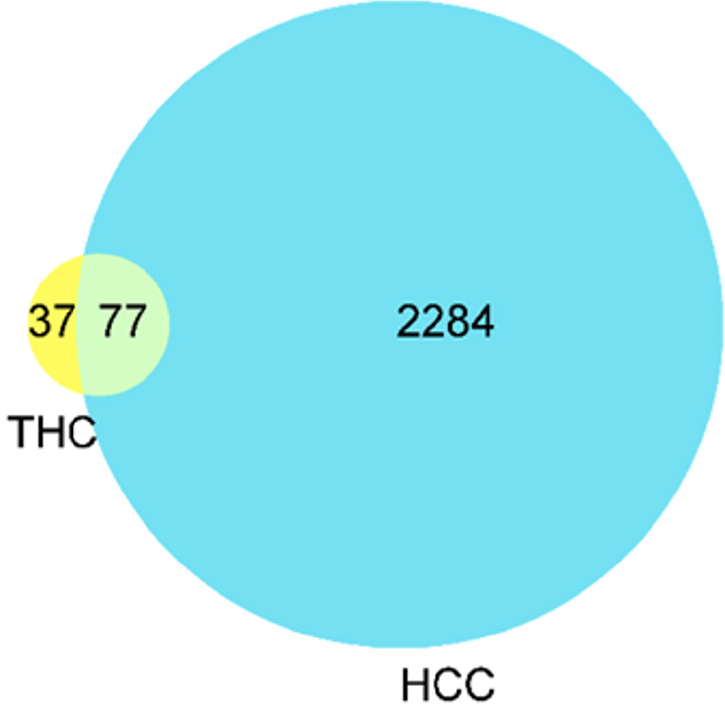
Figure 1 Wayne diagram of tetrahydrocurcumin and hepatocellular carcinoma targets.
THC: Tetrahydrocurcumin; HCC: Hepatocellular carcinoma.
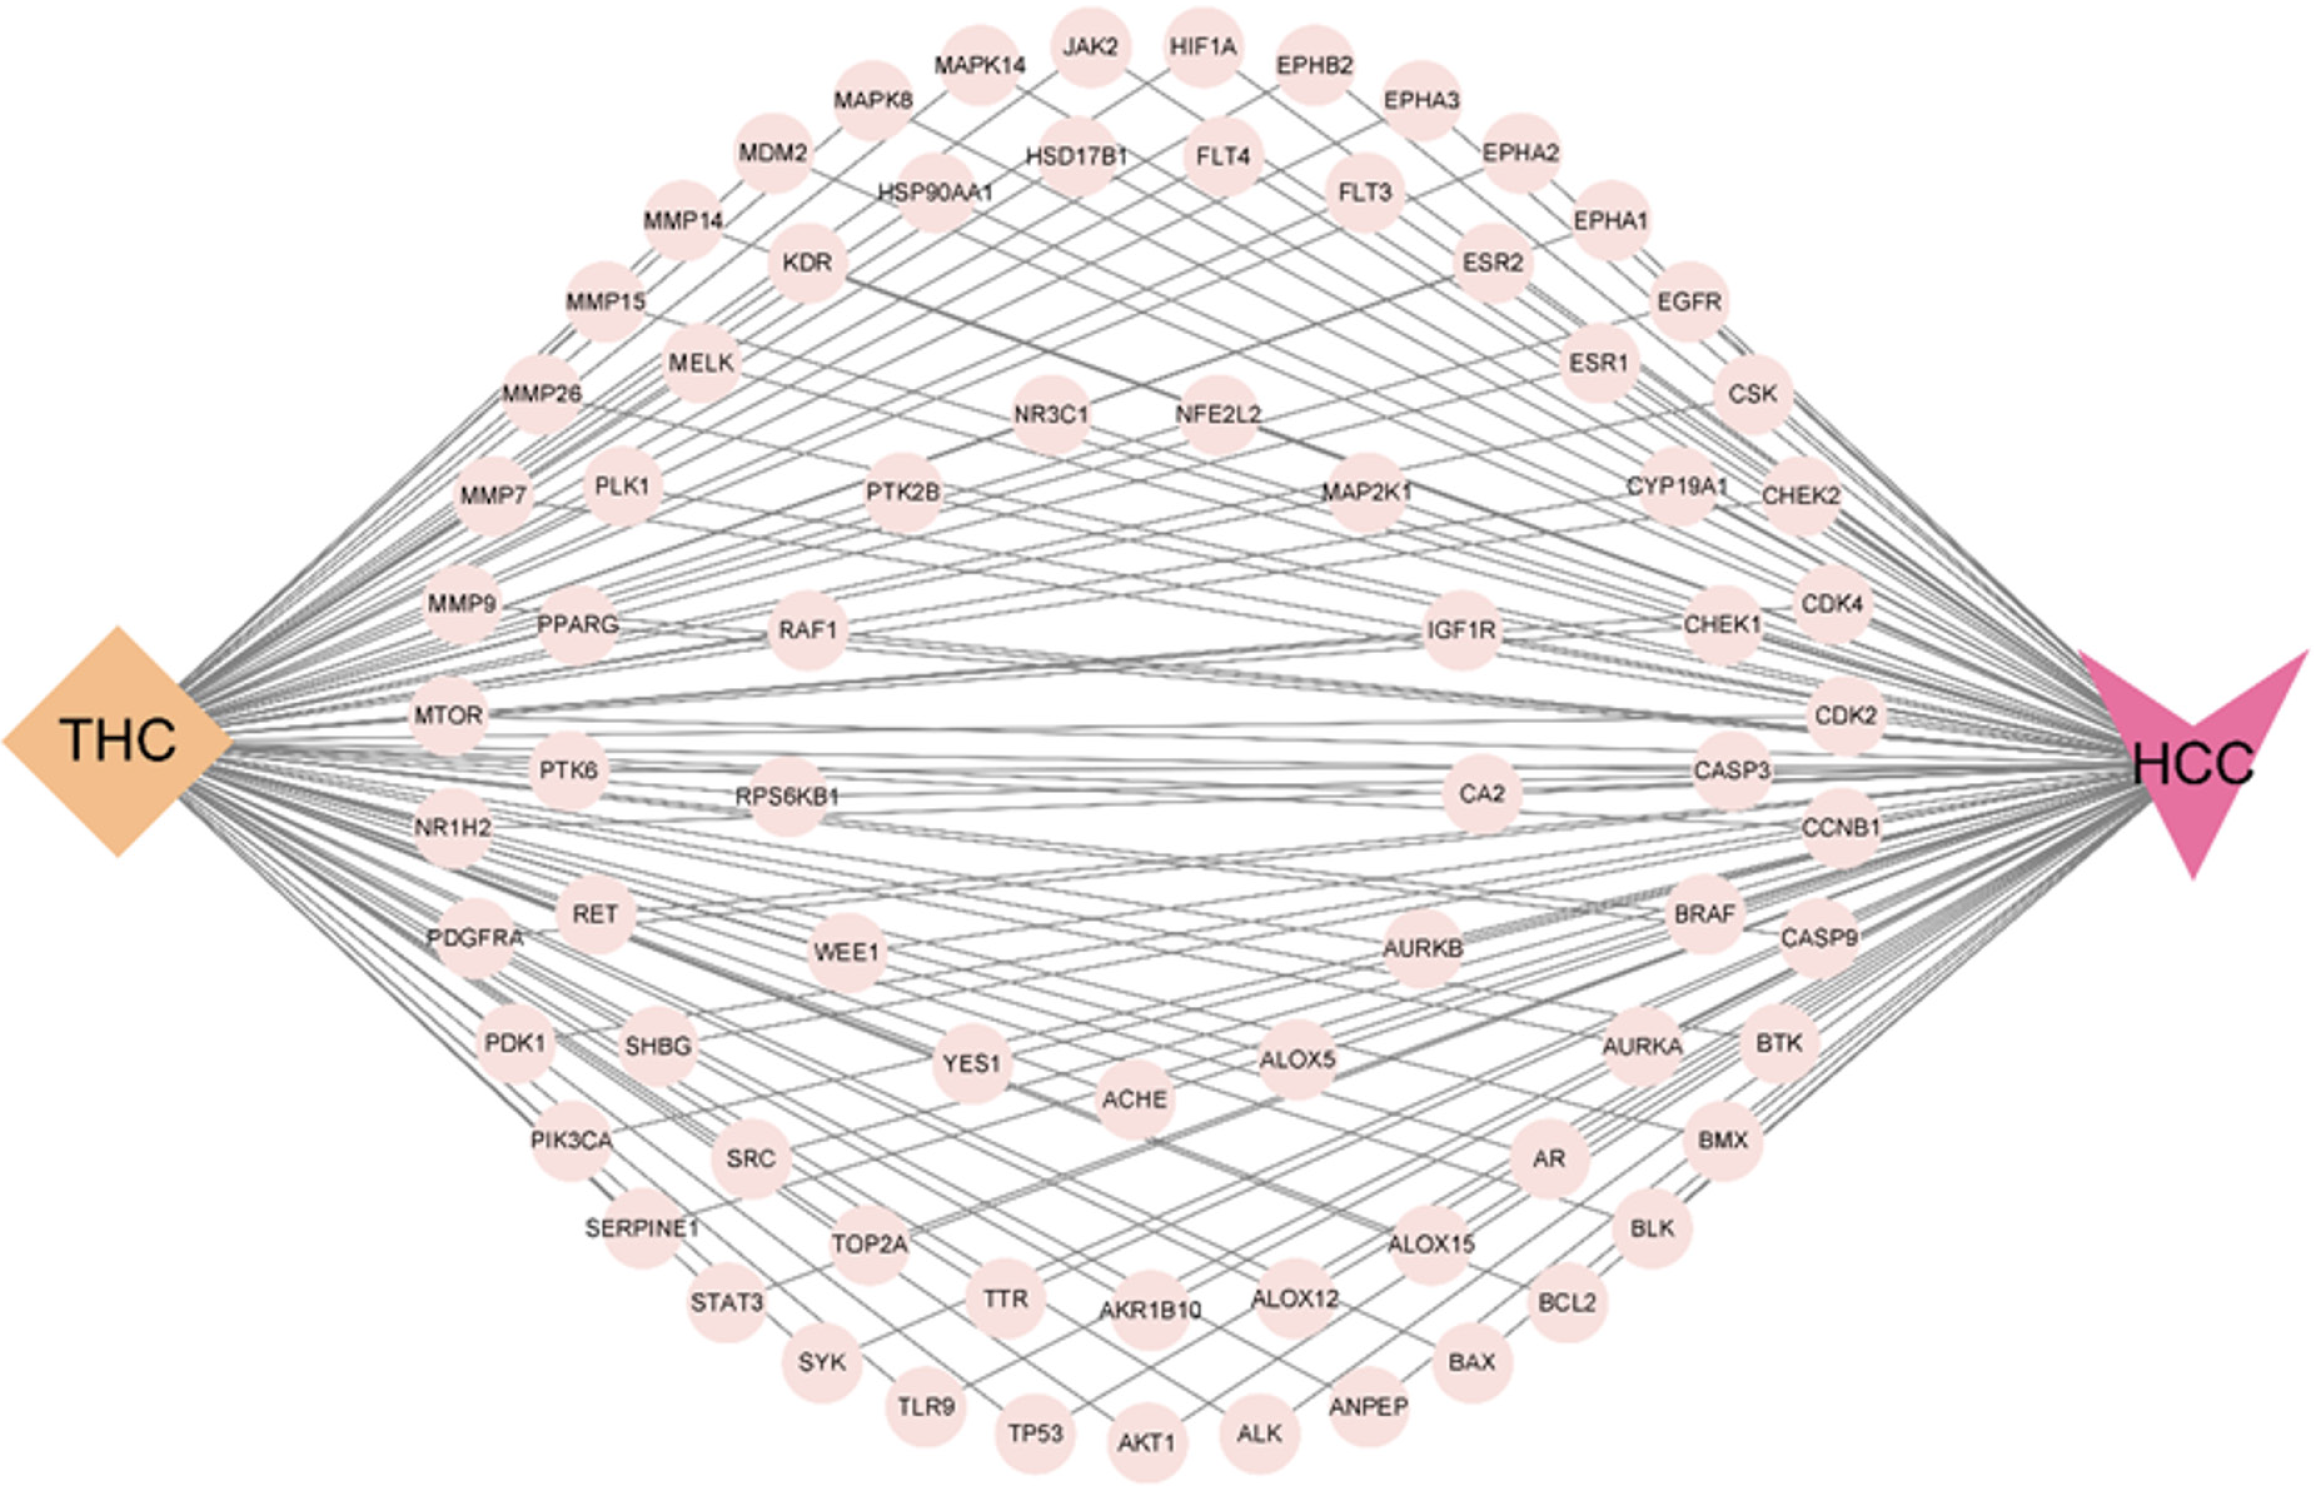
Figure 2 Tetrahydrocurcumin-target-hepatocellular carcinoma network relationship.
THC: Tetrahydrocurcumin; HCC: Hepatocellular carcinoma.
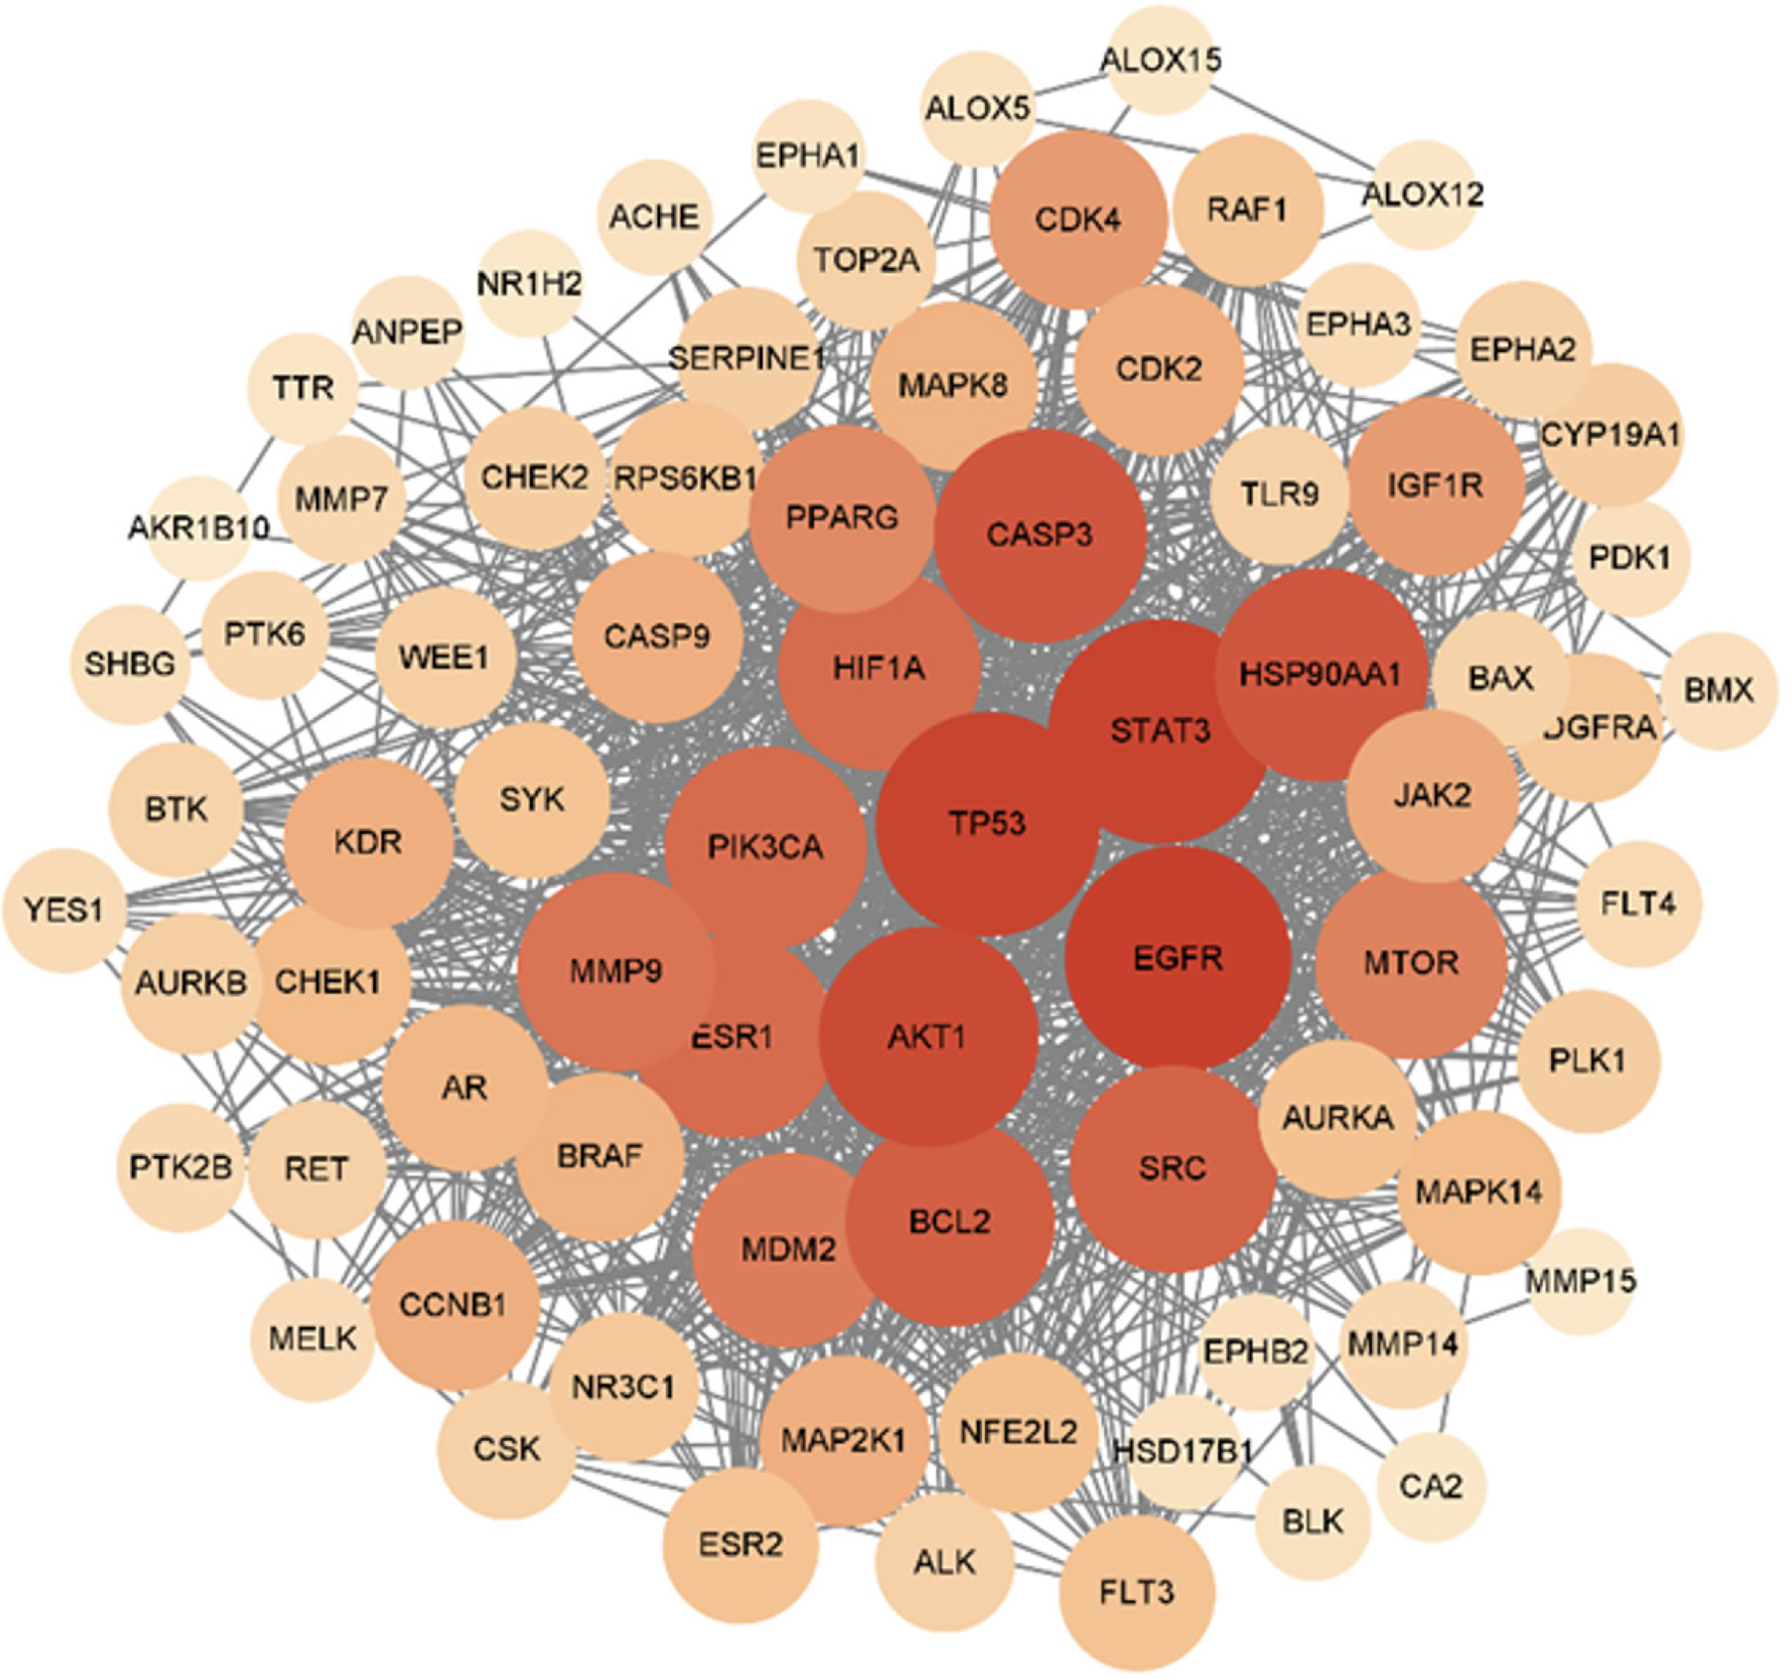
Figure 3 Construction of a protein-protein interaction network for target proteins at the intersection of tetrahydrocurcumin and hepatocellular carcinoma.
Figure 4 Bubble map of tetrahydrocurcumin and hepatocellular carcinoma core targets.
A: Bubble map of GO enrichment analysis of tetrahydrocurcumin (THC) and hepatocellular carcinoma (HCC) core targets; B: Bubble map of KEGG enrichment analysis of THC and HCC core targets. BP: Biological process; CC: Cell component; MF: Molecular function.
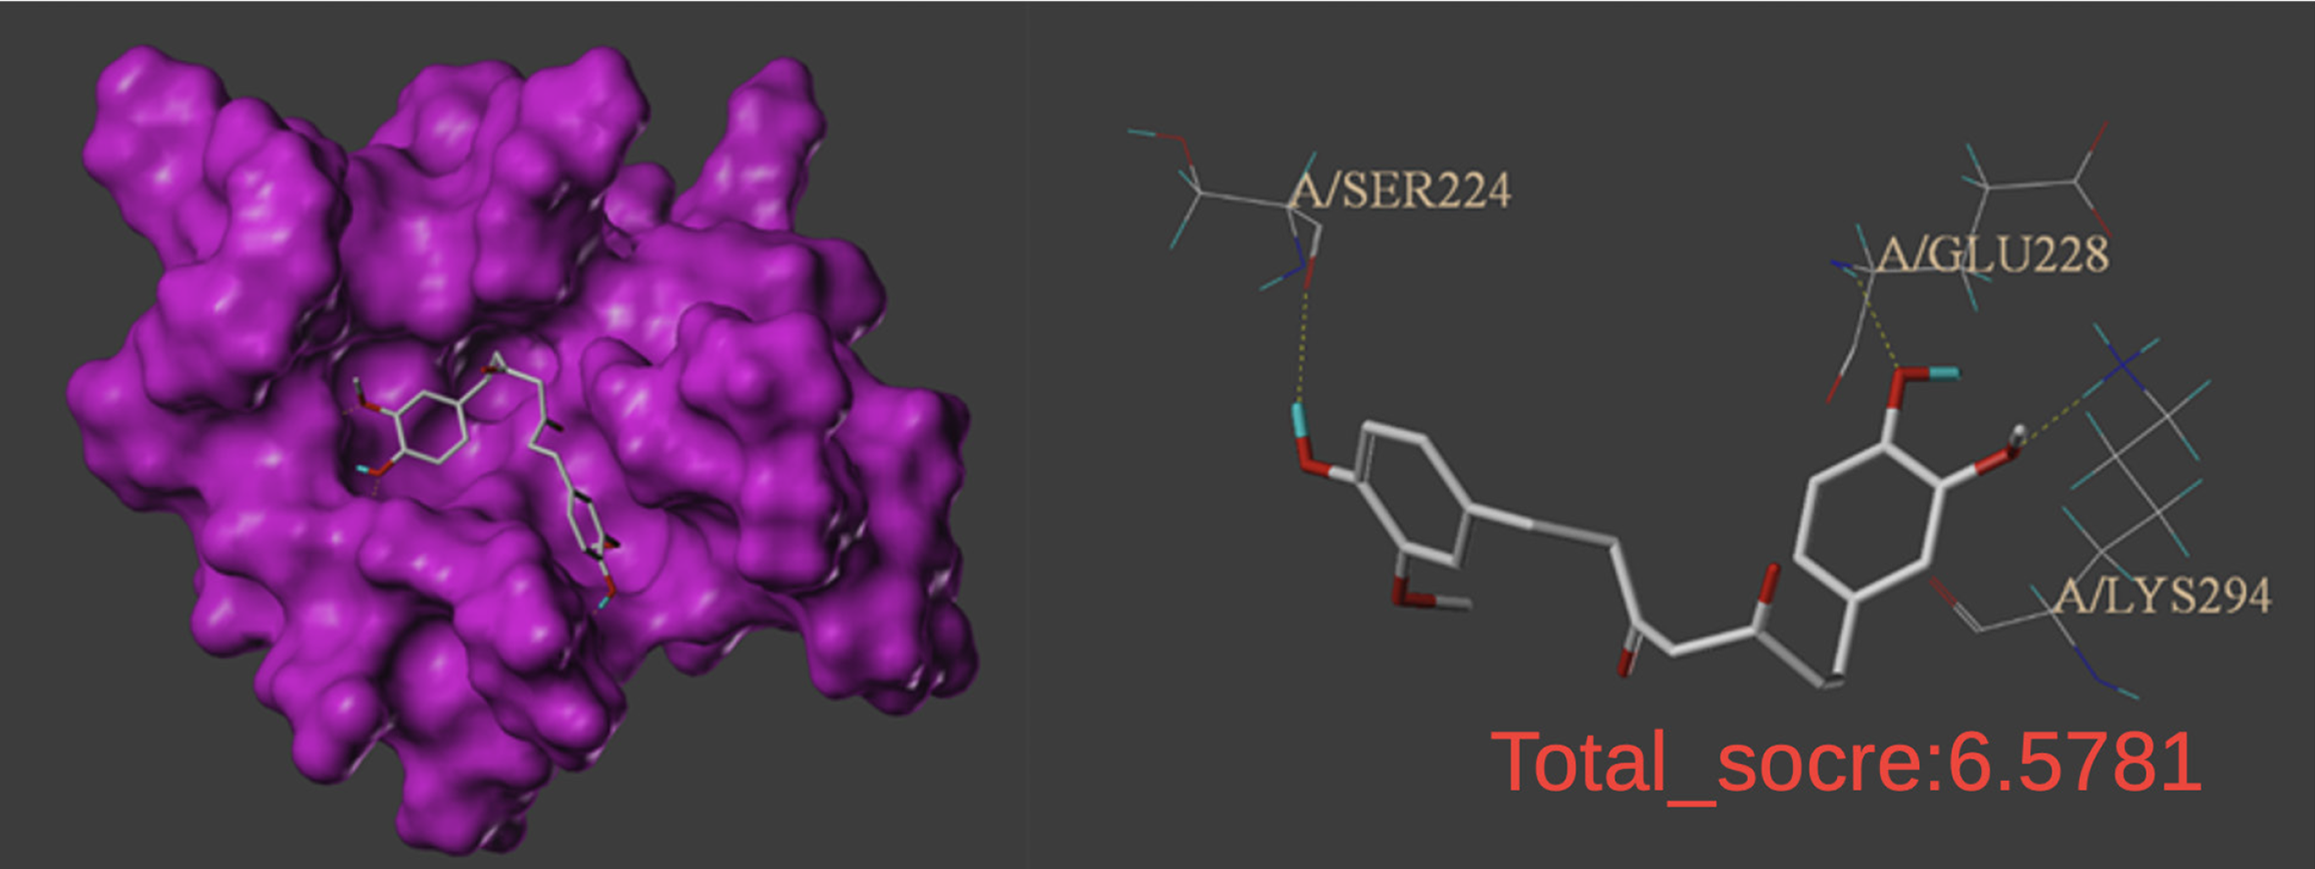
Figure 5 Schematic diagram of molecular docking between tetrahydrocurcumin and P53 protein (PDB ID: 1XQH).
Figure 6 Detection of HepG2 and Huh7 cell viability.
A: Statistical chart showing the survival rates of HepG2 cells treated with tetrahydrocurcumin (THC) for 24, 48, and 72 hours; B: The survival rate of Huh7 cells treated with THC for 24, 48, and 72 hours. The cells were divided into a control group (0 μmol/L THC) and six THC treatment groups (20, 40, 60, 80, 100, and 120 μM). Data are presented as the mean ± SD, n = 3. Compared to the control group, aP < 0.05; bP < 0.01; THC: Tetrahydrocurcumin.
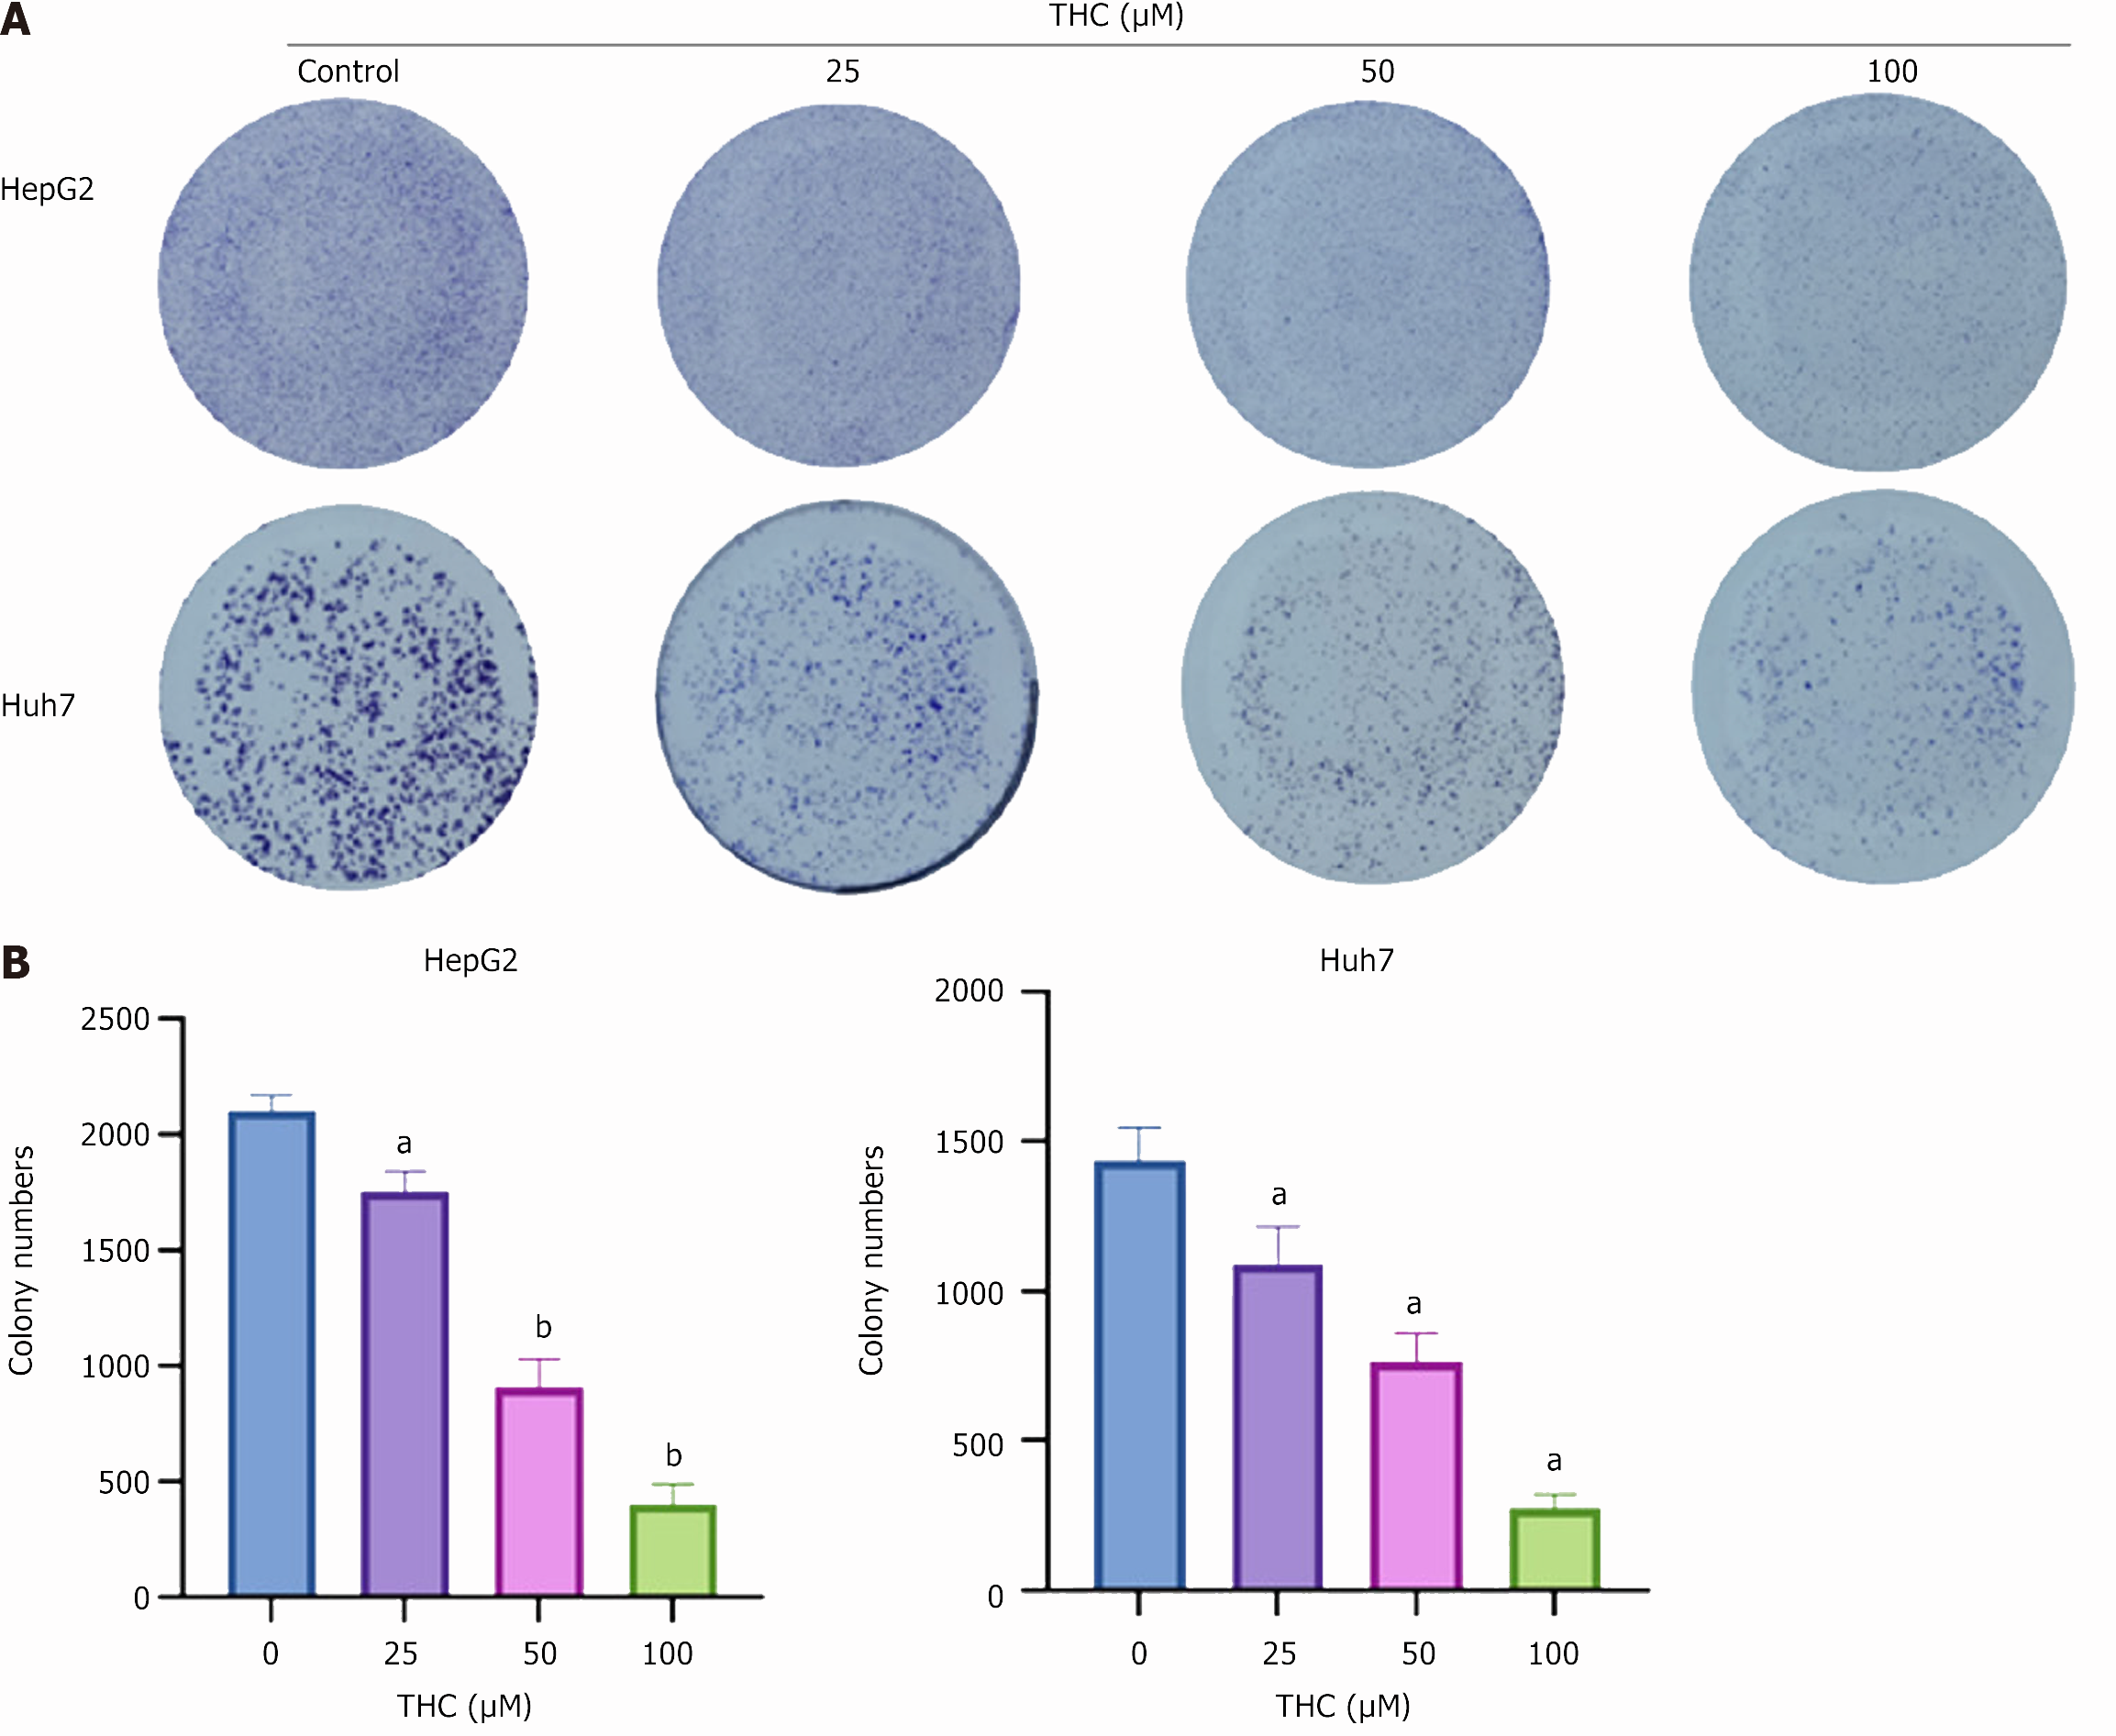
Figure 7 Cell cloning experiment to detect the proliferation capacity of HepG2 and Huh7 cells treated with different concentrations of tetrahydrocurcumin.
A: Tetrahydrocurcumin (THC) had a greater effect on the proliferation of hepatocellular carcinoma cells as the treatment concentration increased (25, 50, or 100 μmol/L for 2 weeks); B: Graph of the cell cloning ability of HepG2 and Huh7 cells treated with THC (25, 50, or 100 μmol/L) for 2 weeks. All data are presented as the mean ± SD, n = 3. Compared to the control group, aP < 0.05; bP < 0.01; THC: Tetrahydrocurcumin.
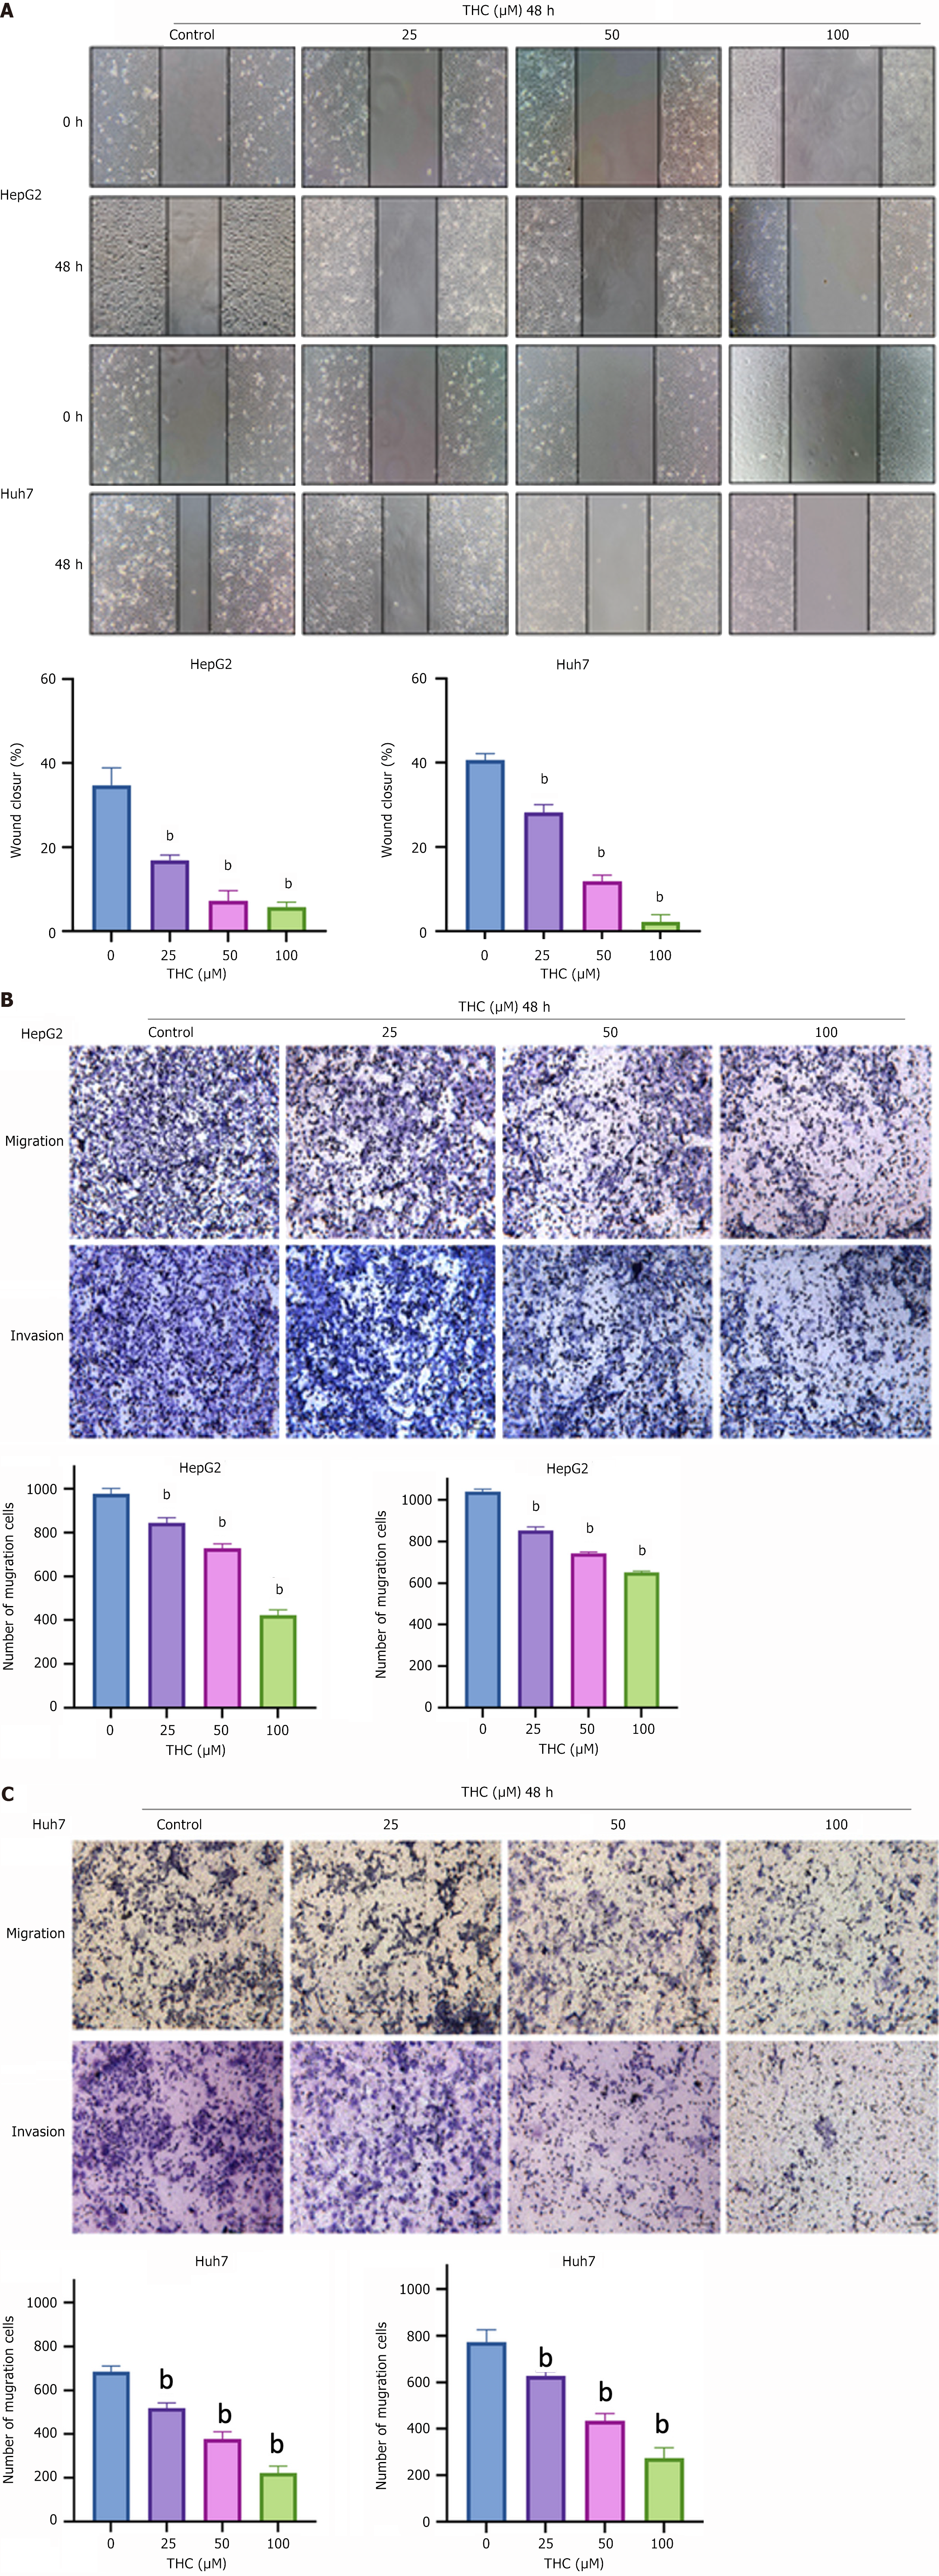
Figure 8 Effect of tetrahydrocurcumin on the migration and invasion of HepG2 and Huh7 cells.
A: The migration capacity of HepG2 cells and Huh7 cells treated with different concentrations of tetrahydrocurcumin (THC) (25, 50, or 100 μmol/L) for 48 hours was detected using a wound-healing assay. All data are expressed as mean ± SD, n = 3. Compared to the control group, bP < 0.01; B: Transwell assays were conducted to determine the inhibitory effect of different concentrations of THC (25, 50, or 100 μmol/L) on the migration of HepG2 cells. Similarly, matrix glue was used to demonstrate the inhibitory effect of THC on cell invasion, and the number of cells passing through the cell chambers after 48 hours of treatment was statistically analyzed. All data are expressed as the mean ± SD, n = 3. Compared to the control group, bP < 0.01; C: Transwell assays were conducted to determine whether THC inhibited the migration of Huh7 cells at different concentrations (25, 50, and 100 μmol/L). Matrix glue was used to determine the inhibitory effect of THC on cell invasion. The number of cells that passed through cell chambers after 48 hours of treatment was statistically analyzed. All data are expressed as mean ± SD, n = 3. Compared to the control group, bP < 0.01; THC: Tetrahydrocurcumin.
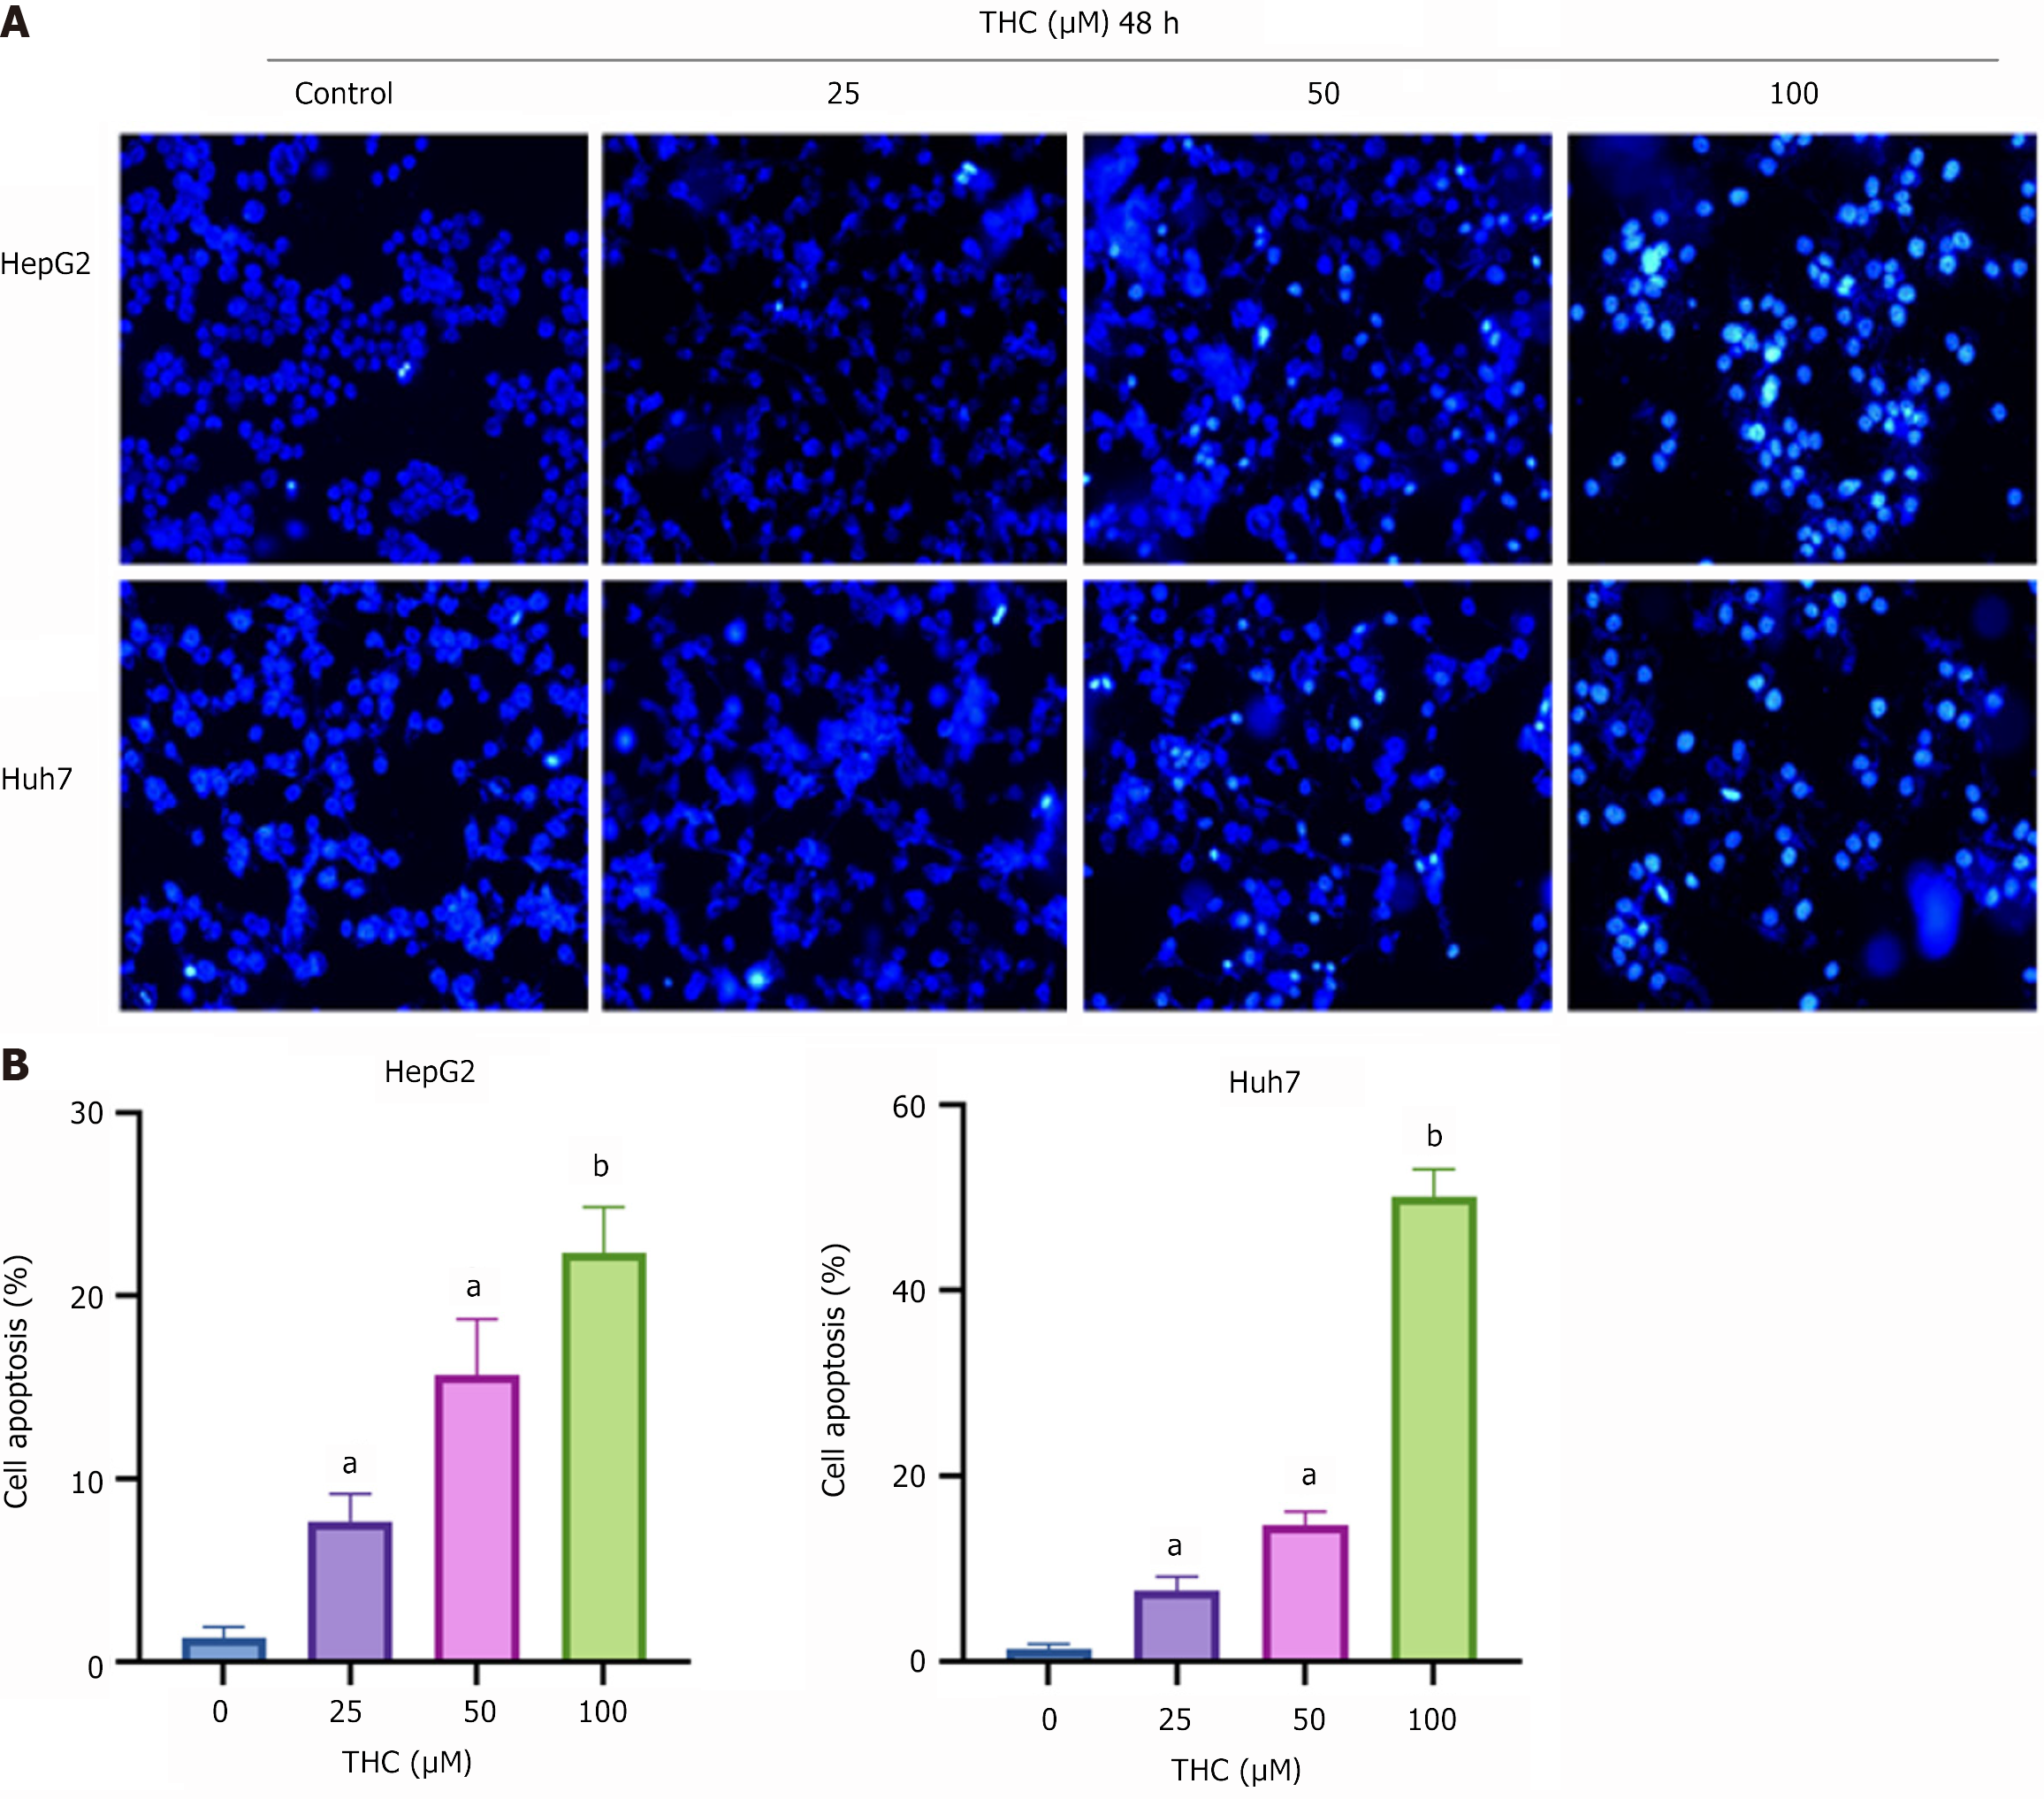
Figure 9 Tetrahydrocurcumin promoted the apoptosis of HepG2 and Huh7 cells.
A: Hoechst 33342 staining was used to detect the apoptosis of HepG2 and Huh7 cells treated with tetrahydrocurcumin (25, 50, or 100 μmol/L) for 48 hours, after photographing under a fluorescence microscope (20 µm); B: Graphs of apoptosis rates of HepG2 and Huh7 cells determined using Hoechst 33342 staining. All data are presented as mean ± SD, n = 3. Compared to the control group, aP < 0.05; bP < 0.01; THC: Tetrahydrocurcumin.
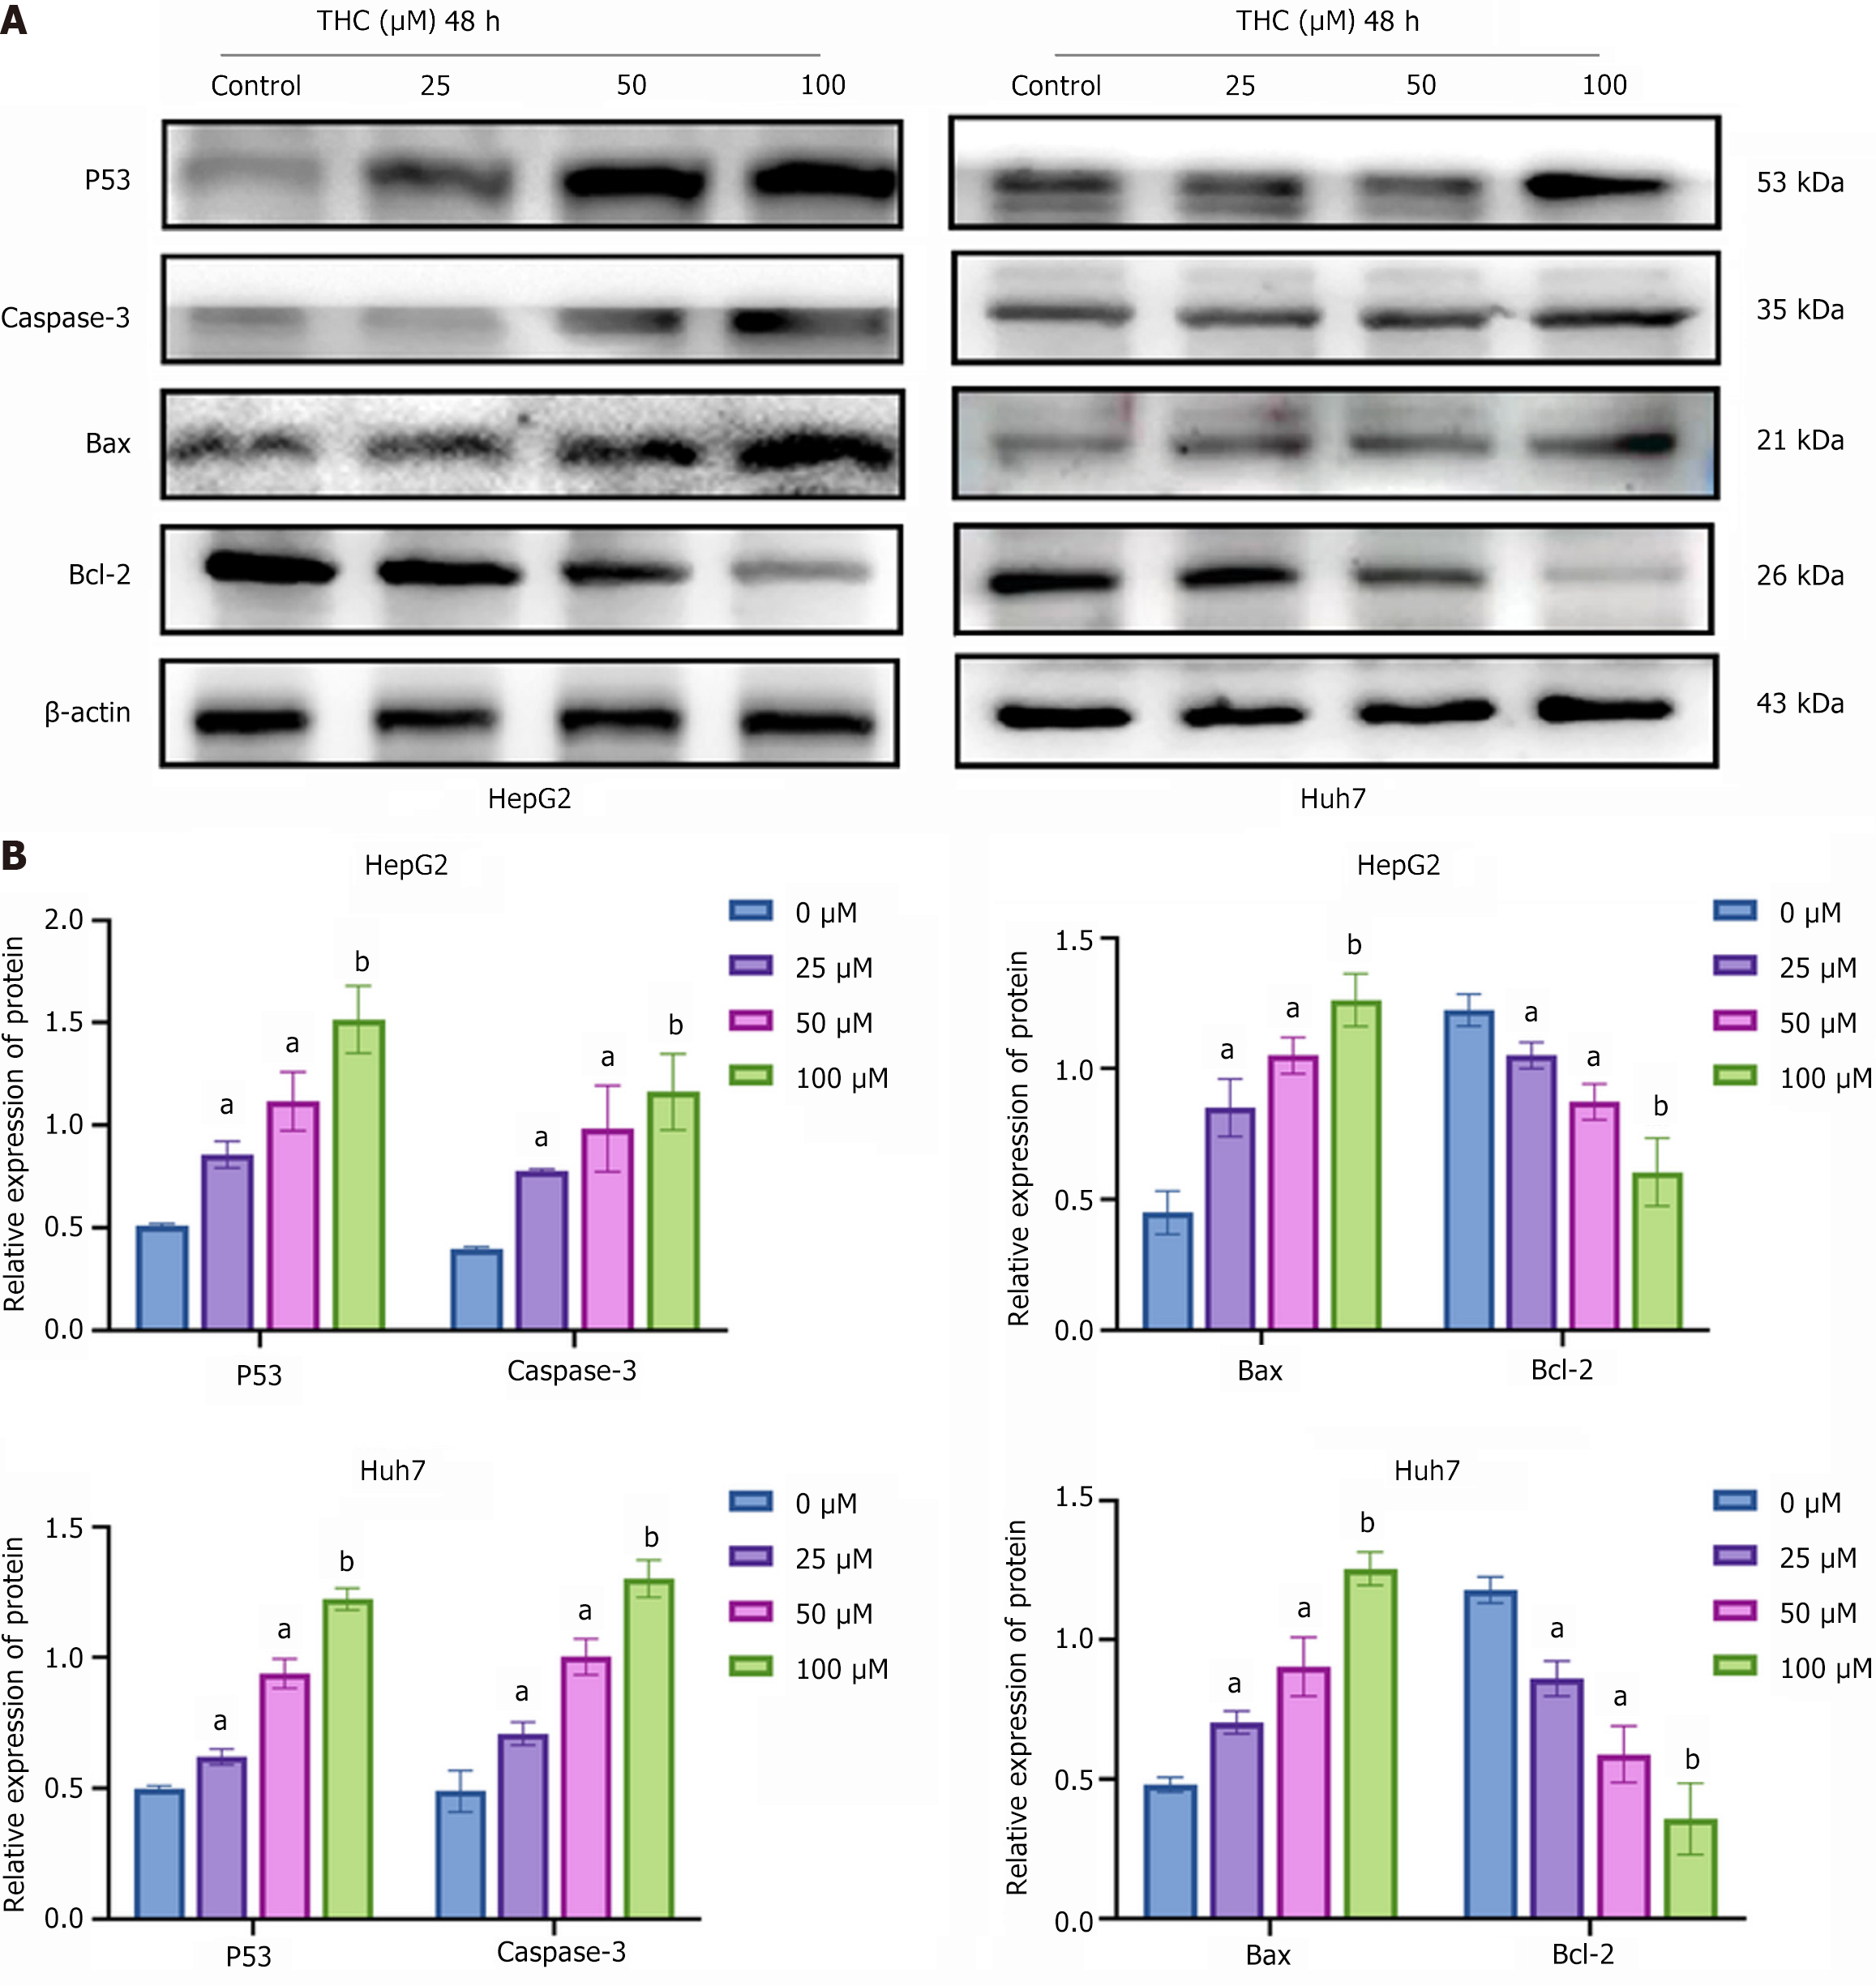
Figure 10 Effect of tetrahydrocurcumin on the expression of P53 signaling pathway-related proteins in hepatocellular carcinoma cells.
A: Western blotting analysis of core P53 signaling pathway-related proteins. HepG2 and Huh7 cells were treated with tetrahydrocurcumin (25, 50, or 100 μM) for 48 hours. Representative blots of P53, caspase-3, Bax, and Bcl-2 protein expression; B: Western blotting analysis of the expression of core proteins related to the P53 signaling pathway in hepatocellular carcinoma cells after drug treatment. All data are presented as the mean ± SD, n = 3. aP < 0.05; bP < 0.01; THC: Tetrahydrocurcumin.
- Citation: Bao ZC, Zhang Y, Liu ZD, Dai HJ, Ren F, Li N, Lv SY, Zhang Y. Tetrahydrocurcumin-induced apoptosis of hepatocellular carcinoma cells involves the TP53 signaling pathway, as determined by network pharmacology. World J Gastrointest Oncol 2025; 17(3): 101174
- URL: https://www.wjgnet.com/1948-5204/full/v17/i3/101174.htm
- DOI: https://dx.doi.org/10.4251/wjgo.v17.i3.101174


