©The Author(s) 2025.
World J Gastrointest Oncol. Feb 15, 2025; 17(2): 101177
Published online Feb 15, 2025. doi: 10.4251/wjgo.v17.i2.101177
Published online Feb 15, 2025. doi: 10.4251/wjgo.v17.i2.101177
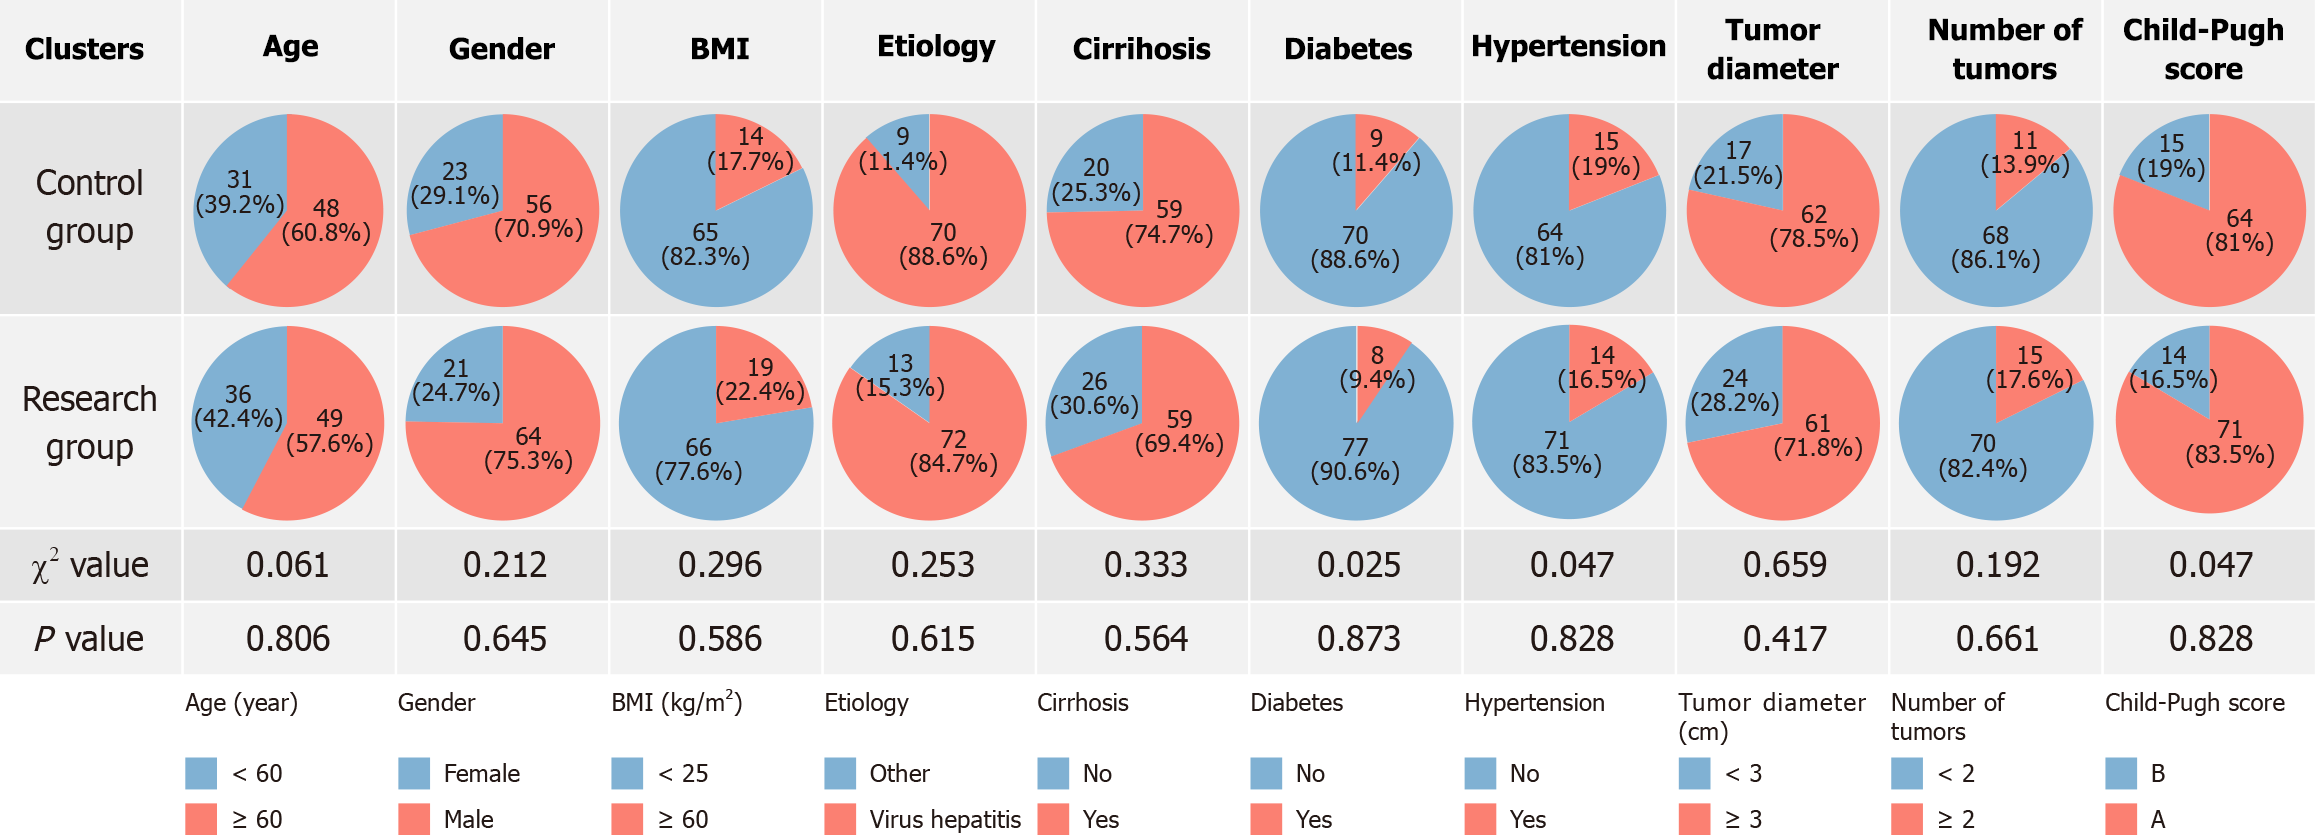
Figure 1 Comparison of the baseline characteristics of the patients in this study.
BMI: Body mass index.
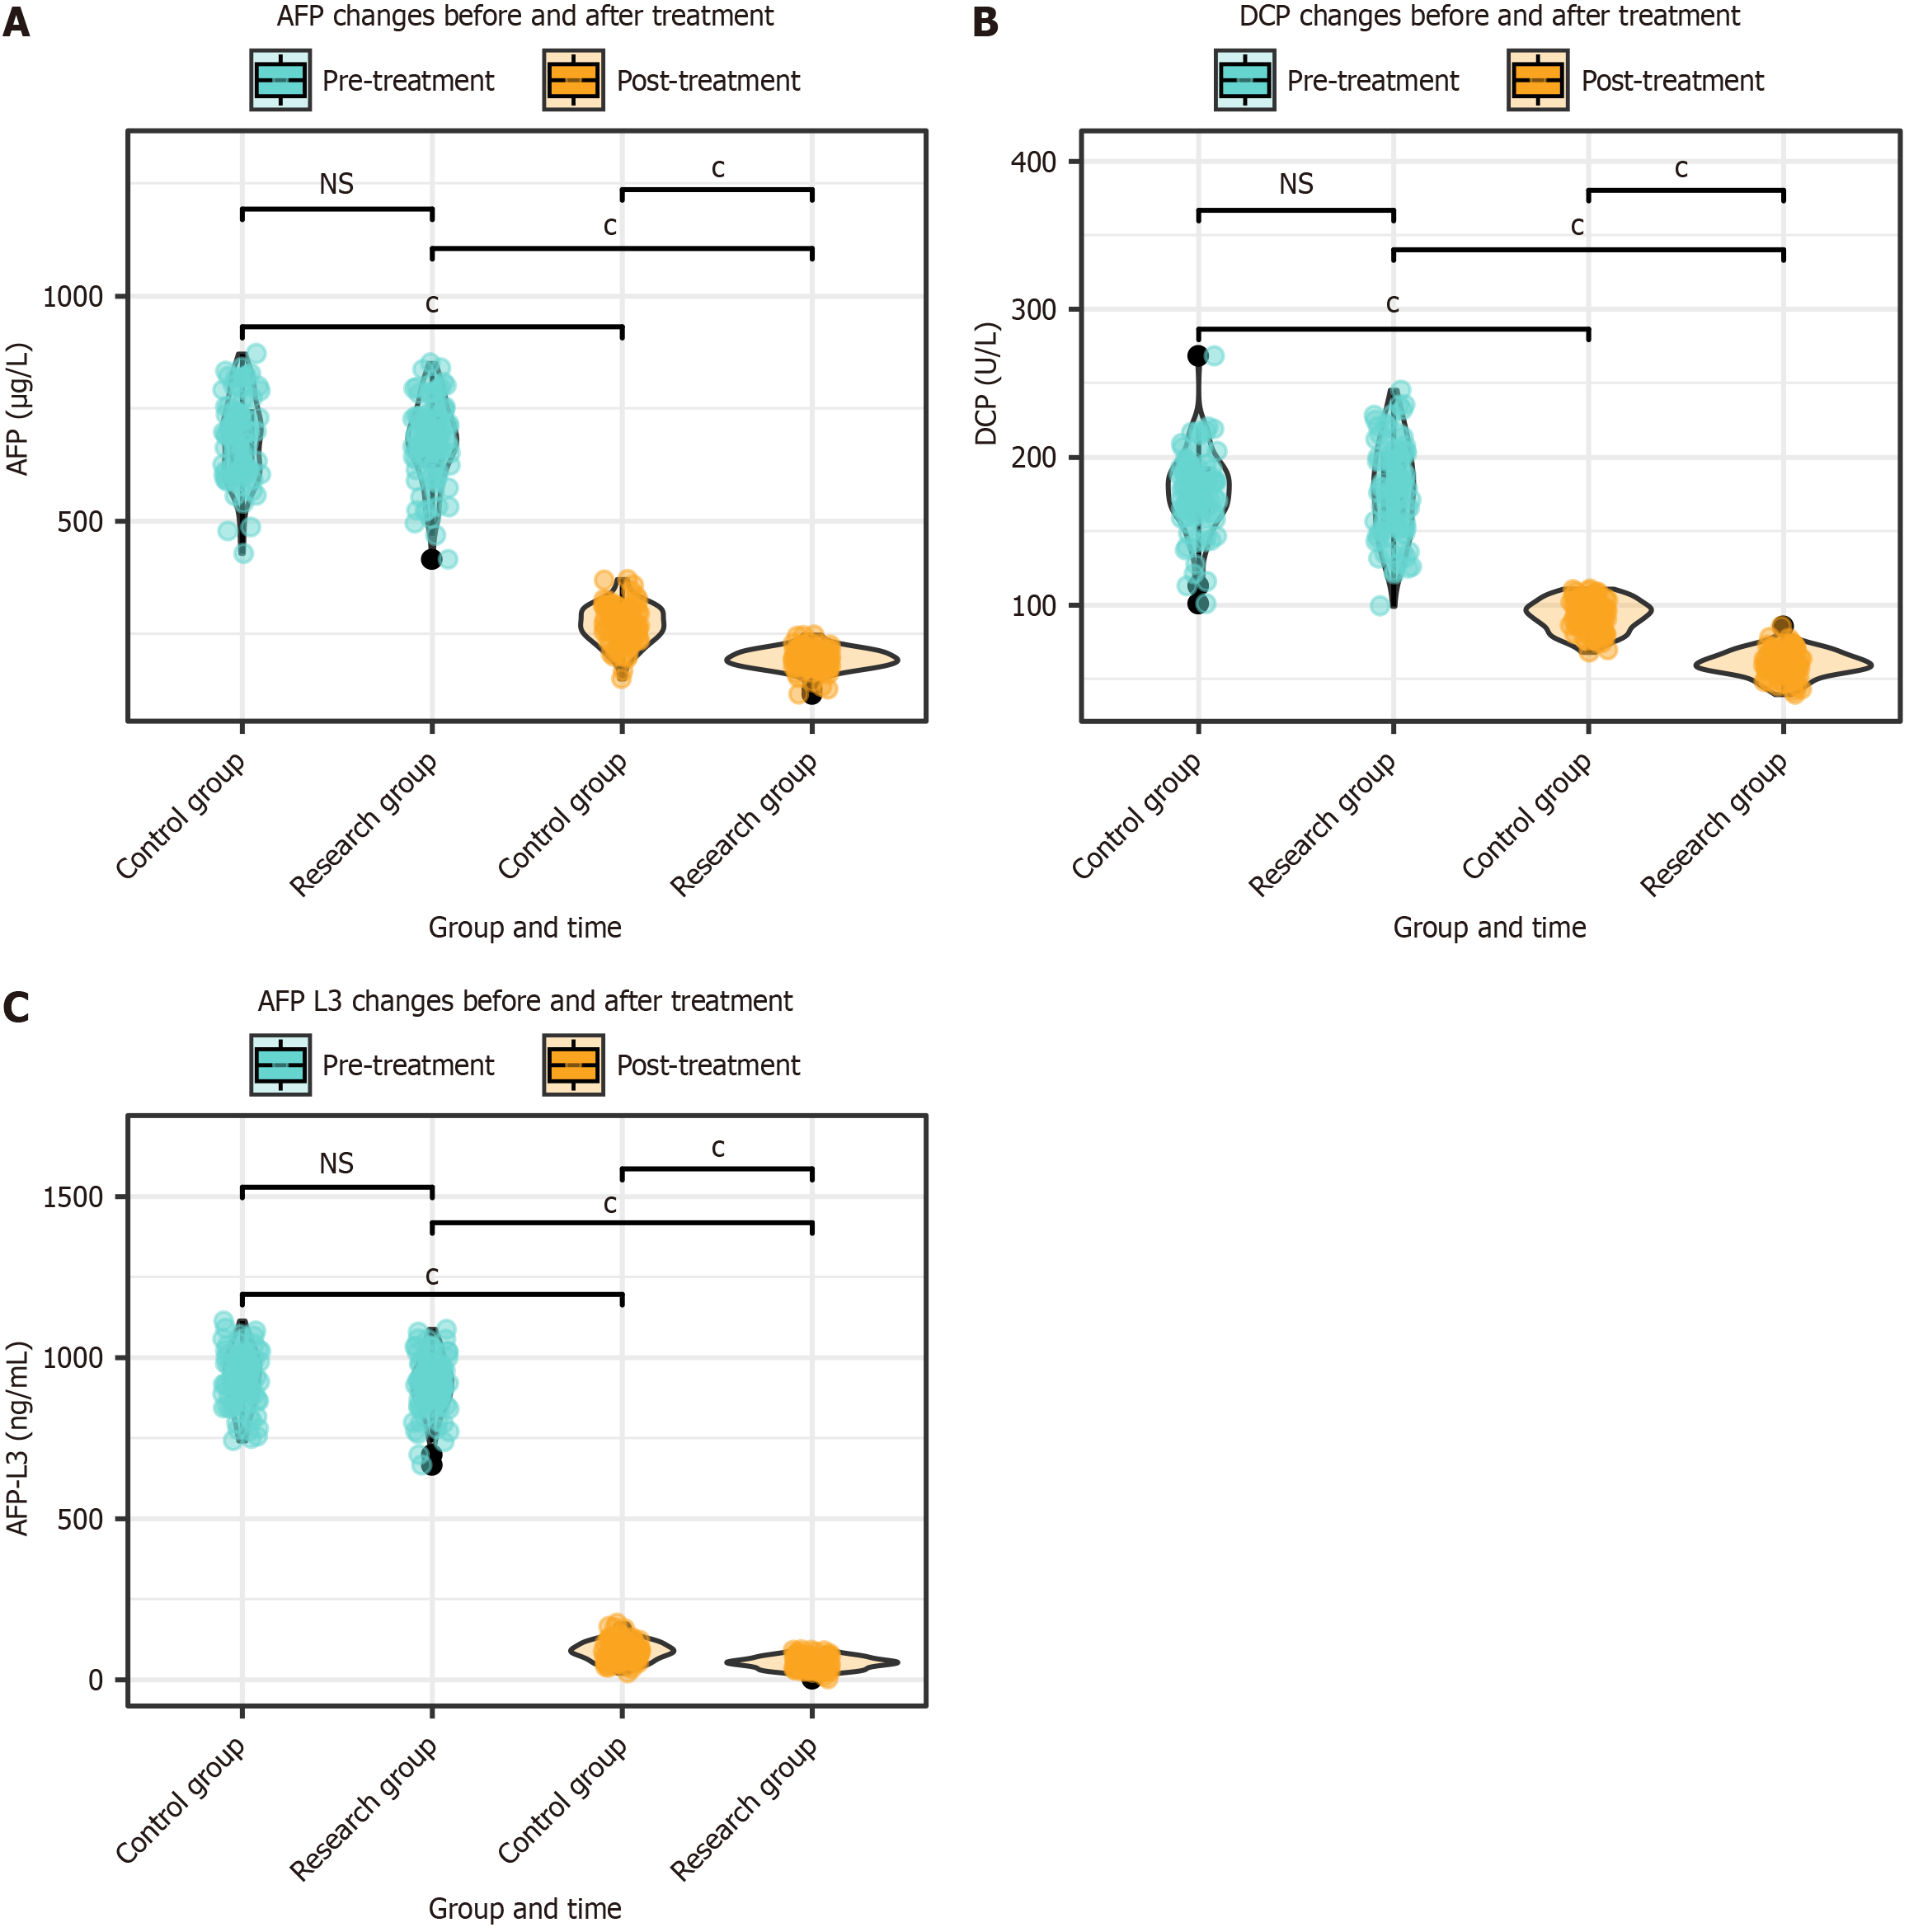
Figure 2 Changes in alpha-fetoprotein, des-γ-carboxy prothrombin, and alpha-fetoprotein-L3 levels before and after treatment in patients in this study.
A: Comparison of alpha-fetoprotein (AFP) levels before and after treatment; B: Comparison of des-γ-carboxy prothrombin levels before and after treatment; C: Comparison of AFP-L3 levels before and after treatment. cP < 0.001; AFP: Alpha-fetoprotein; DCP: Des-γ-carboxy prothrombin; NS: Not significant
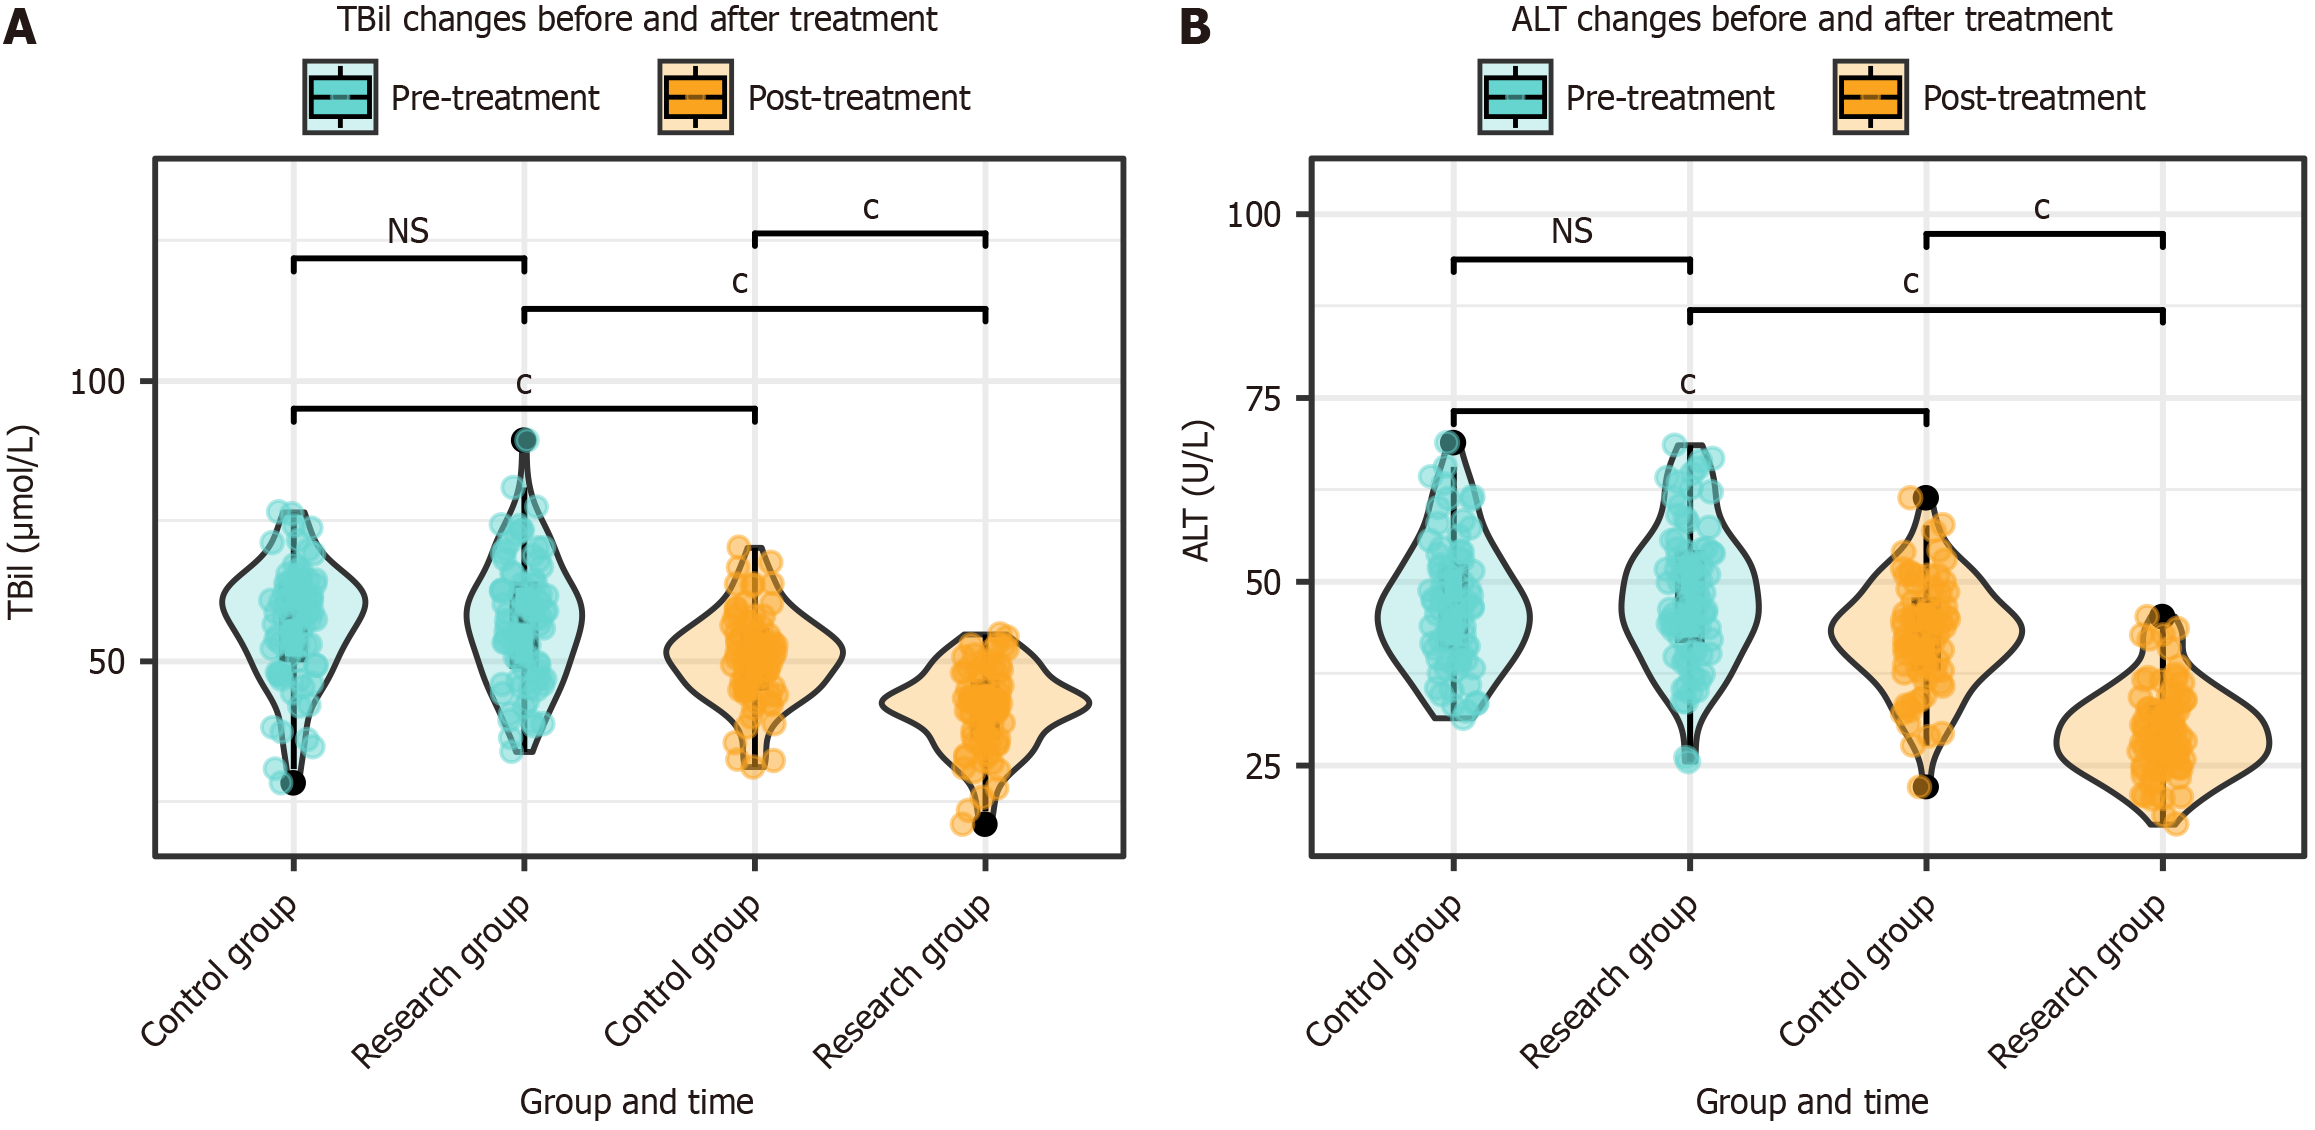
Figure 3 Changes in total bilirubin and alanine aminotransferase levels before and after treatment in patients.
A: Comparison of total bilirubin levels before and after treatment; B: Comparison of alanine aminotransferase levels before and after treatment. cP < 0.001; TBil: Total bilirubin; ALT: Alanine aminotransferase; NS: Not significant.
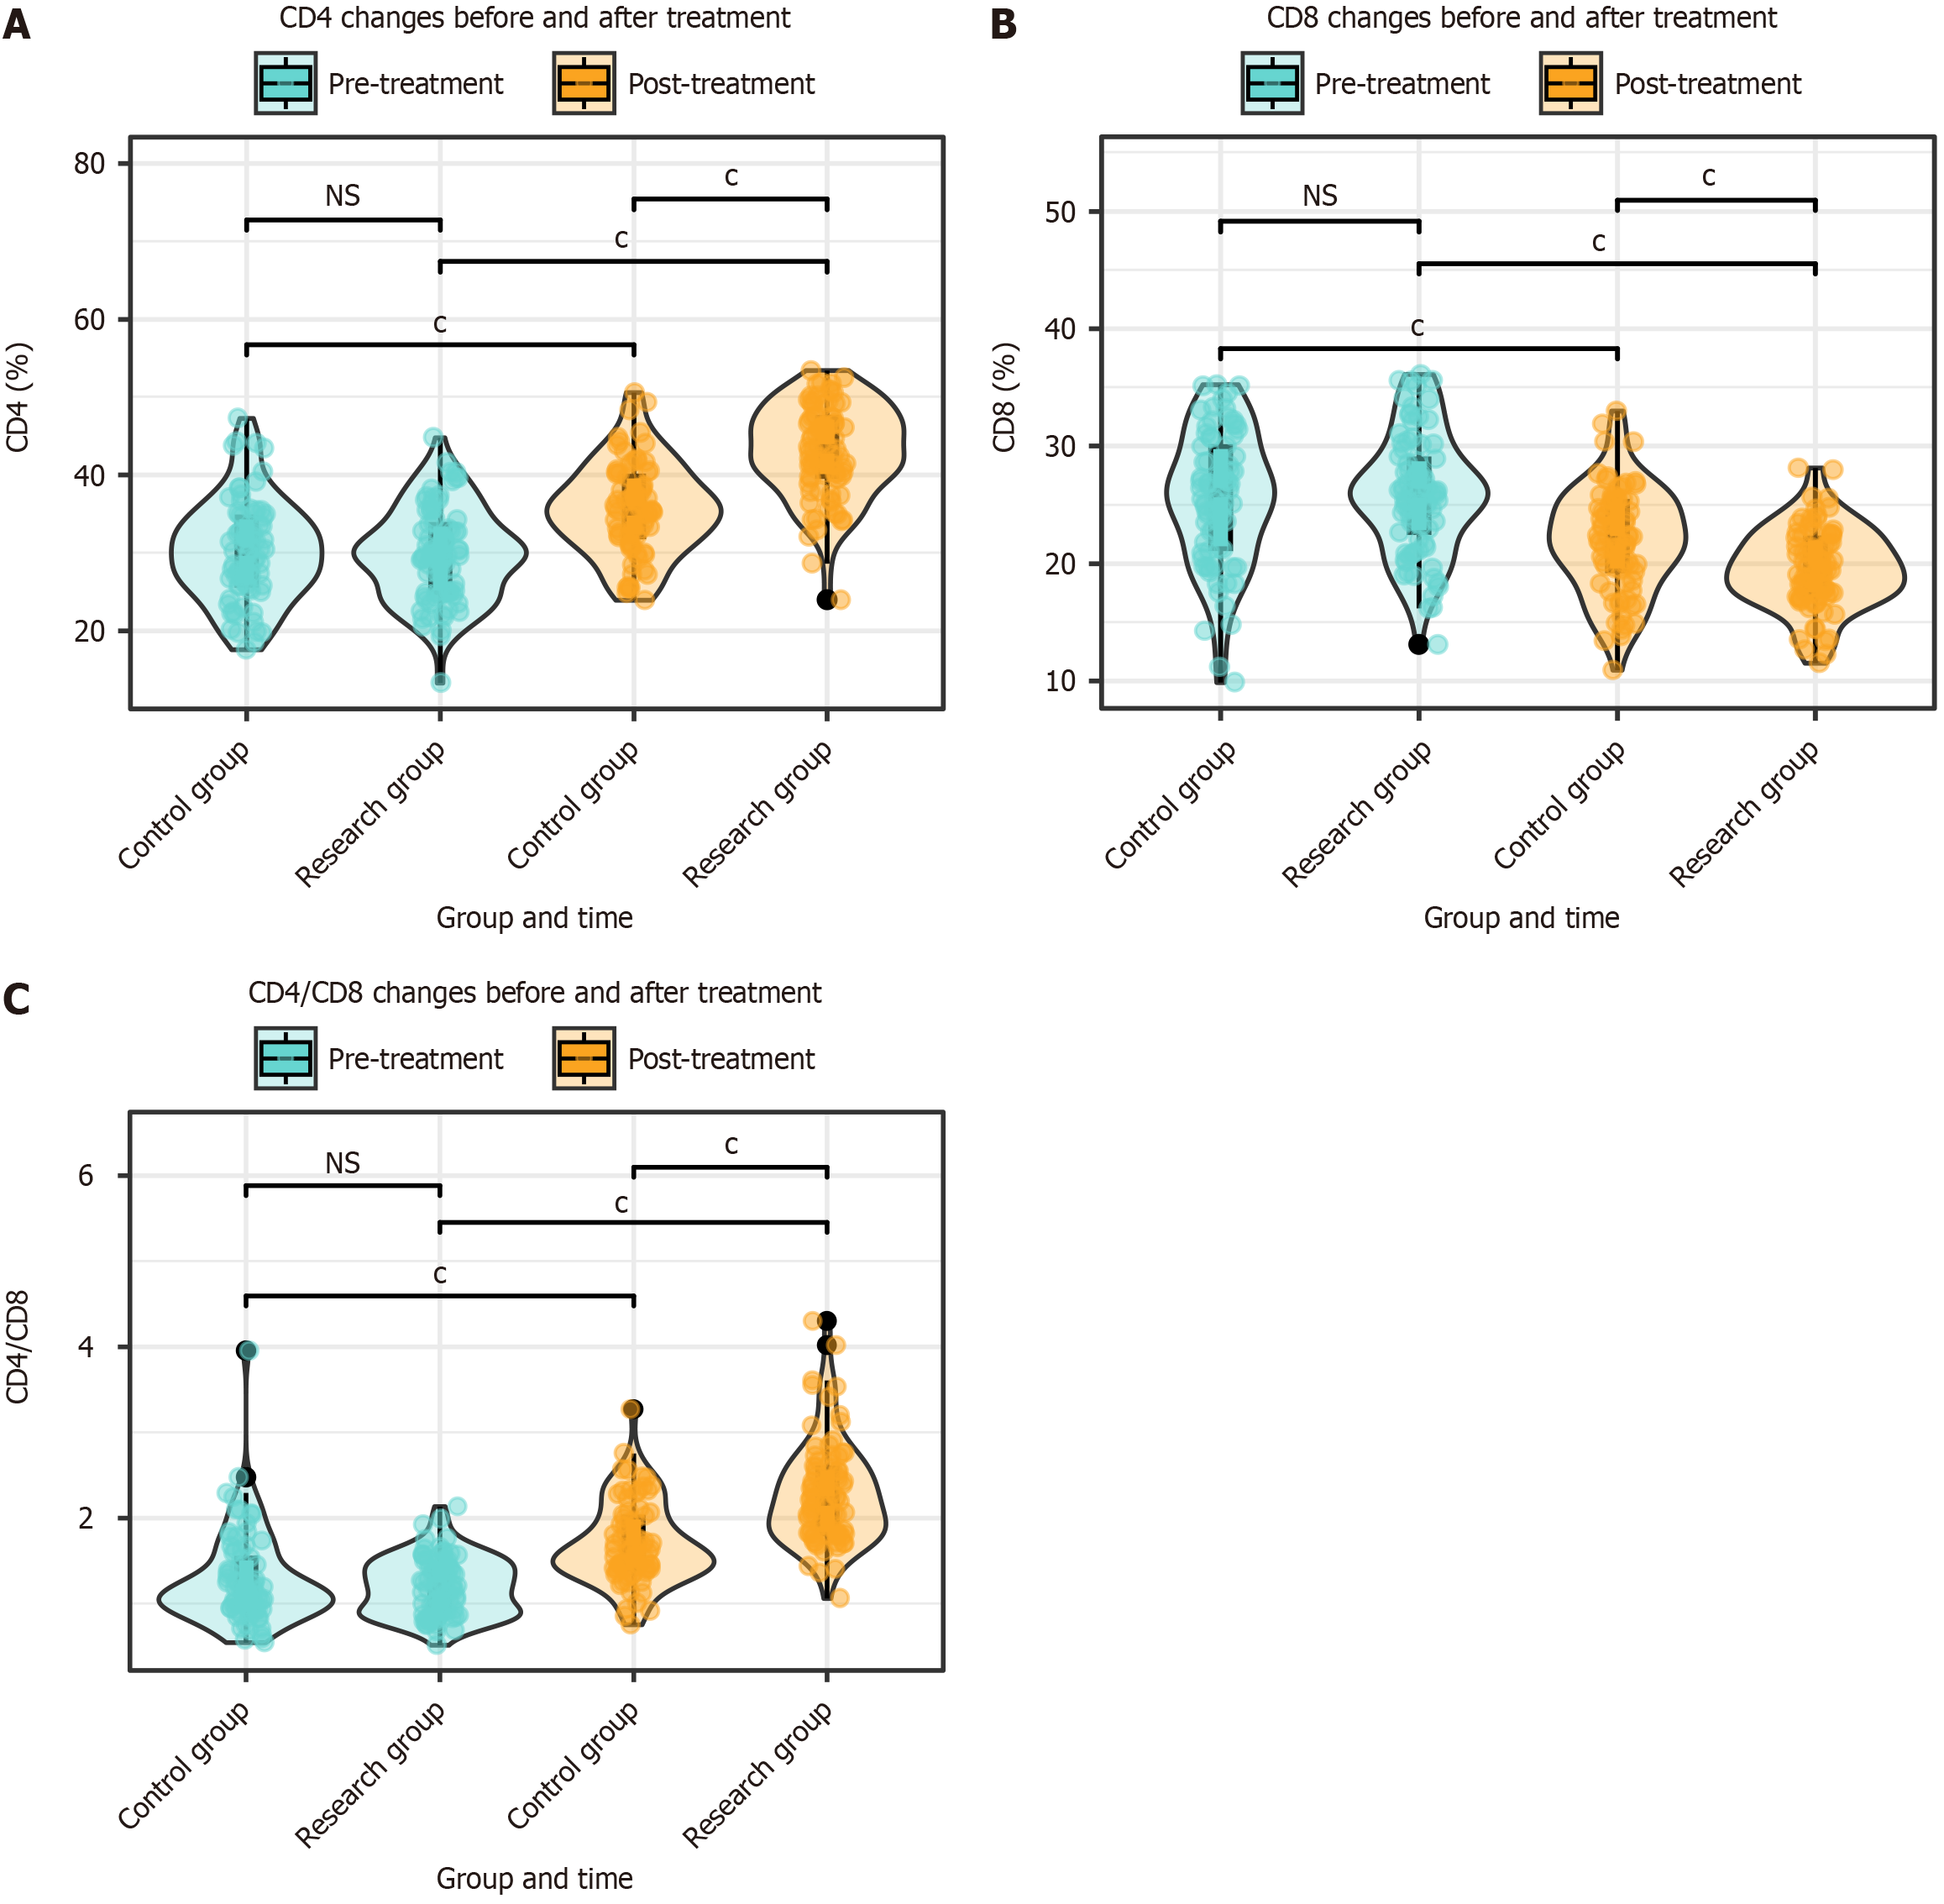
Figure 4 Changes in CD4, CD8, and CD4/CD8 ratios before and after treatment in patients in this study.
A: Comparison of CD4 Levels before and after treatment; B: Comparison of CD8 levels before and after treatment; C: Comparison of CD4/CD8 ratio before and after treatment. cP < 0.001; NS: Not significant.
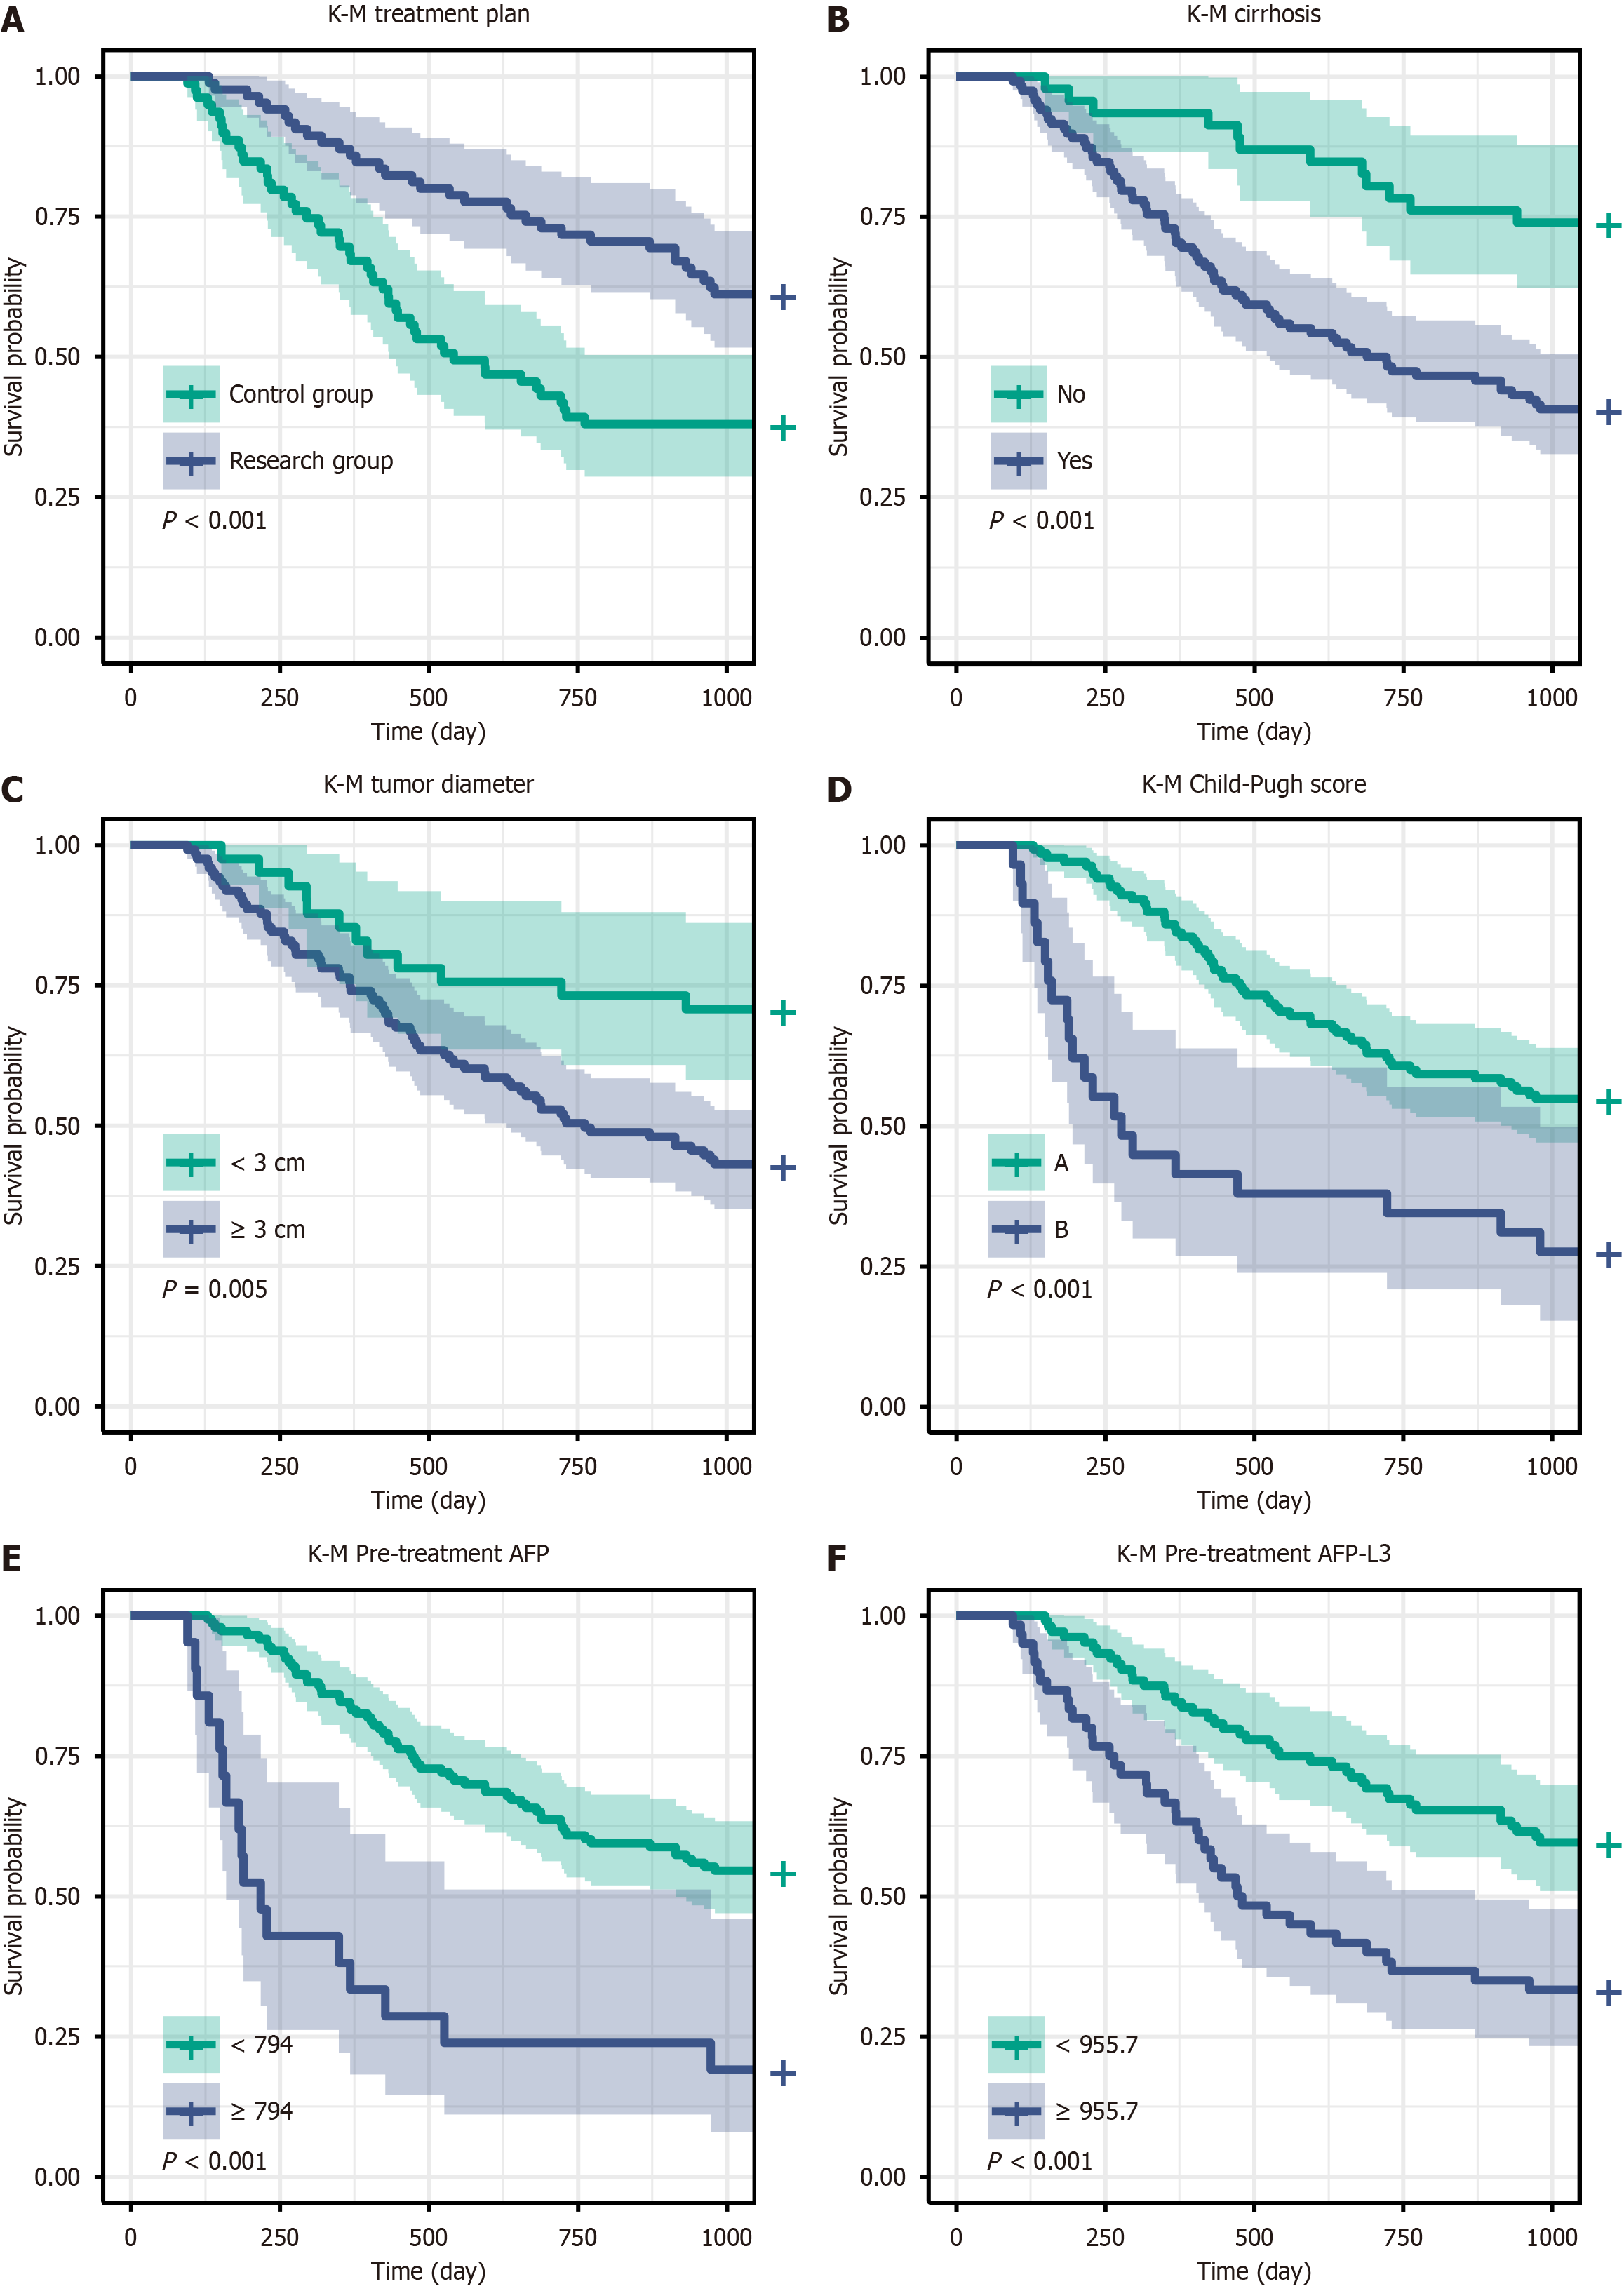
Figure 5 Disease-free survival curves for factors with differences in the univariate analysis.
A: Comparison of disease-free survival (DFS) in patients with different treatment plans; B: Comparison of DFS in patients with cirrhosis; C: Comparison of DFS in patients with different tumor sizes; D: Comparison of DFS in patients with different Child-Pugh Scores; E: Relationship between pre-treatment alpha-fetoprotein (AFP) and DFS in patients in this study; F: Relationship between pre-treatment AFP-L3 and DFS in patients in this study. DFS: Disease-free survival; AFP: Alpha-fetoprotein.
- Citation: Huang R, Cui J. Impact of Linggui Zhugan decoction on microwave ablation outcomes and recurrence in liver cancer. World J Gastrointest Oncol 2025; 17(2): 101177
- URL: https://www.wjgnet.com/1948-5204/full/v17/i2/101177.htm
- DOI: https://dx.doi.org/10.4251/wjgo.v17.i2.101177


