©The Author(s) 2025.
World J Gastrointest Oncol. Feb 15, 2025; 17(2): 100908
Published online Feb 15, 2025. doi: 10.4251/wjgo.v17.i2.100908
Published online Feb 15, 2025. doi: 10.4251/wjgo.v17.i2.100908
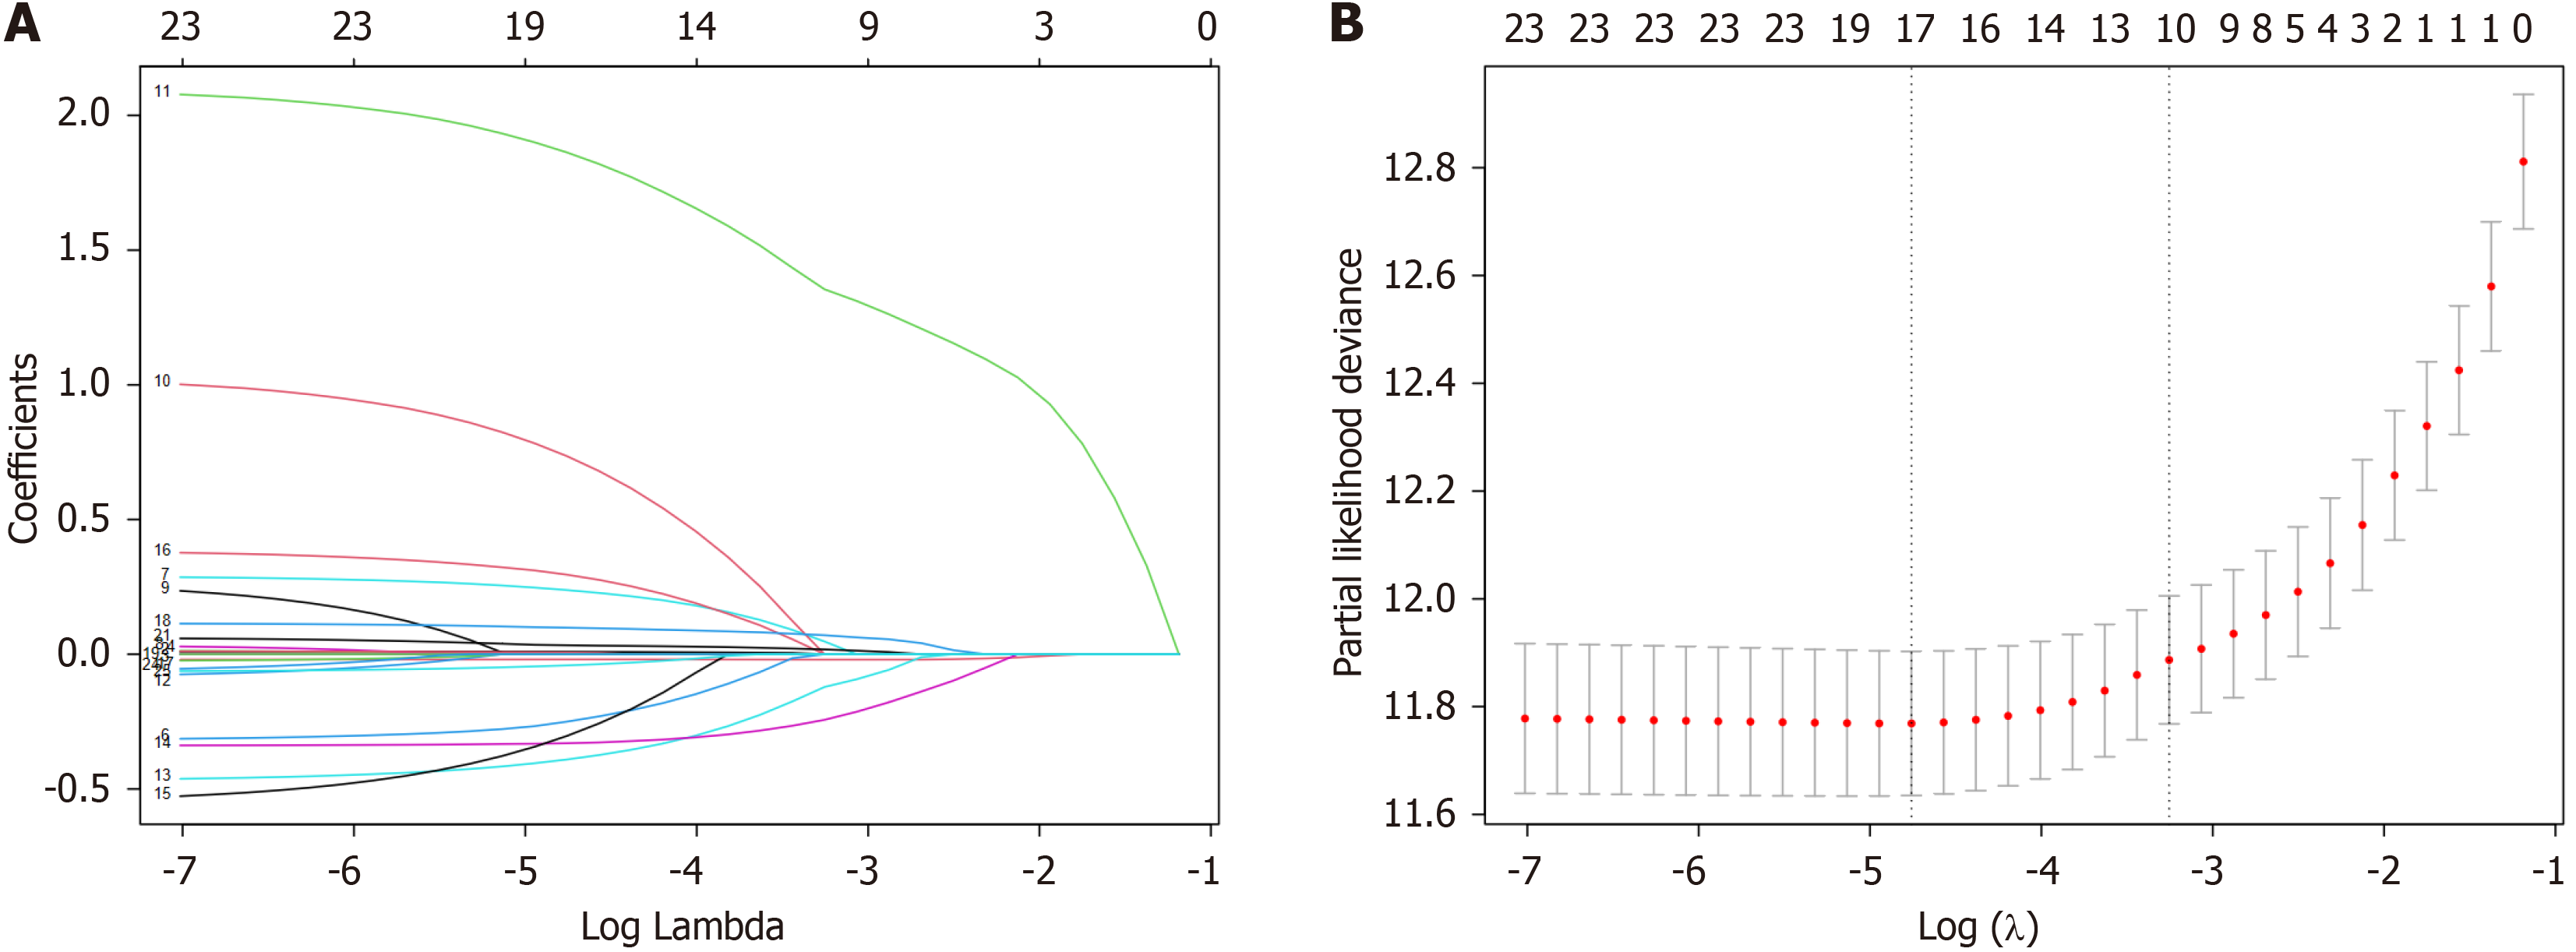
Figure 1 The process of variable selection via the least absolute shrinkage and selection operator Cox regression model.
A: The plot of least absolute shrinkage and selection operator (LASSO) coefficients distribution for 23 risk factors; B: LASSO regression cross validation graph.
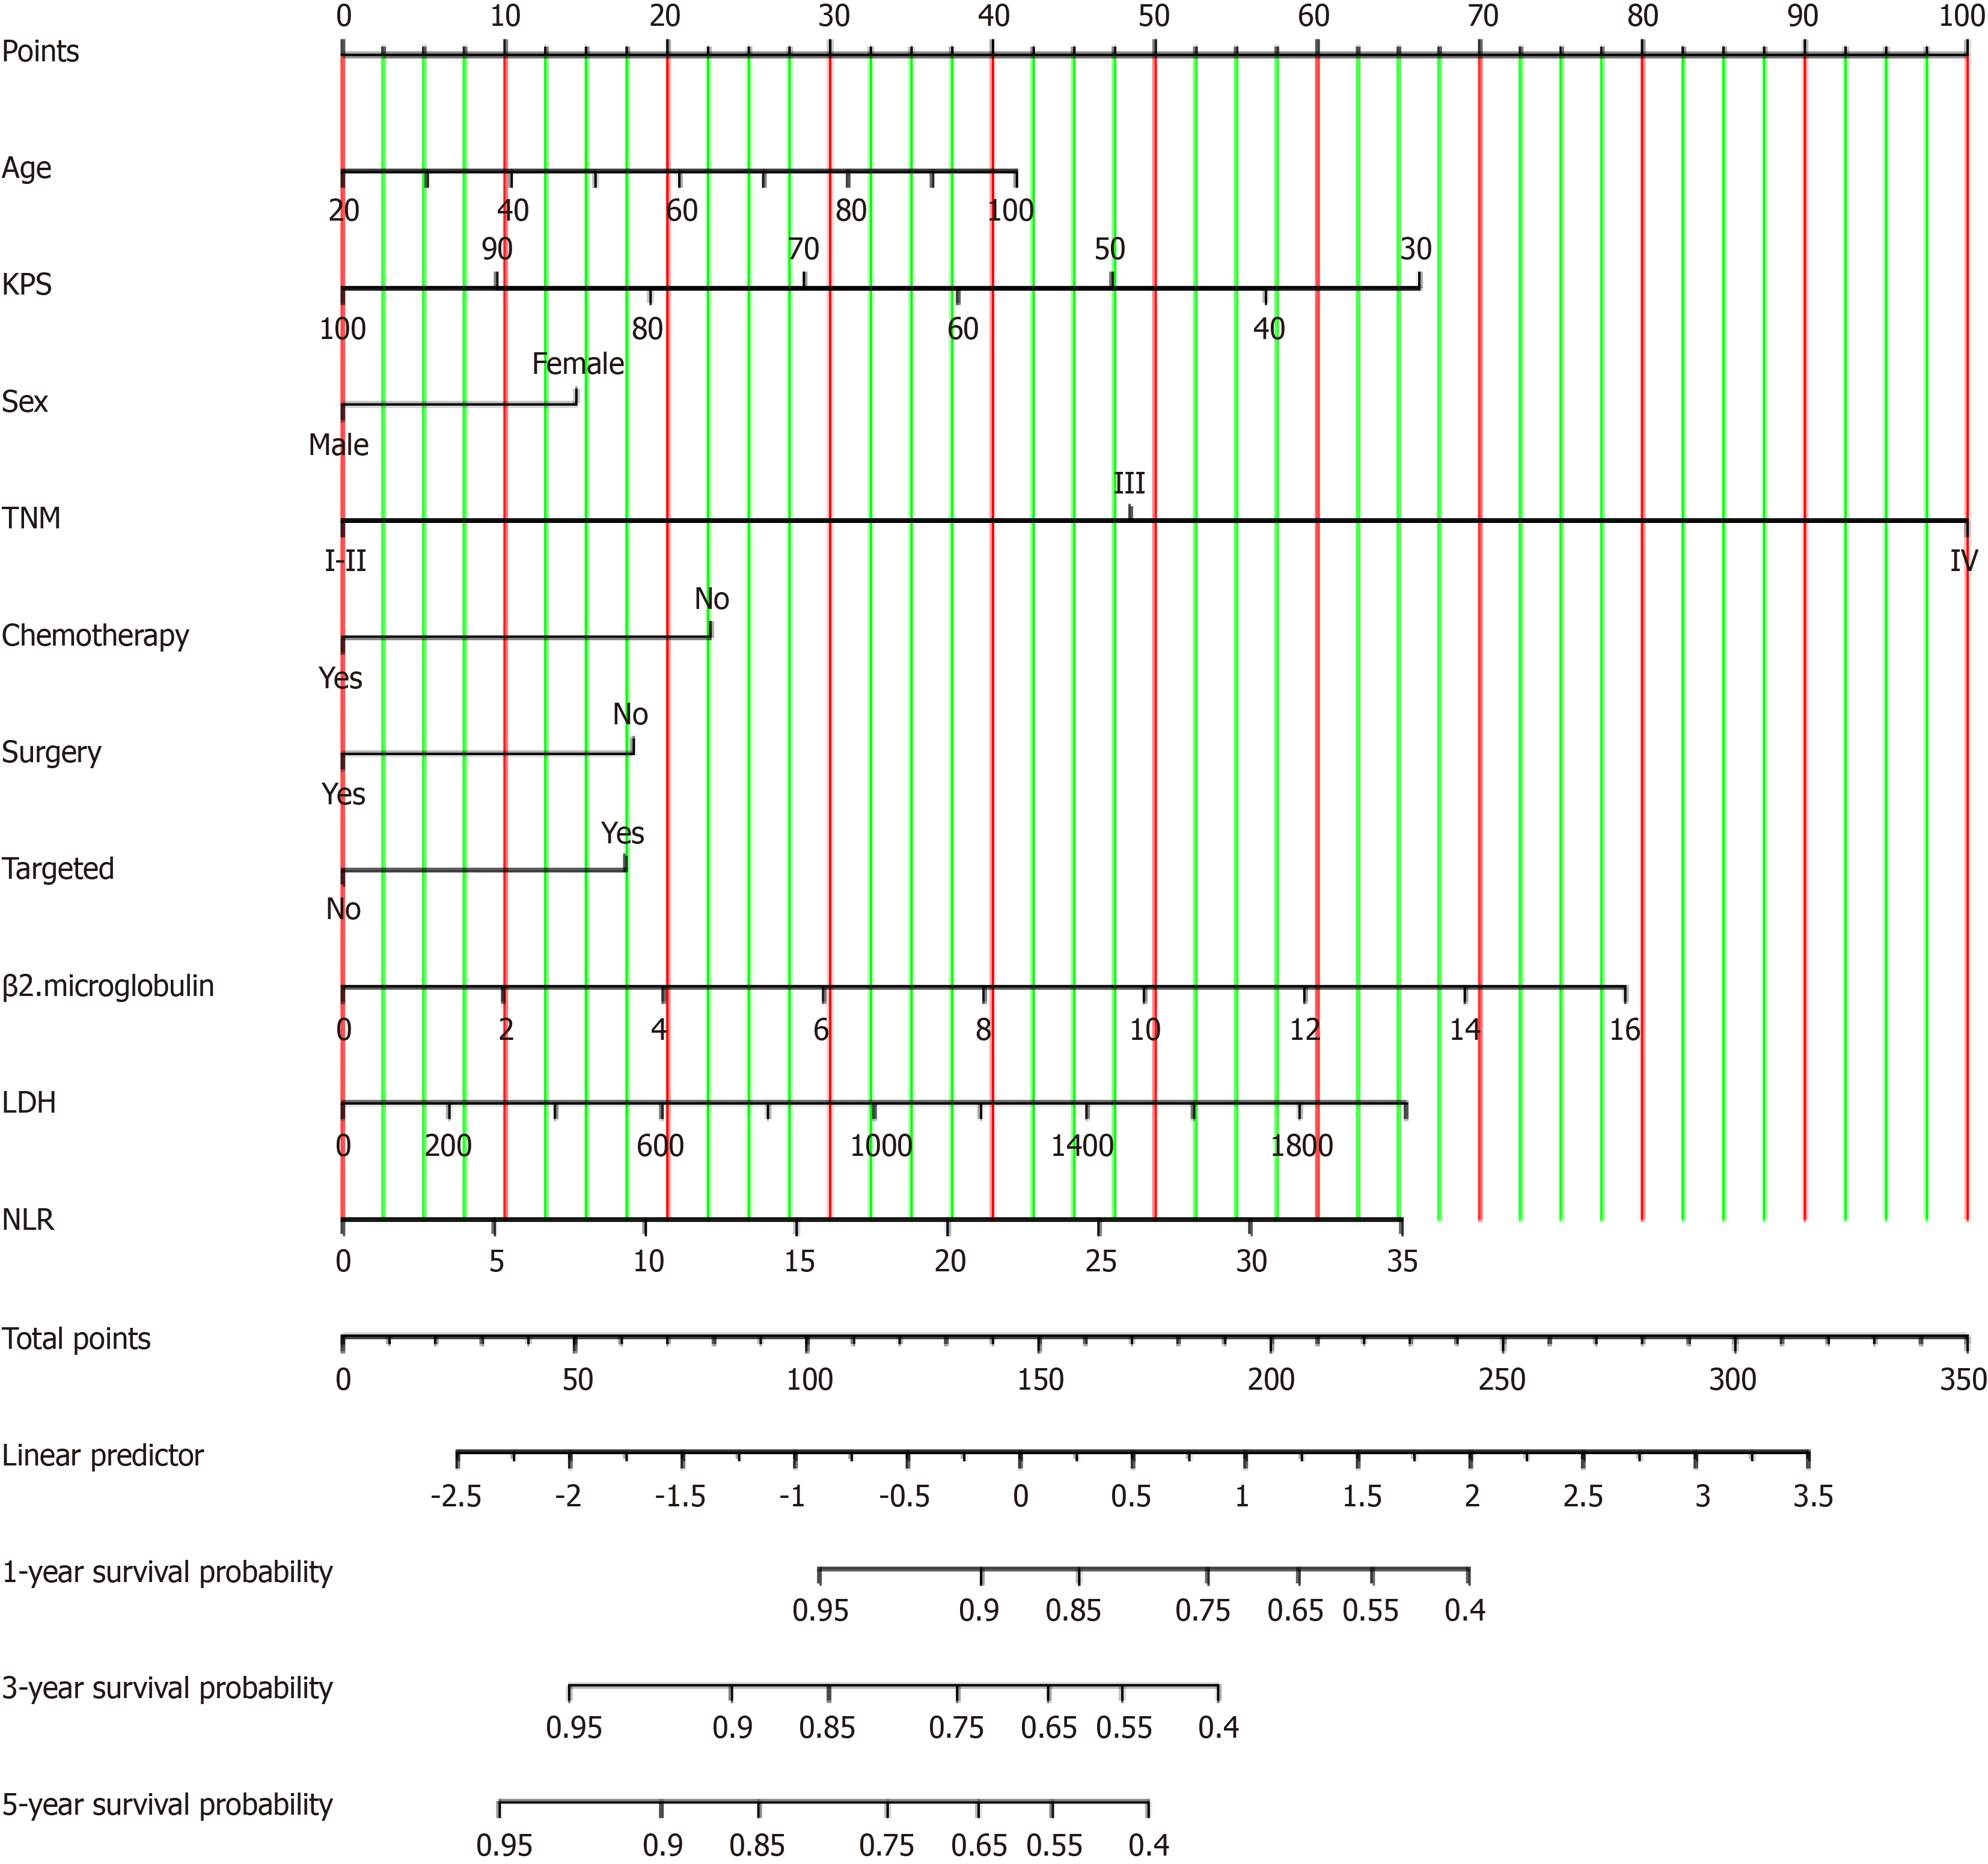
Figure 2 Nomogram model for predicting the 1-year, 3-year, and 5-year overall survival of rectal cancer patients in the training cohort.
KPS: Karnofsky performance status; LDH: Lactic dehydrogenase; NLR: Neutrophil-to-lymphocyte ratio.
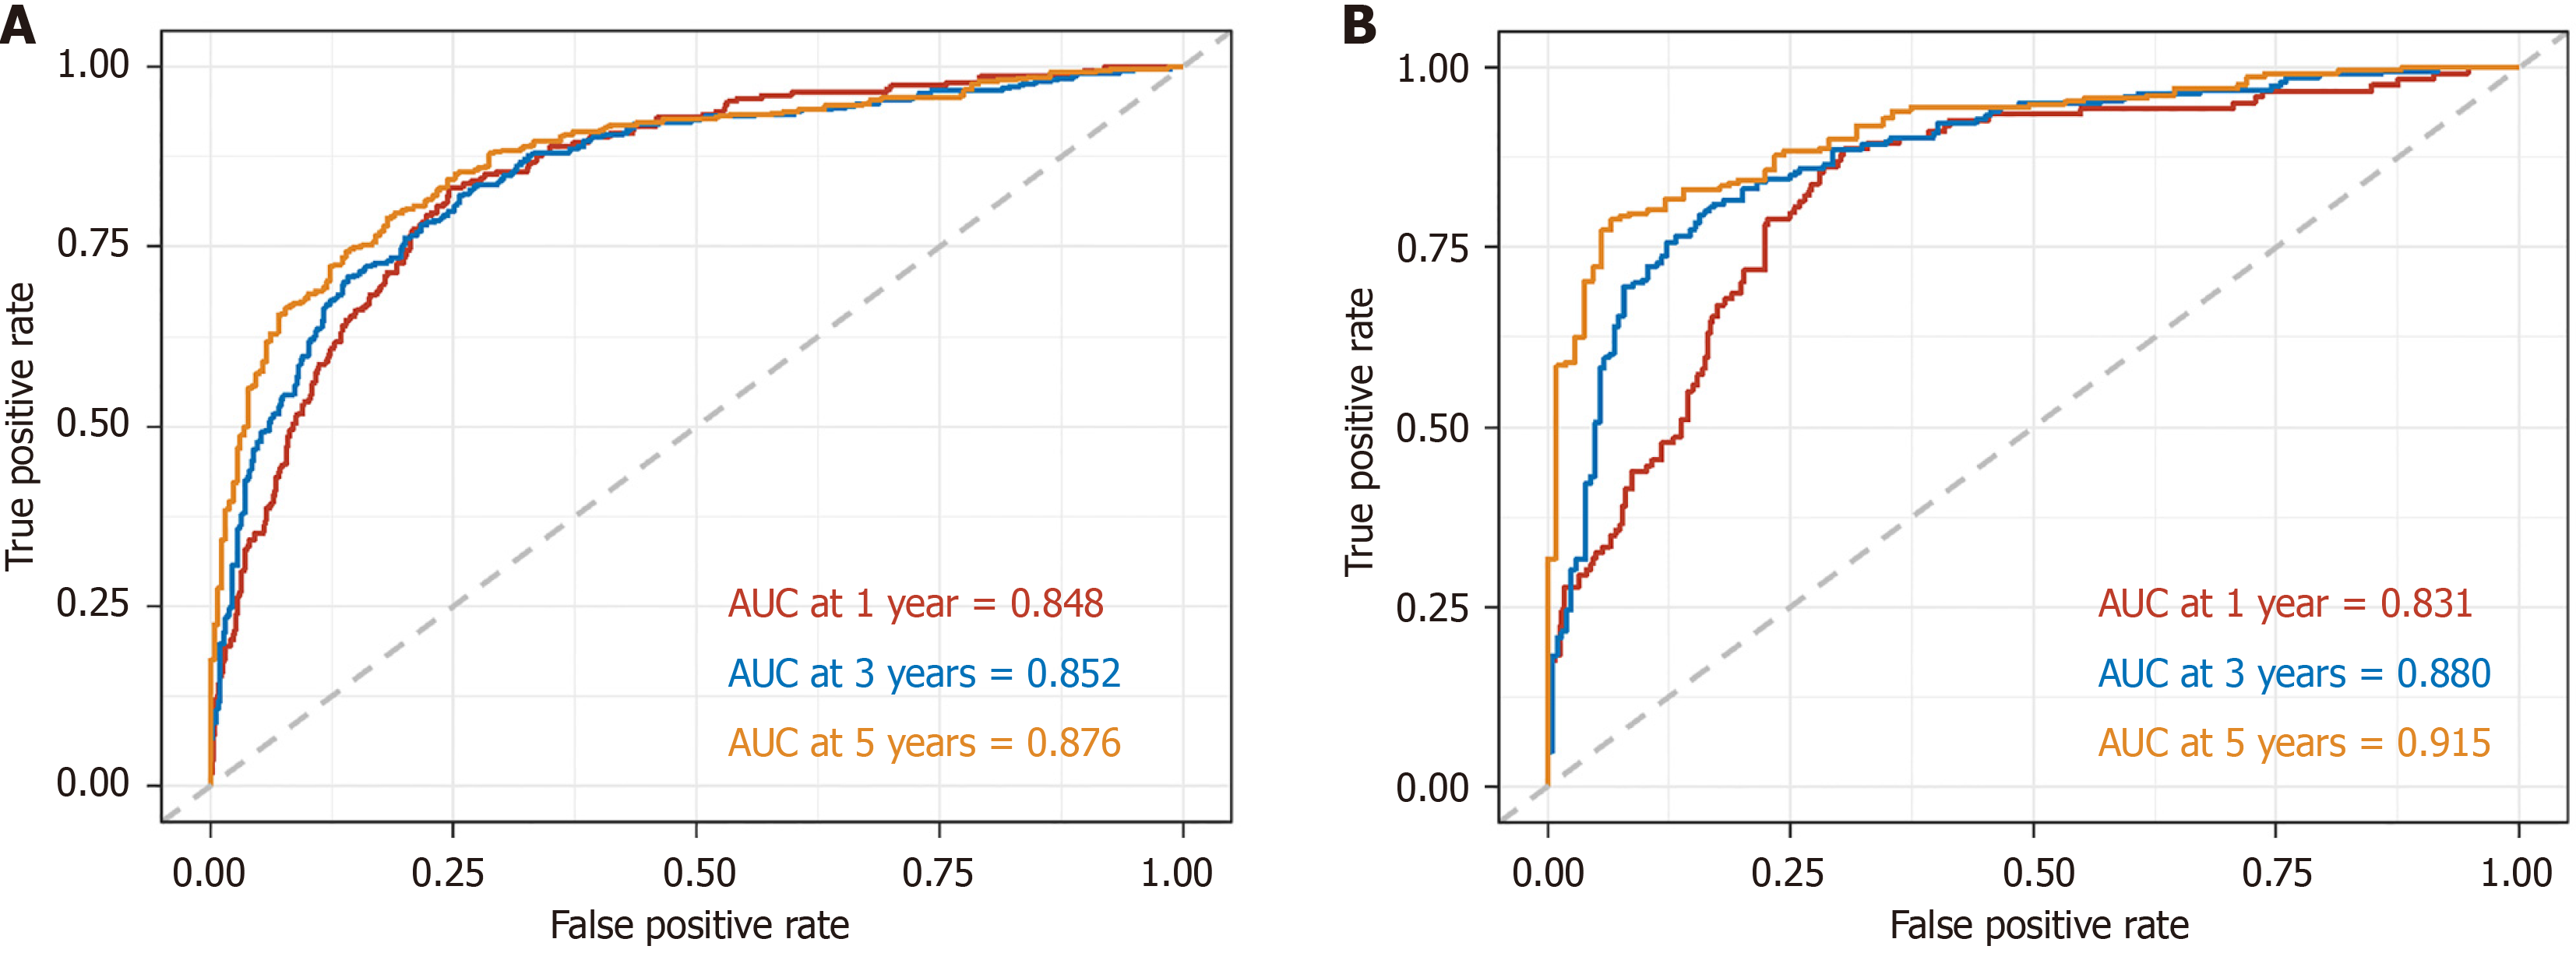
Figure 3 The receiver operating characteristic curves of the nomogram for 1-year, 3-year, and 5-year overall survival prediction.
A: In the training cohort; B: In the validation cohort. AUC: Area under the curve.
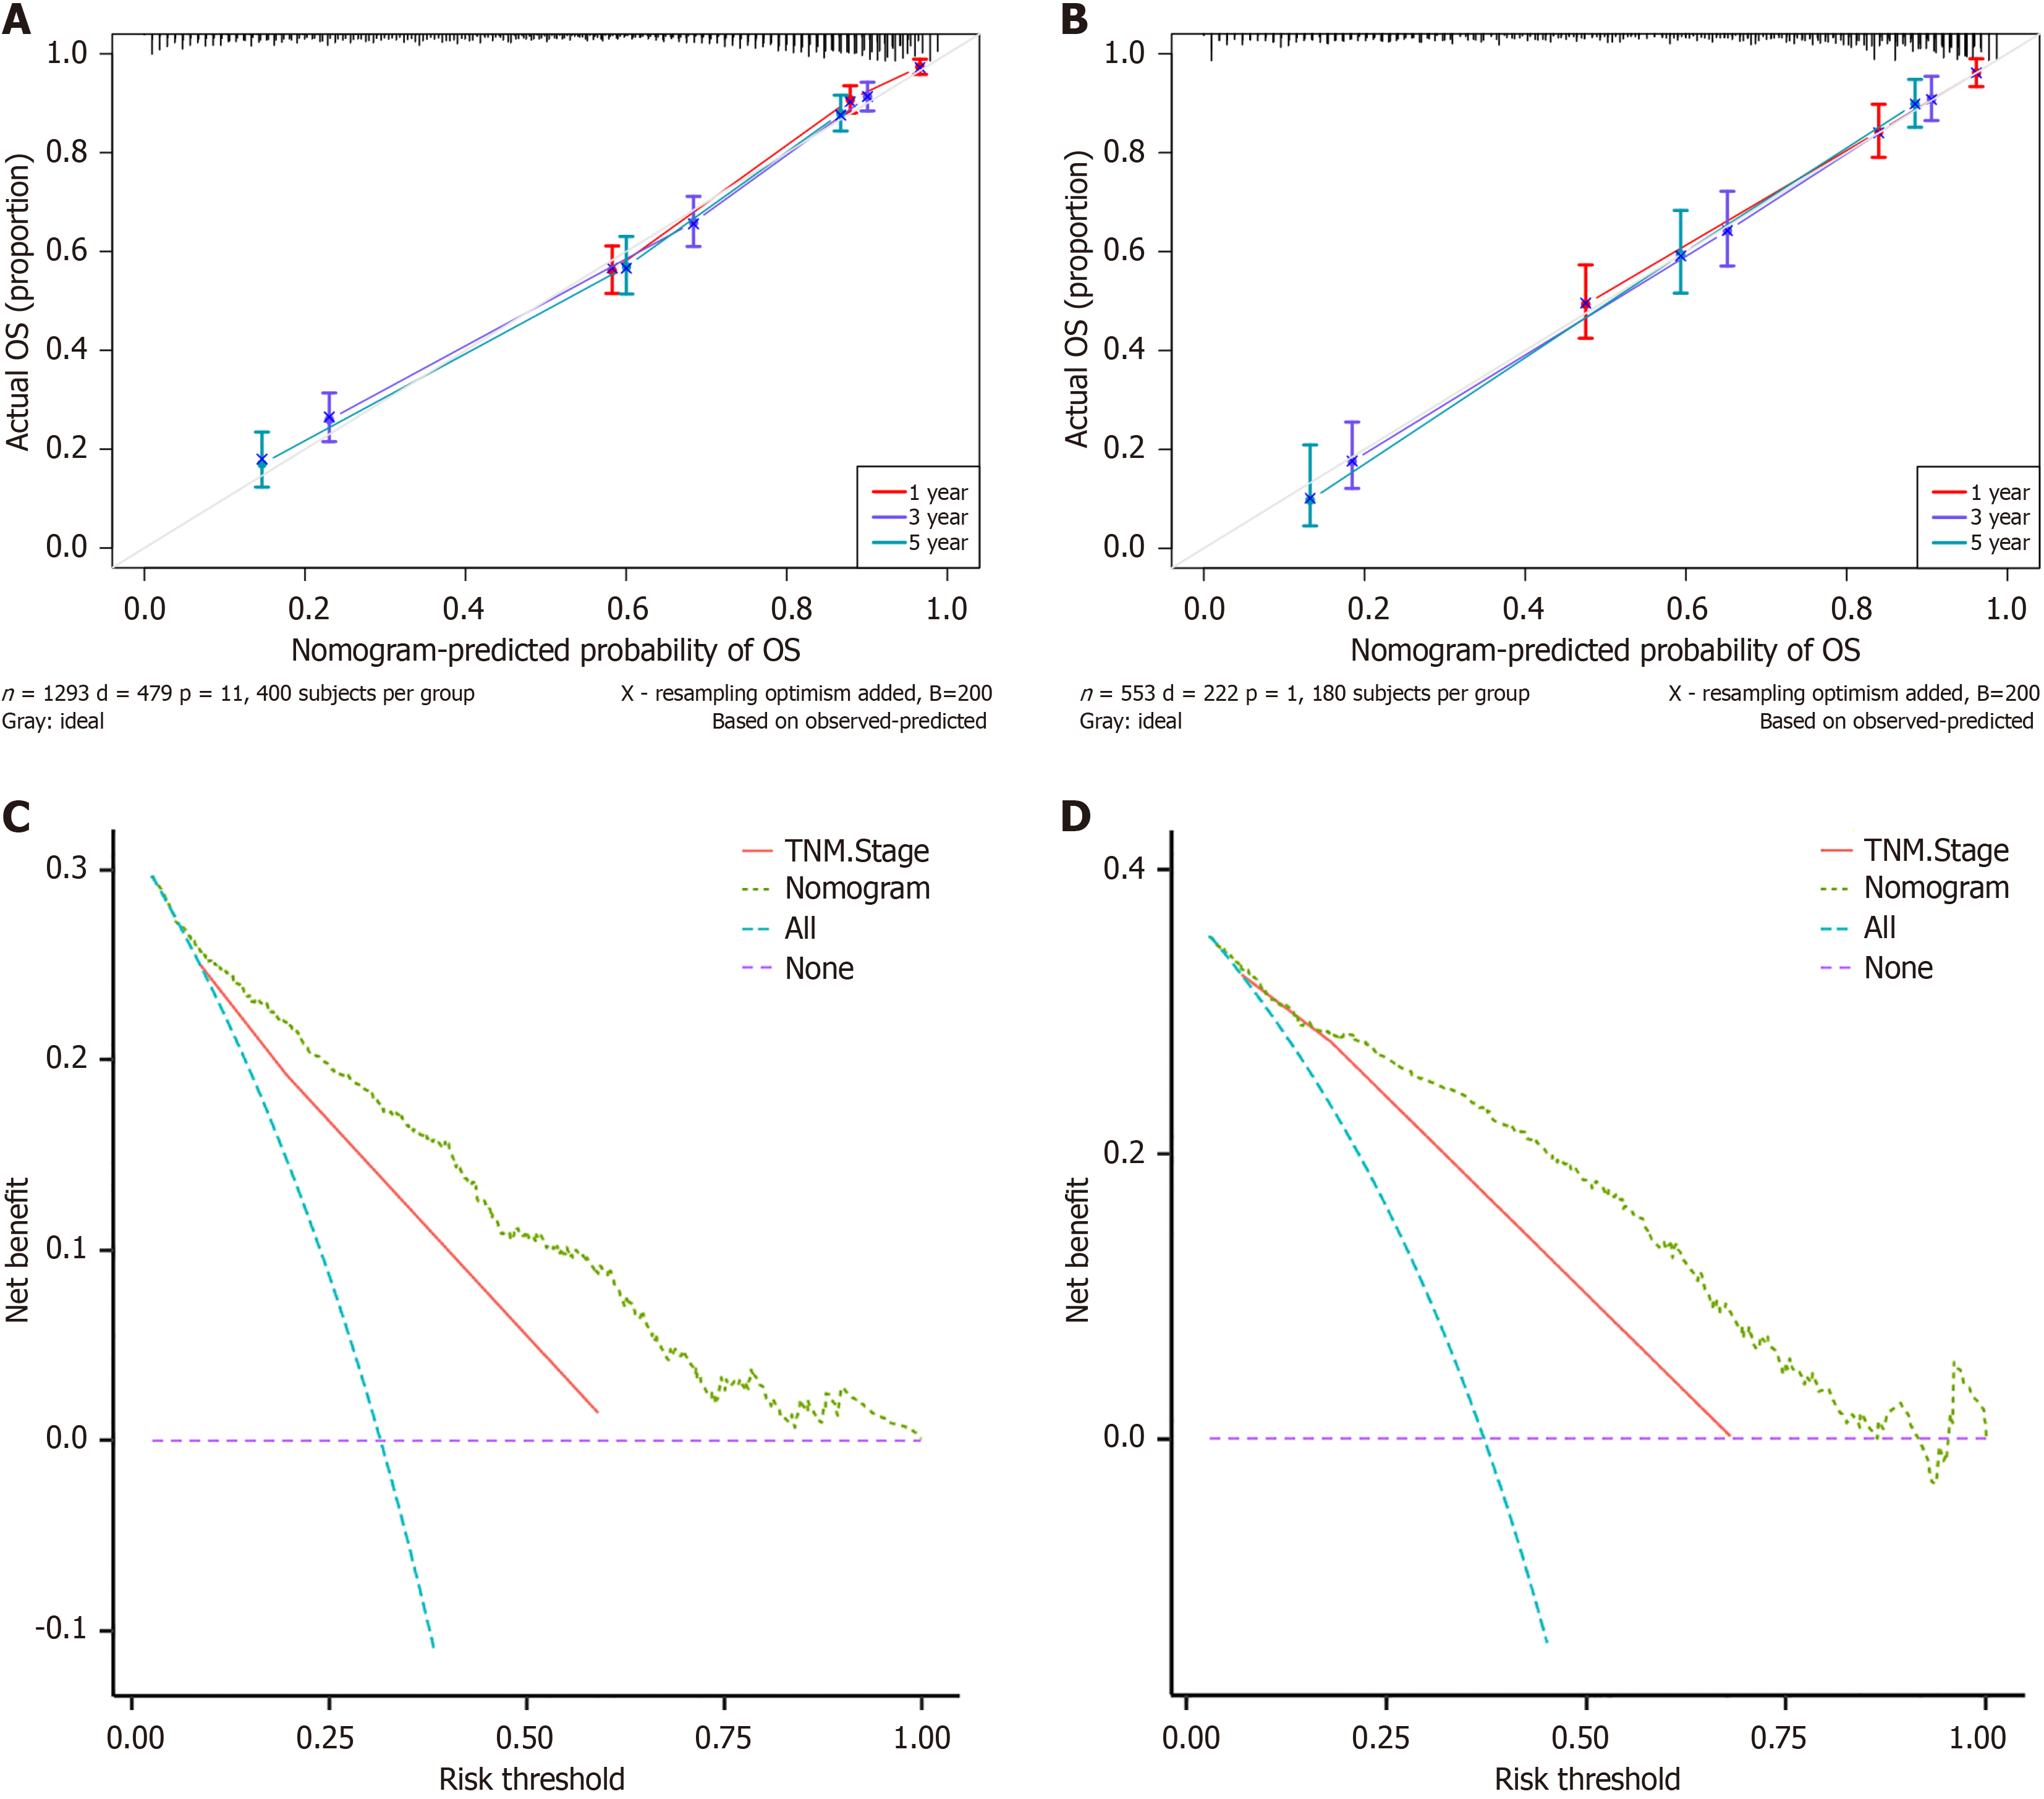
Figure 4 Calibration curve and decision curve analysis curve of the model.
A: Calibration curve for the training cohort; B: Calibration curve for the validation cohort; C: Decision curve analysis (DCA) curve for the training cohort; D: DCA curve for the validation cohort. OS: Overall survival.
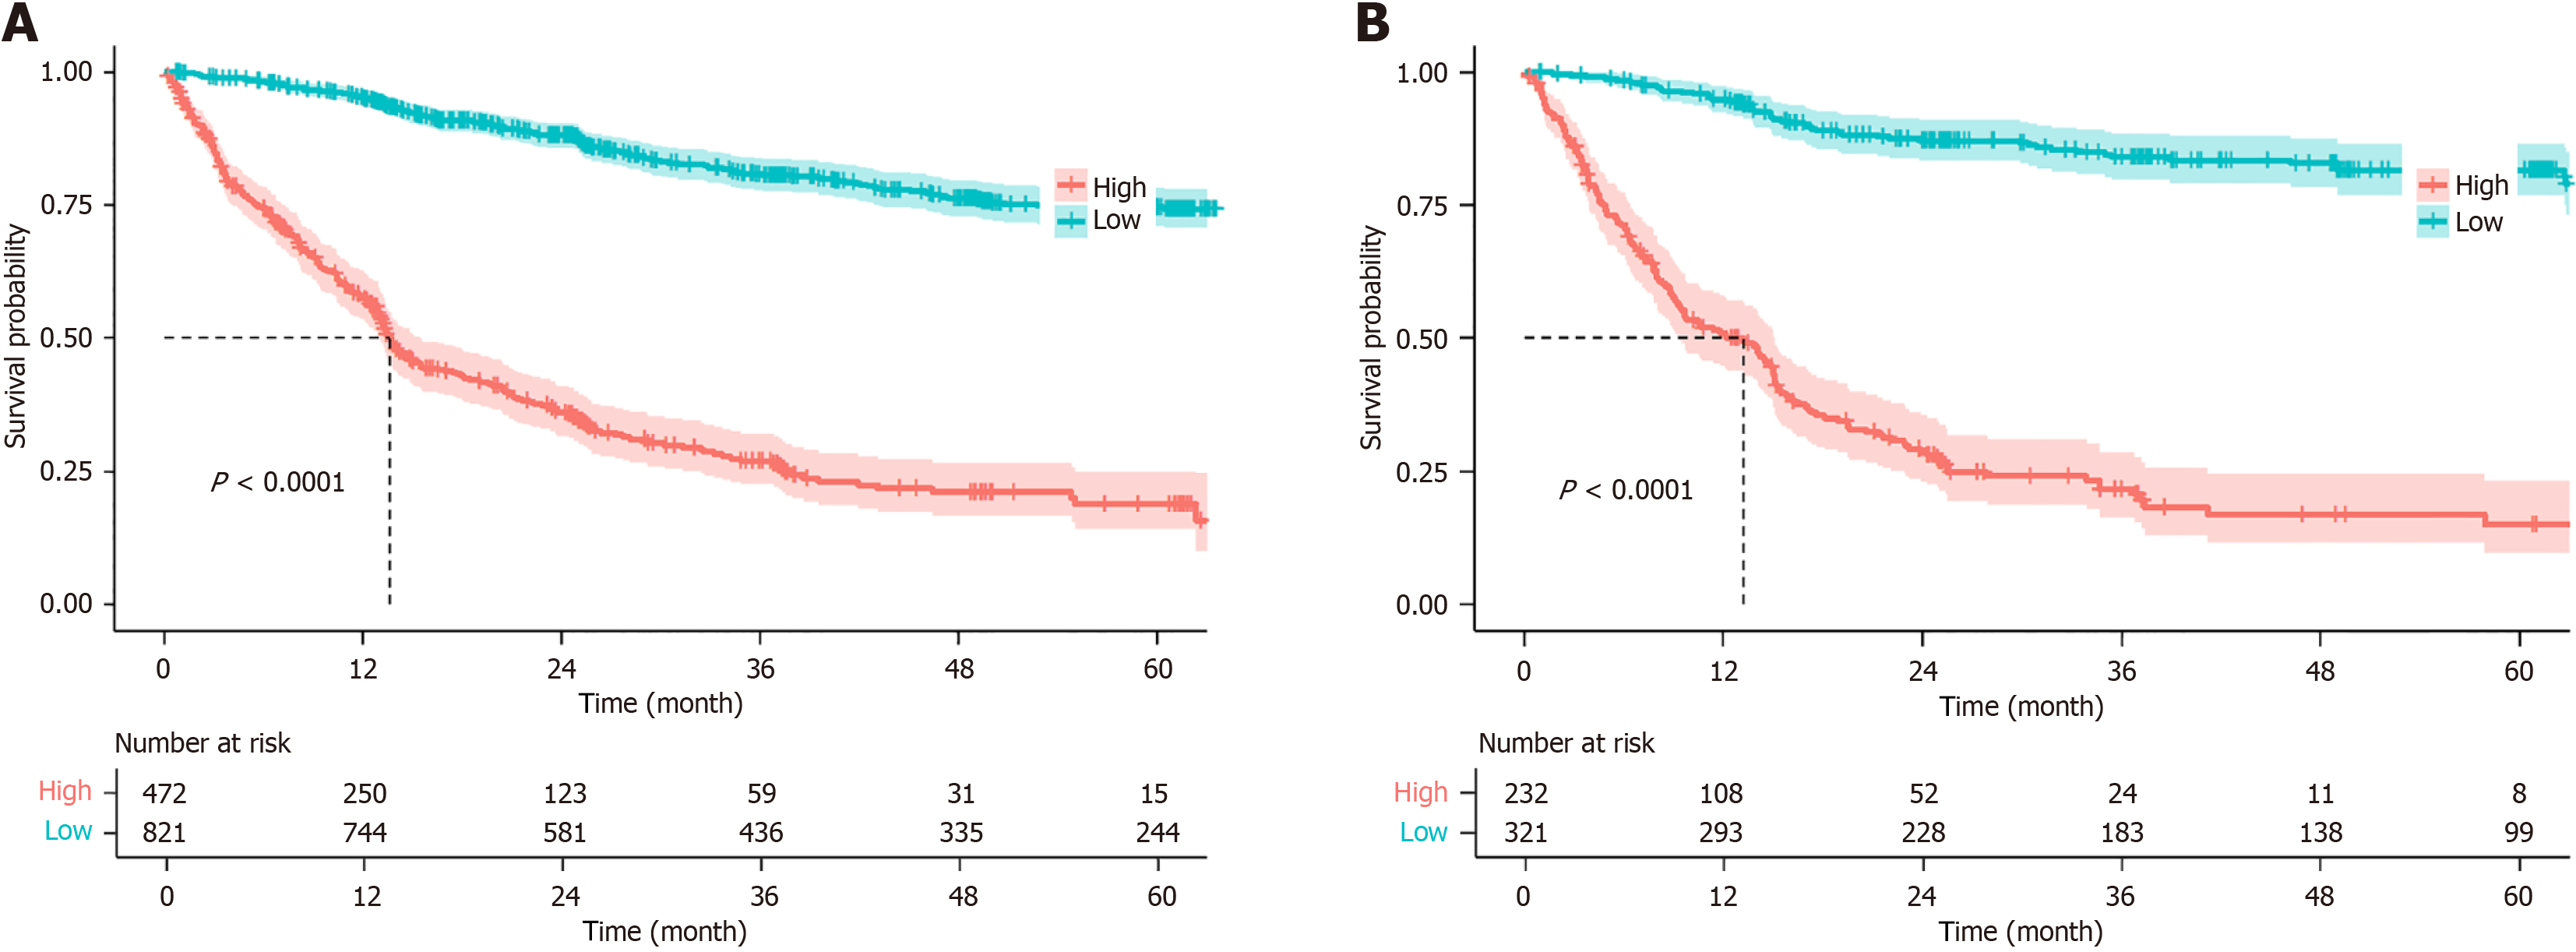
Figure 5 Kaplan-Meier survival curves for rectal cancer patients after stratification by the nomogram.
A: In the training cohort; B: In the validation cohort.
- Citation: Liang L, Li XS, Huang ZJ, Hu ZH, Xu QJ, Yuan YL, Zhang W, Lei HK. Development and validation of a nomogram prediction model for overall survival in patients with rectal cancer. World J Gastrointest Oncol 2025; 17(2): 100908
- URL: https://www.wjgnet.com/1948-5204/full/v17/i2/100908.htm
- DOI: https://dx.doi.org/10.4251/wjgo.v17.i2.100908


