Copyright
©The Author(s) 2025.
World J Gastrointest Oncol. Nov 15, 2025; 17(11): 110675
Published online Nov 15, 2025. doi: 10.4251/wjgo.v17.i11.110675
Published online Nov 15, 2025. doi: 10.4251/wjgo.v17.i11.110675
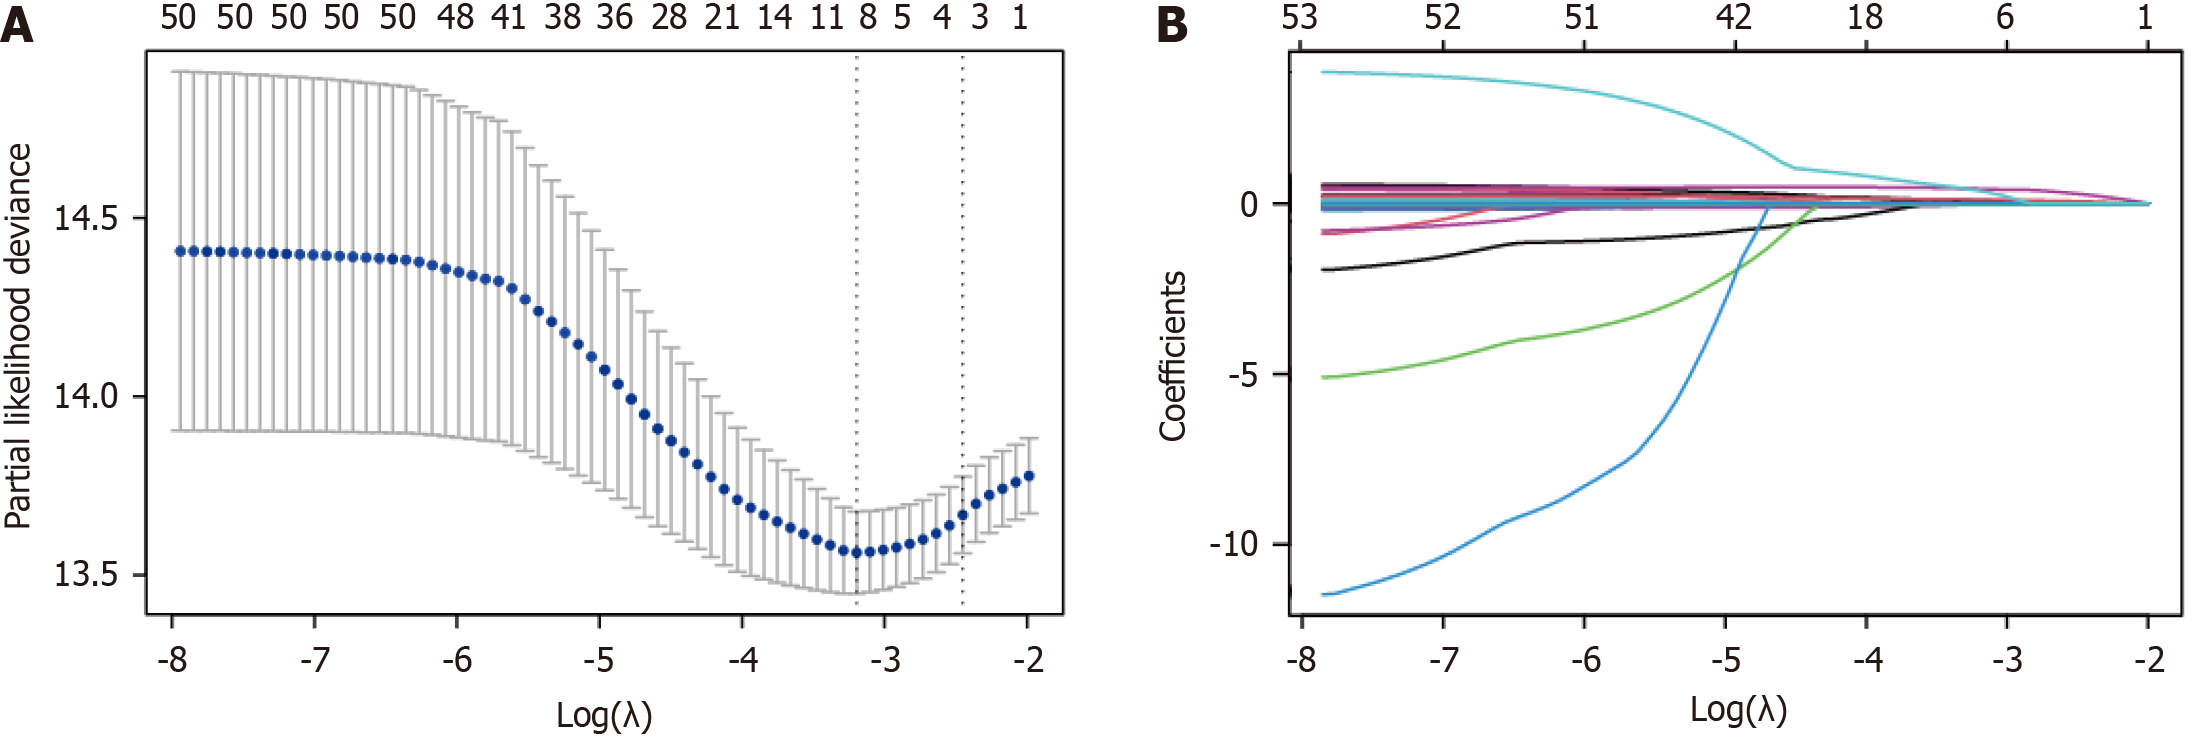
Figure 1 Selection of factors associated with overall survival using the least absolute shrinkage and selection operator-Cox regression model.
A: The upper abscissa is the number of non-zero coefficients in this model, and the ordinate is the coefficient value. least absolute shrinkage and selection operator (LASSO) coefficients of 50 candidate variables (age, sex, different nationalities, tumor size, lymph node metastasis, surgical method, grade, vascular invasion, nerve invasion, and marital, menstrual, and vital status); B: The optimal penalization coefficient in the LASSO model was identified by 10-fold cross-validation and the minimum criterion in the training cohort. The left vertical dotted line represents the minimum error, and the right line represents the cross-validated error within one standard error of the minimum. The upper abscissa indicates the number of independent variables that still exist in the model.
Figure 2 The nomogram for the prediction of 1-year, 3-year, and 5-year overall survival in patients with postoperative colorectal cancer liver metastases.
APTT: Activated partial thromboplastin time; GGT: Gamma-glutamyl transferase.
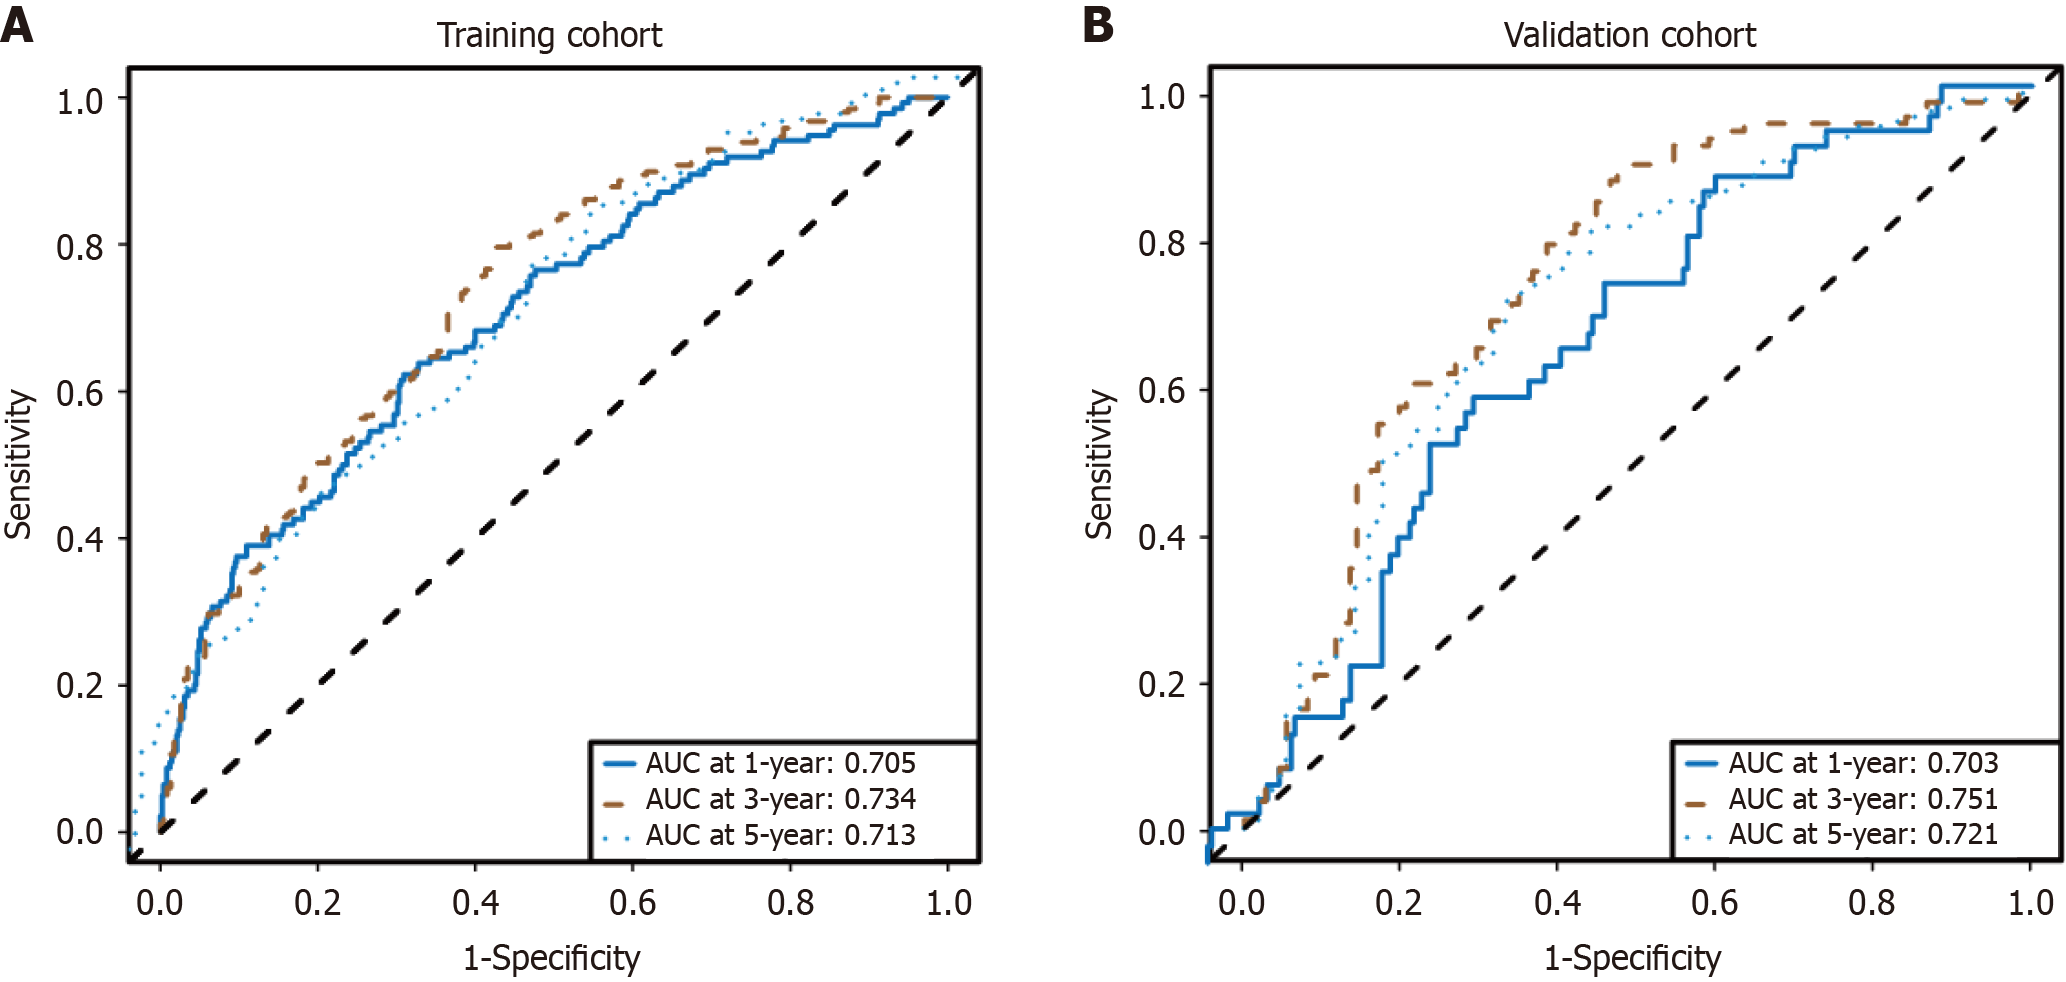
Figure 3 Predictive performance of the survival nomogram for colorectal cancer liver metastases patients reflected by receiver operating characteristic curves.
A: Receiver operating characteristic (ROC) curves for the 1-, 3- and 5-year overall survival (OS) in patients in the training cohort; B: ROC curves for the 1-, 3- and 5-year OS in patients in the validation cohort. AUC: Area under the curve.
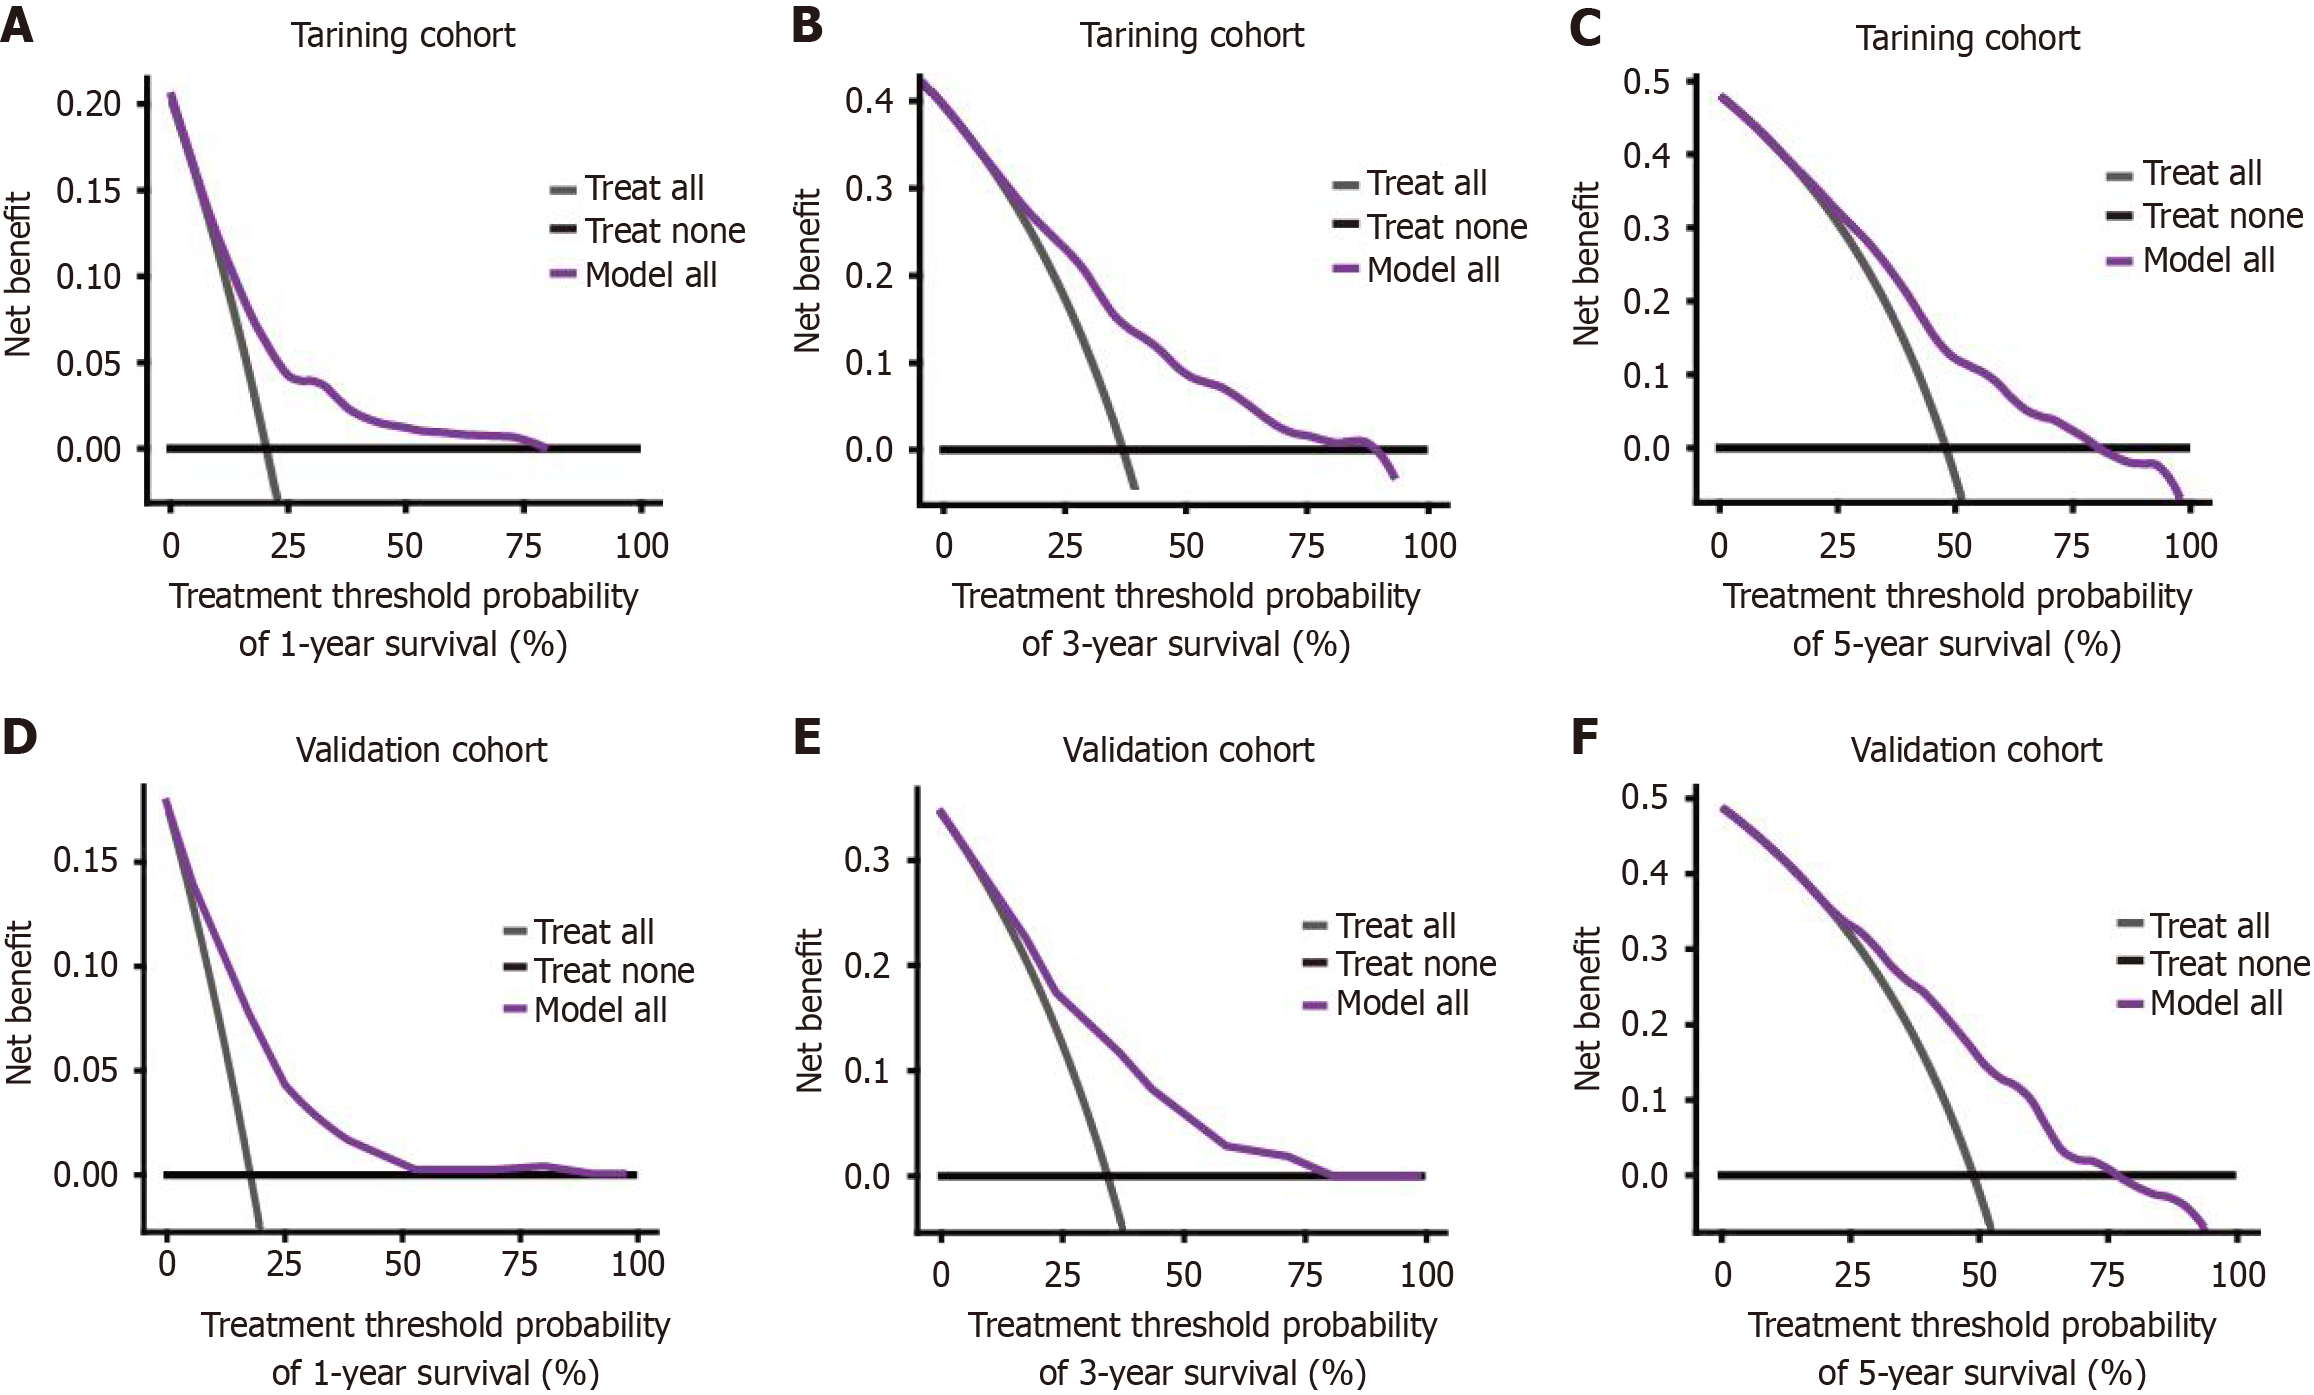
Figure 4 Performance comparison of decision curve analysis.
A: Logistic decision curve analysis (DCA) analysis of 1-year overall survival (OS) in the training set; B: Logistic DCA analysis of 3-year OS in the training set; C: Logistic DCA analysis of 5-year OS in the training set; D: Logistic DCA analysis of 1-year OS in the internal validation set; E: Logistic DCA analysis of 3-year OS in the internal validation set; F: Logistic DCA analysis of 5-year OS in the internal validation set.
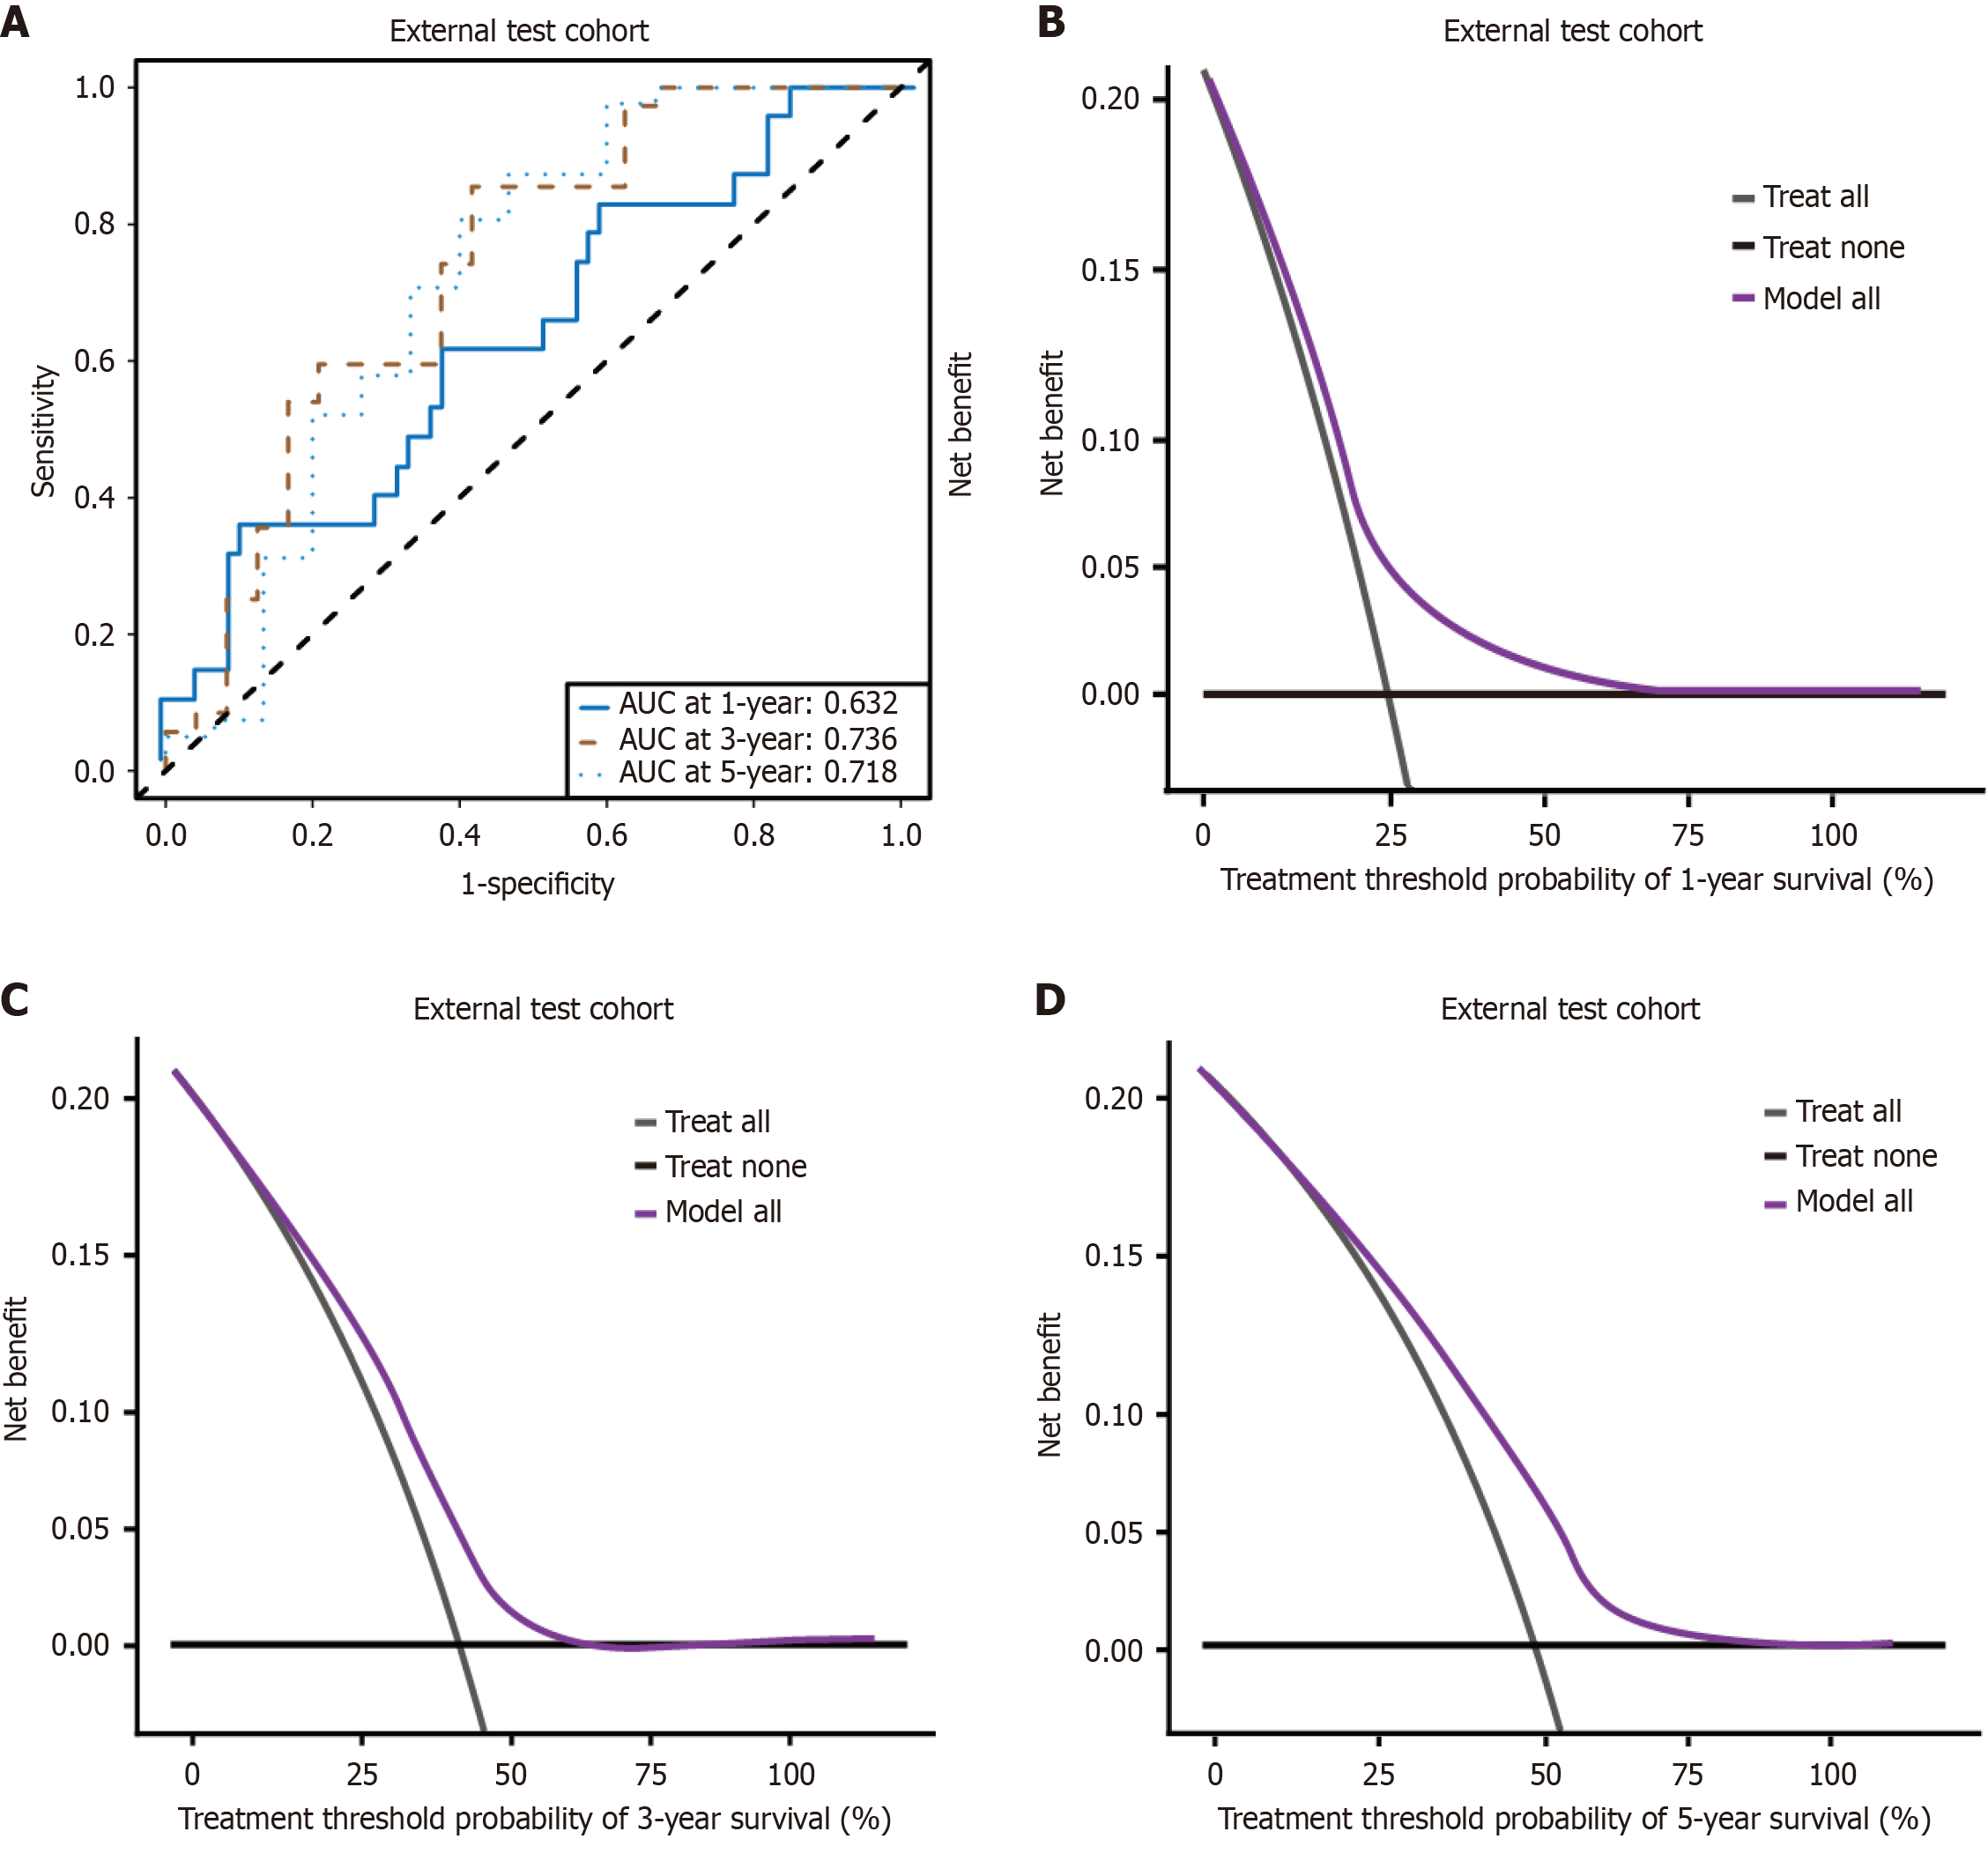
Figure 5 Model performance in the external test cohort.
A: Receiver operating characteristic curves of the external test cohort at 1-year, 3-year, and 5-year survival; B: Decision curve analysis (DCA) of the external test cohort for 1-year survival; C: DCA of the external test cohort for 3-year survival; D: DCA of external test cohort for 5-year survival. AUC: Area under the curve.
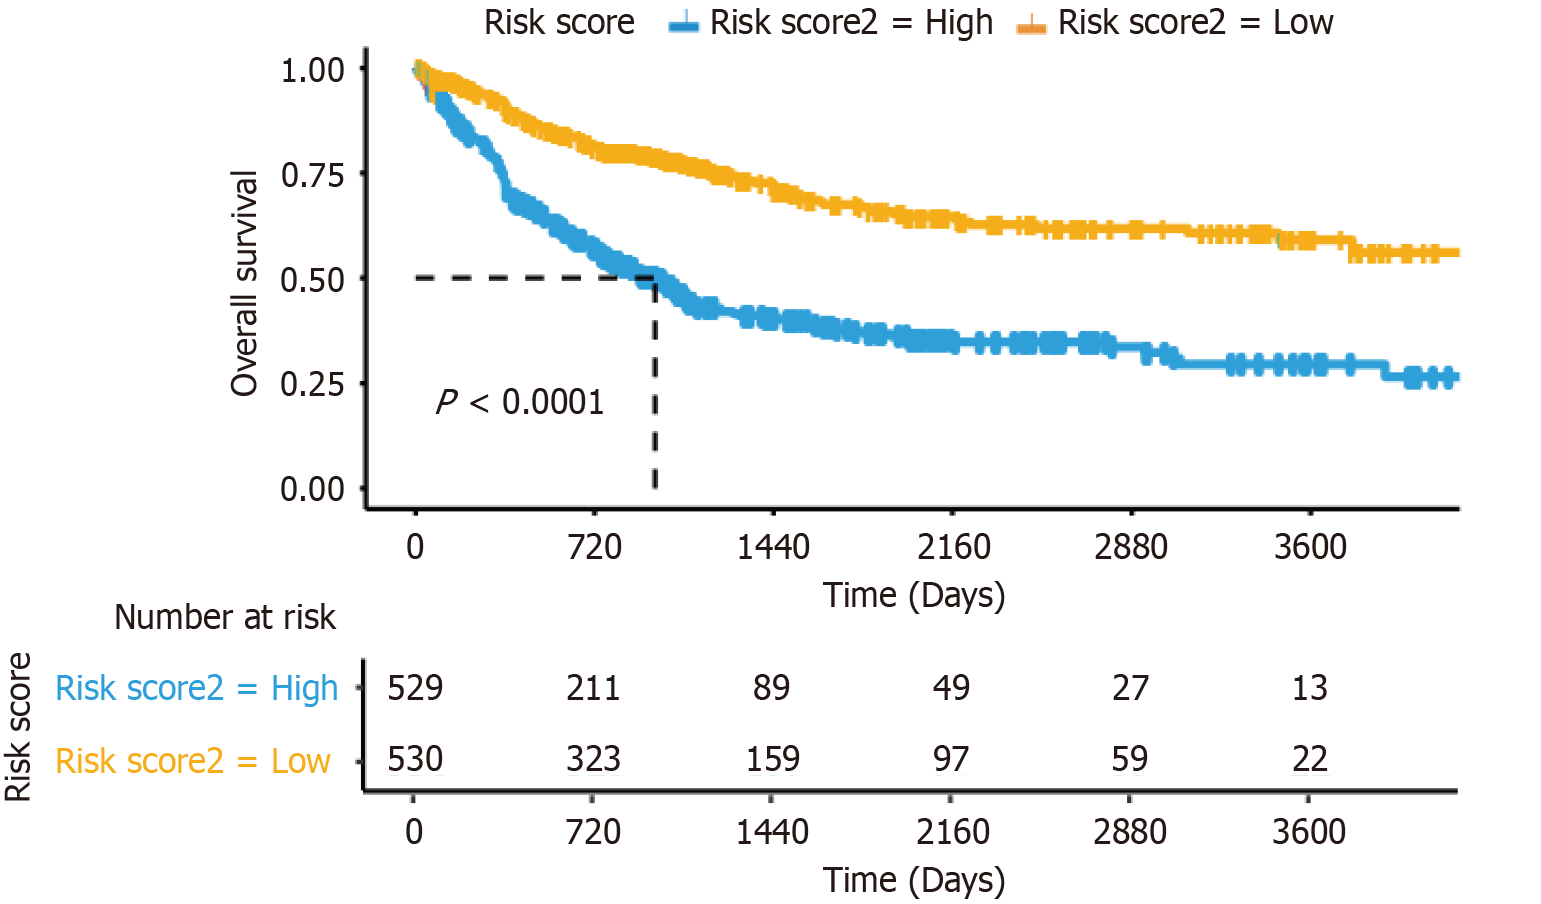
Figure 6 According to the Kaplan-Meier curve of risk score for all patients, patients in the low-risk group had significantly better overall survival than those in the high-risk group.
- Citation: Xie MJ, Li JJ, Guo YJ, Wang Q, Tan ZB, Li YL, Li JP. Construction of a prognostic model for colorectal cancer liver metastasis: A retrospective study based on population data. World J Gastrointest Oncol 2025; 17(11): 110675
- URL: https://www.wjgnet.com/1948-5204/full/v17/i11/110675.htm
- DOI: https://dx.doi.org/10.4251/wjgo.v17.i11.110675


