Copyright
©The Author(s) 2025.
World J Gastrointest Oncol. Nov 15, 2025; 17(11): 110266
Published online Nov 15, 2025. doi: 10.4251/wjgo.v17.i11.110266
Published online Nov 15, 2025. doi: 10.4251/wjgo.v17.i11.110266
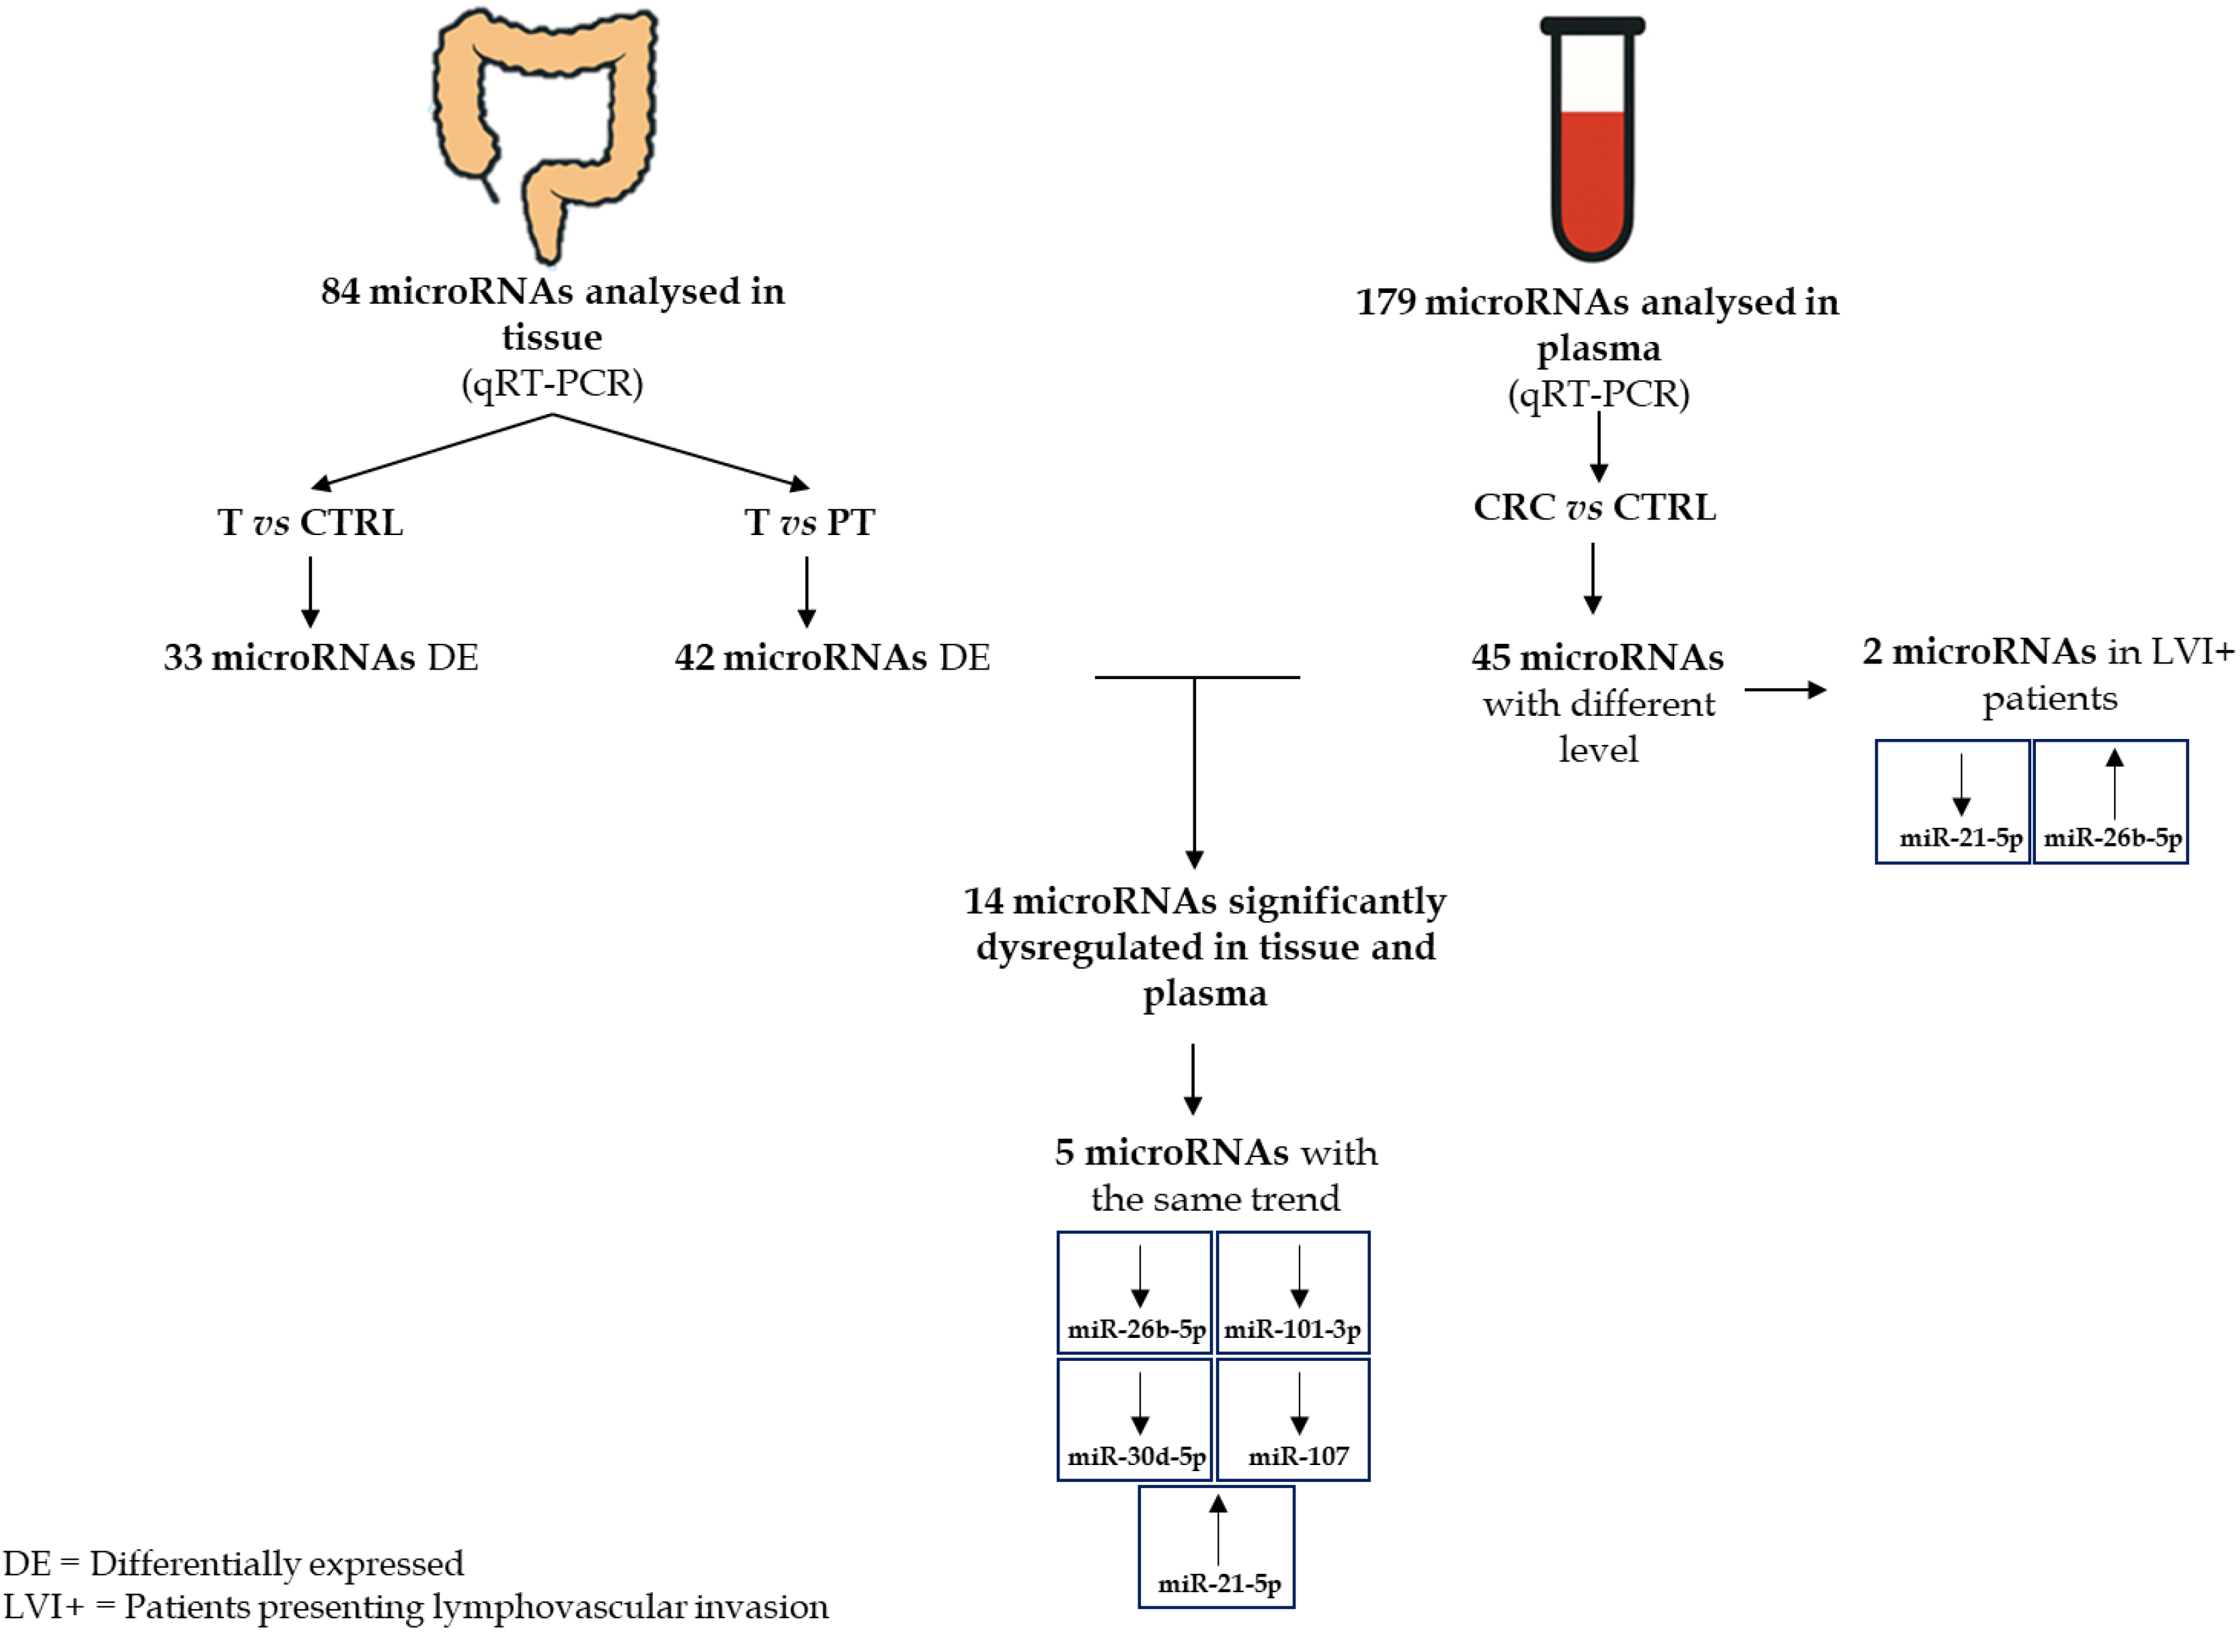
Figure 1 Graphical abstract summarizing the study workflow.
qRT-PCR: Quantitative real-time polymerase chain reaction; T: Tumoral; CTRL: Control; PT: Peritumoral; DE: Differentially expressed; CRC: Colorectal cancer; LVI: Lymphovascular invasion.
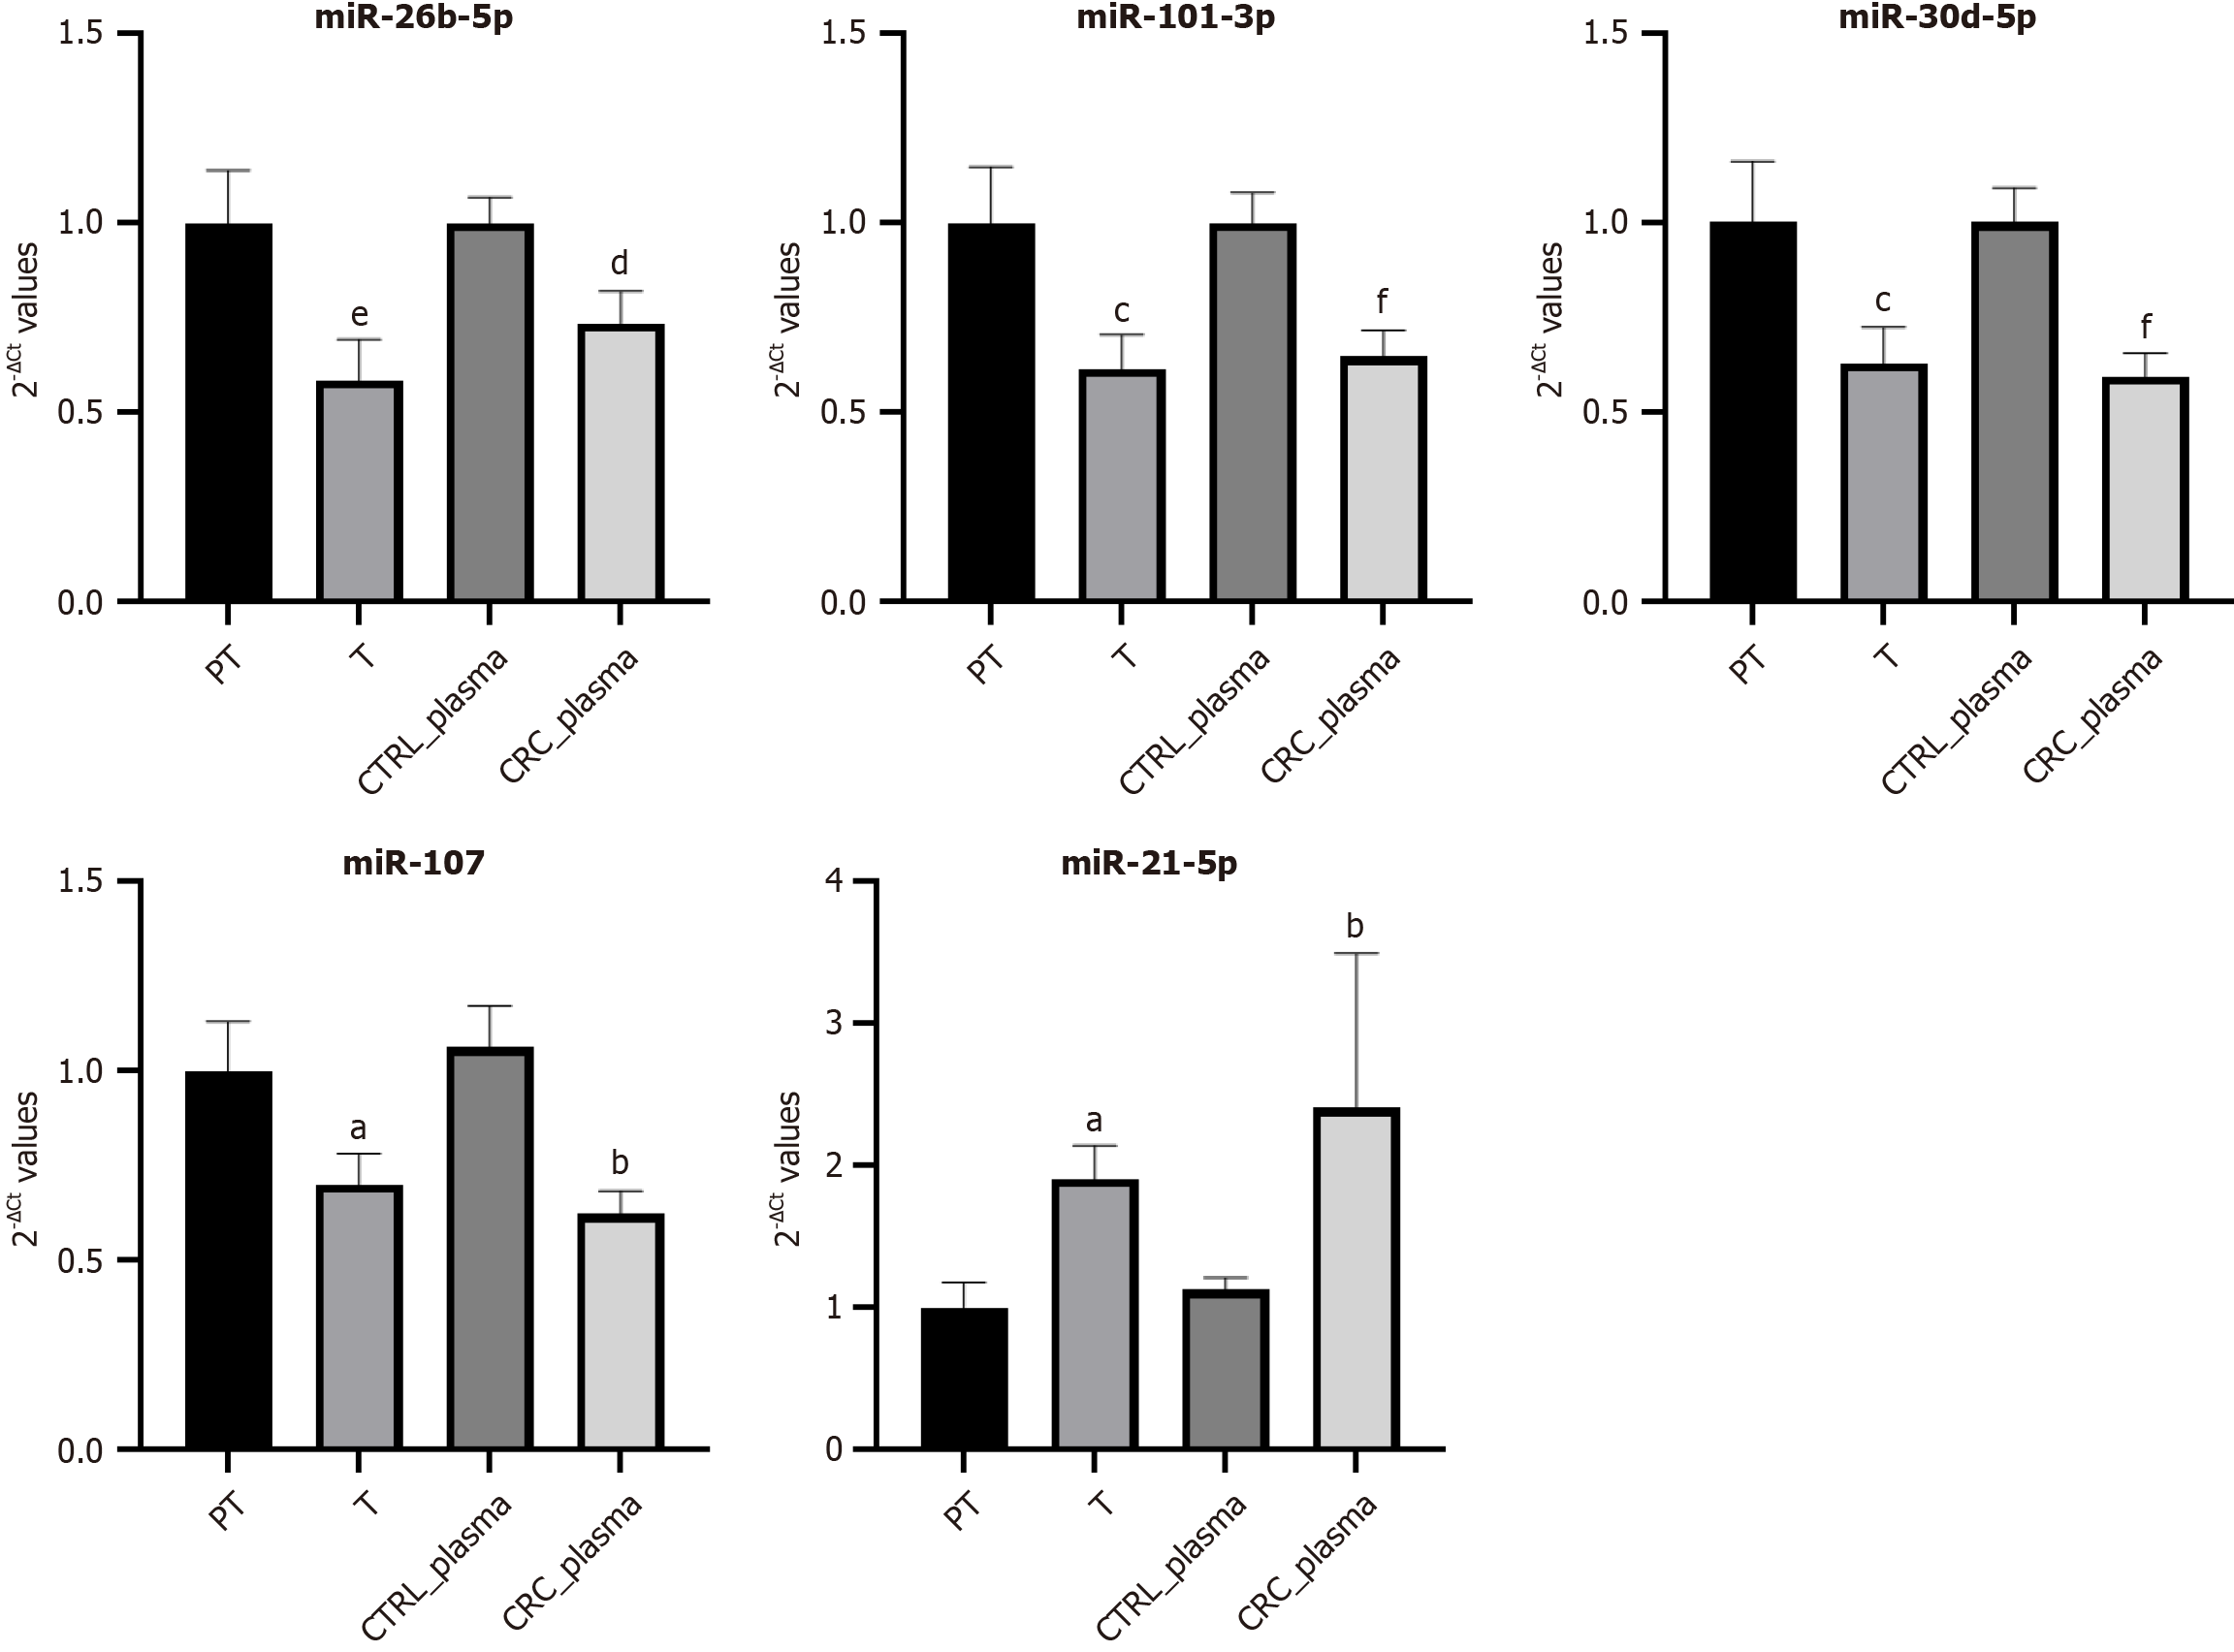
Figure 2 The levels of miR-26b-5p, miR-101-3p, miR-30d-5p, miR-107 and miR-21-5p in tumoral vs peritumoral and plasma from colorectal cancer patients vs control plasma.
Bar graphs represent the fold change values, and error bars represent the standard error of the mean. Statistical significance was calculated using the Wilcoxon signed-rank test in tumoral vs peritumoral analysis, and the Mann-Whitney test in colorectal cancer plasma vs control plasma analysis. T: Tumoral; CTRL: Control; PT: Peritumoral; CRC: Colorectal cancer. aP < 0.05 vs peritumoral, bP < 0.05 vs control plasma, cP < 0.01 vs peritumoral, dP < 0.01 vs control plasma, eP < 0.001 vs peritumoral, and fP < 0.001 vs control plasma.
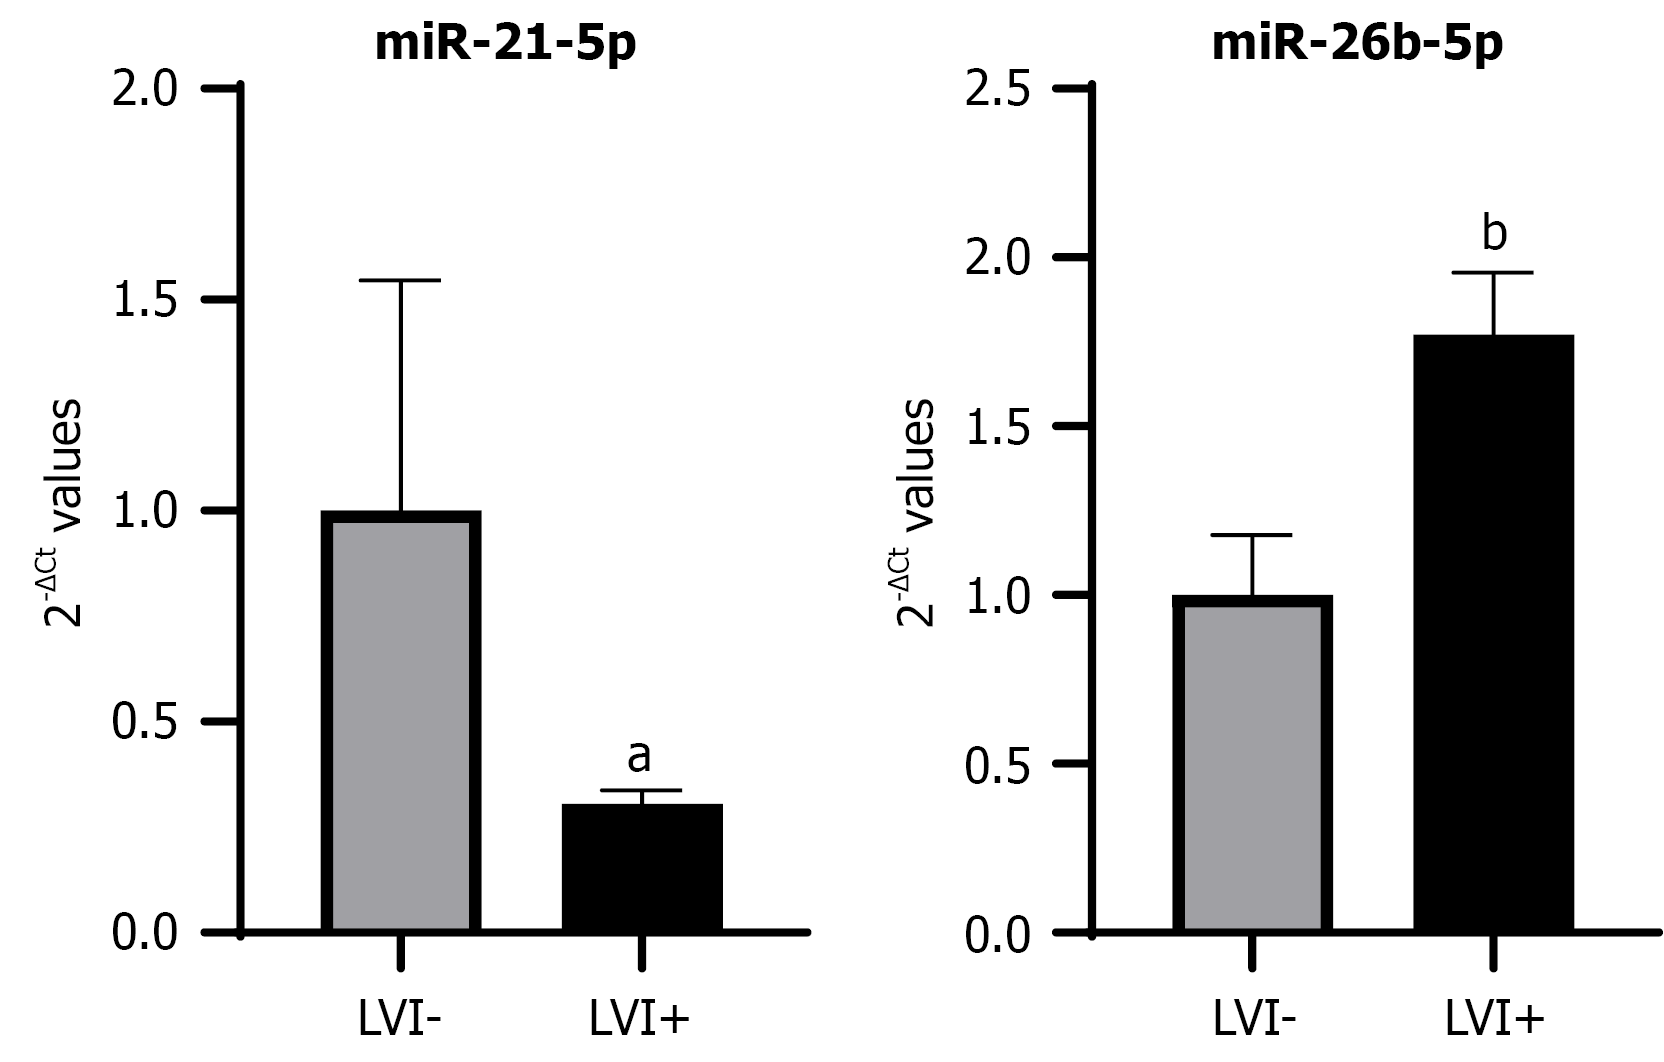
Figure 3 Levels of miR-21-5p and miR-26b-5p in plasma from patients with lymphovascular invasion (lymphovascular invasion+) vs non-vascular invasion (lymphovascular invasion-).
Bar graphs represent the fold change values, and error bars represent the standard error of the mean. Statistical significance was calculated using the Mann-Whitney test. LVI: Lymphovascular invasion. aP < 0.05, and bP < 0.01.
- Citation: Pelisenco IA, Trandafir B, Dobre AM, Dragne AD, Herlea V, Niculae AM, Vasilescu C, Hinescu ME, Milanesi E, Dobre M. MicroRNAs in colorectal cancer: A comparative analysis of circulating and tissue microRNA levels. World J Gastrointest Oncol 2025; 17(11): 110266
- URL: https://www.wjgnet.com/1948-5204/full/v17/i11/110266.htm
- DOI: https://dx.doi.org/10.4251/wjgo.v17.i11.110266


