©The Author(s) 2025.
World J Gastrointest Oncol. Jan 15, 2025; 17(1): 99376
Published online Jan 15, 2025. doi: 10.4251/wjgo.v17.i1.99376
Published online Jan 15, 2025. doi: 10.4251/wjgo.v17.i1.99376
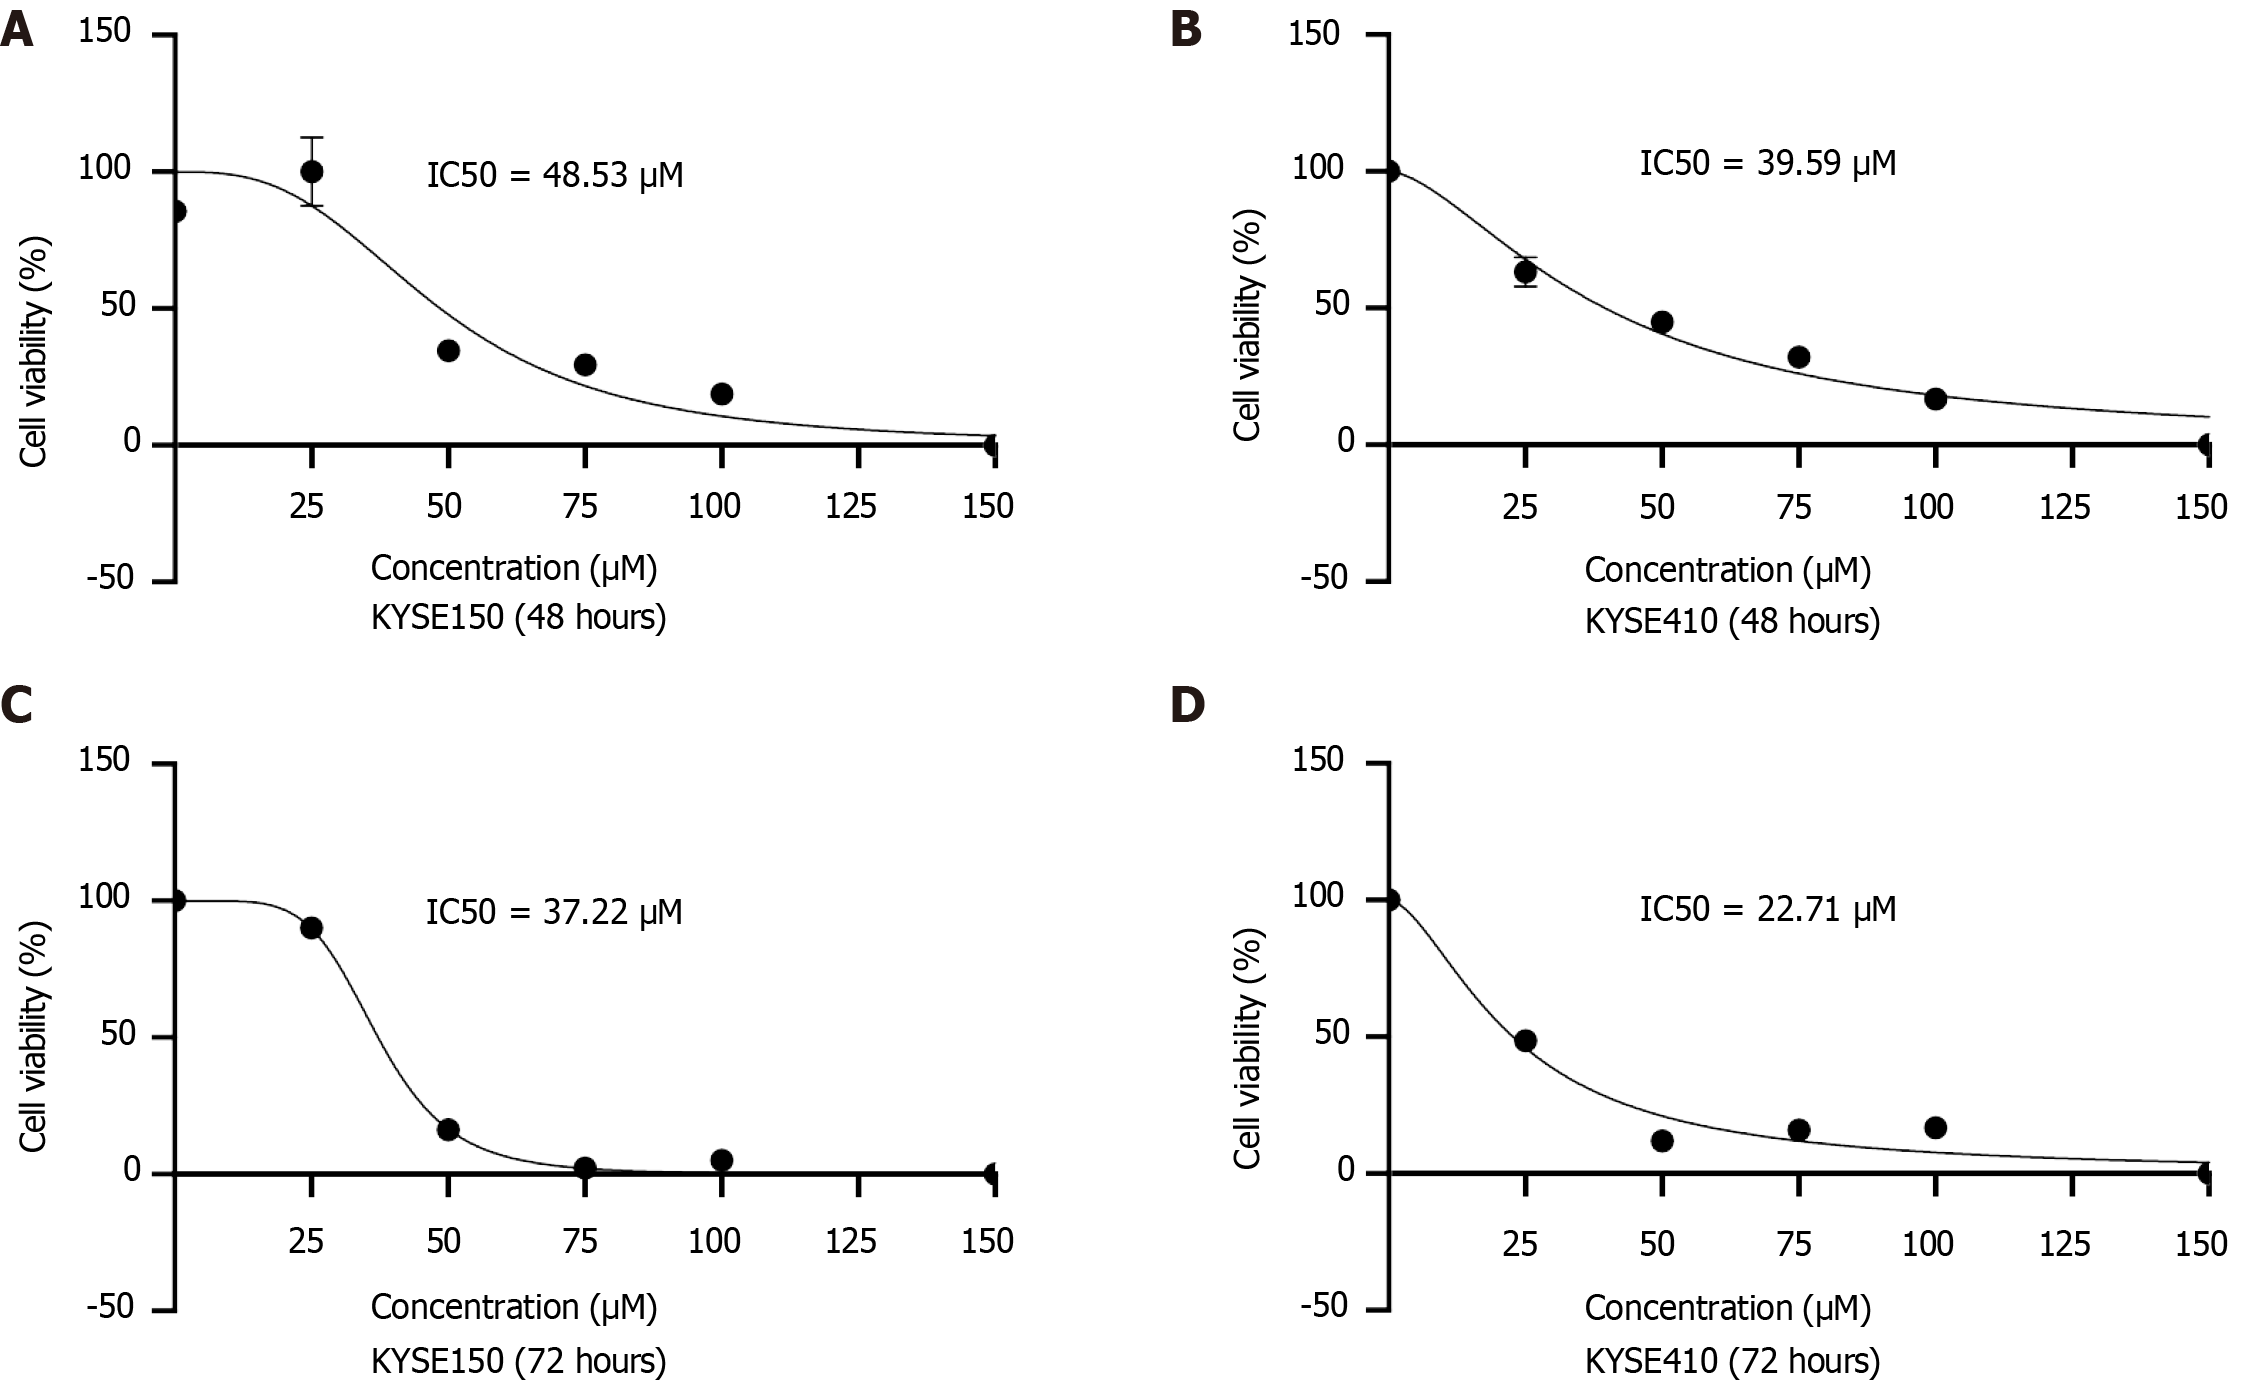
Figure 1 IC50 determination of BIBR1532 in esophageal squamous cell carcinoma cells.
A and B: Viability of KYSE150 (A) and KYSE410 (B) cells after treatment with the indicated concentrations of BIBR1532 for 48 hours; C and D: Viability of KYSE150 (C) and KYSE410 (D) cells after treatment with the indicated concentrations of BIBR1532 for 72 hours.
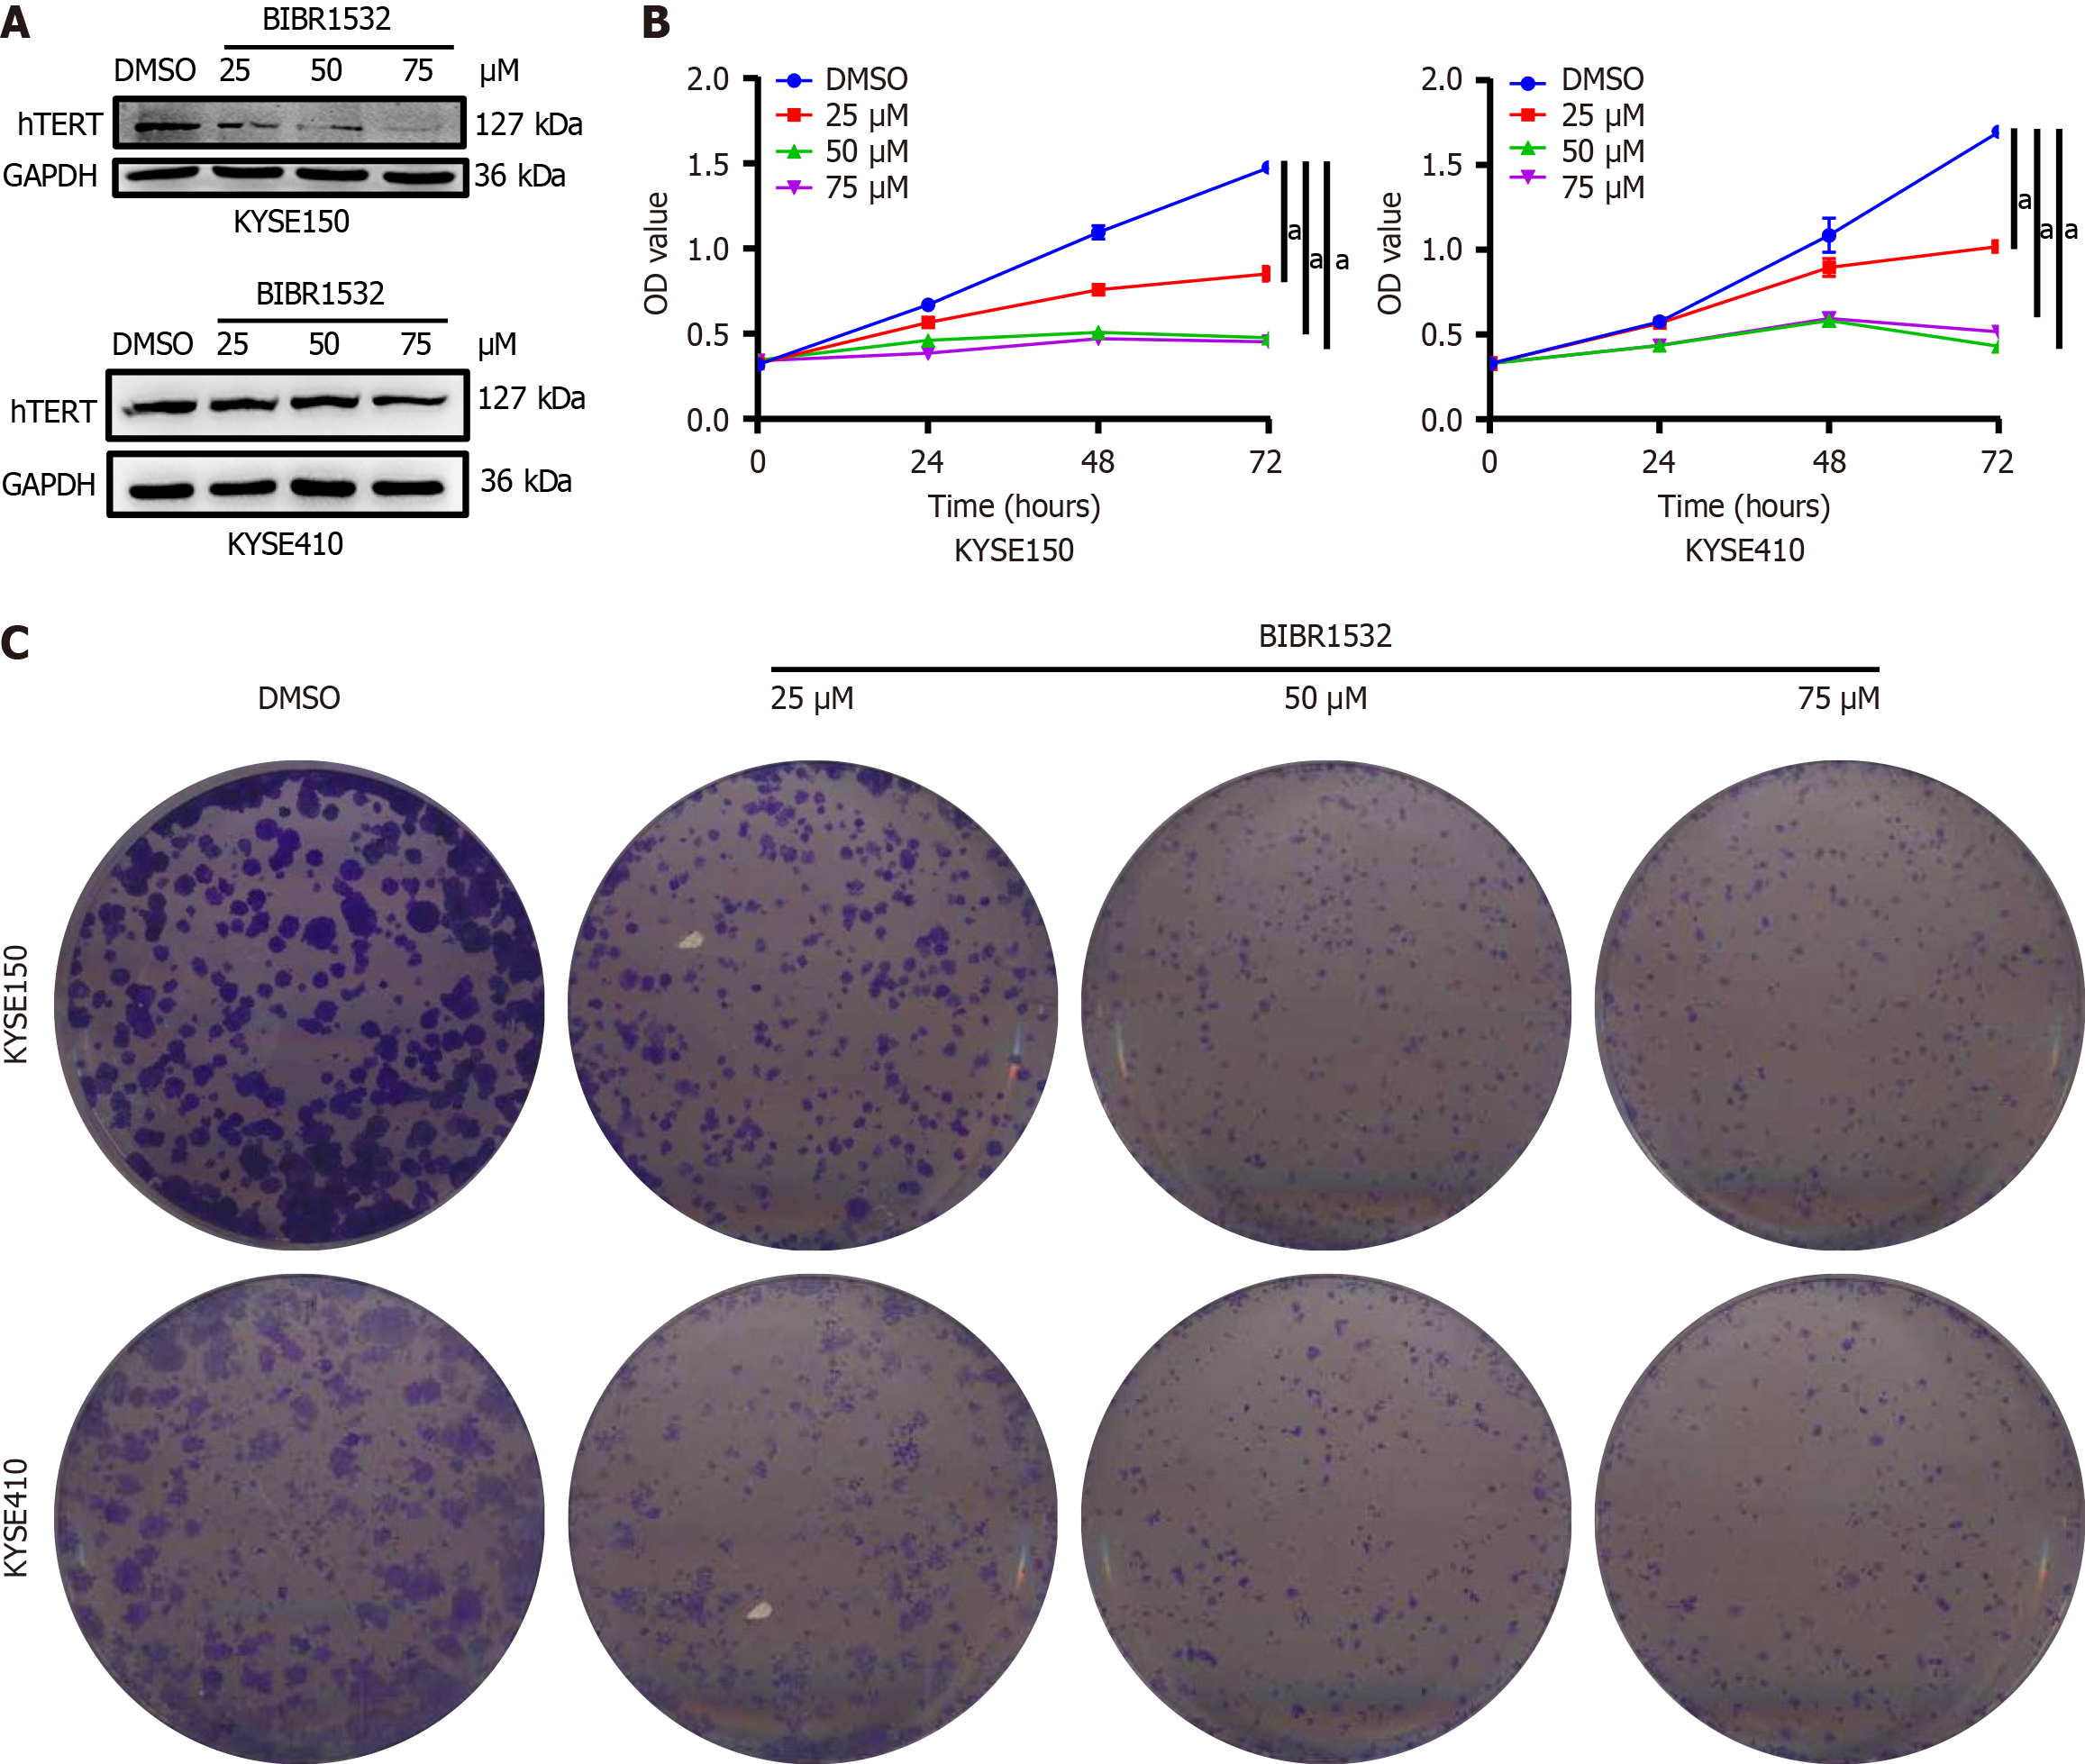
Figure 2 Effect of BIBR1532 on the proliferation of KYSE150 and KYSE410 cells.
A: Human telomerase reverse transcriptase expression in KYSE150 and KYSE410 cells after exposure to a series of BIBR1532 concentrations; B: Viability of KYSE150 and KYSE410 cells after treatment with various concentrations of BIBR1532 at the indicated time points; C: Plate colony formation by KYSE150 and KYSE410 cells after treatment with various concentrations of BIBR1532 at the indicated time points. aP < 0.05 was compared with the control group respectively. P < 0.05 was considered statistically significant. hTERT: Human telomerase reverse transcriptase.
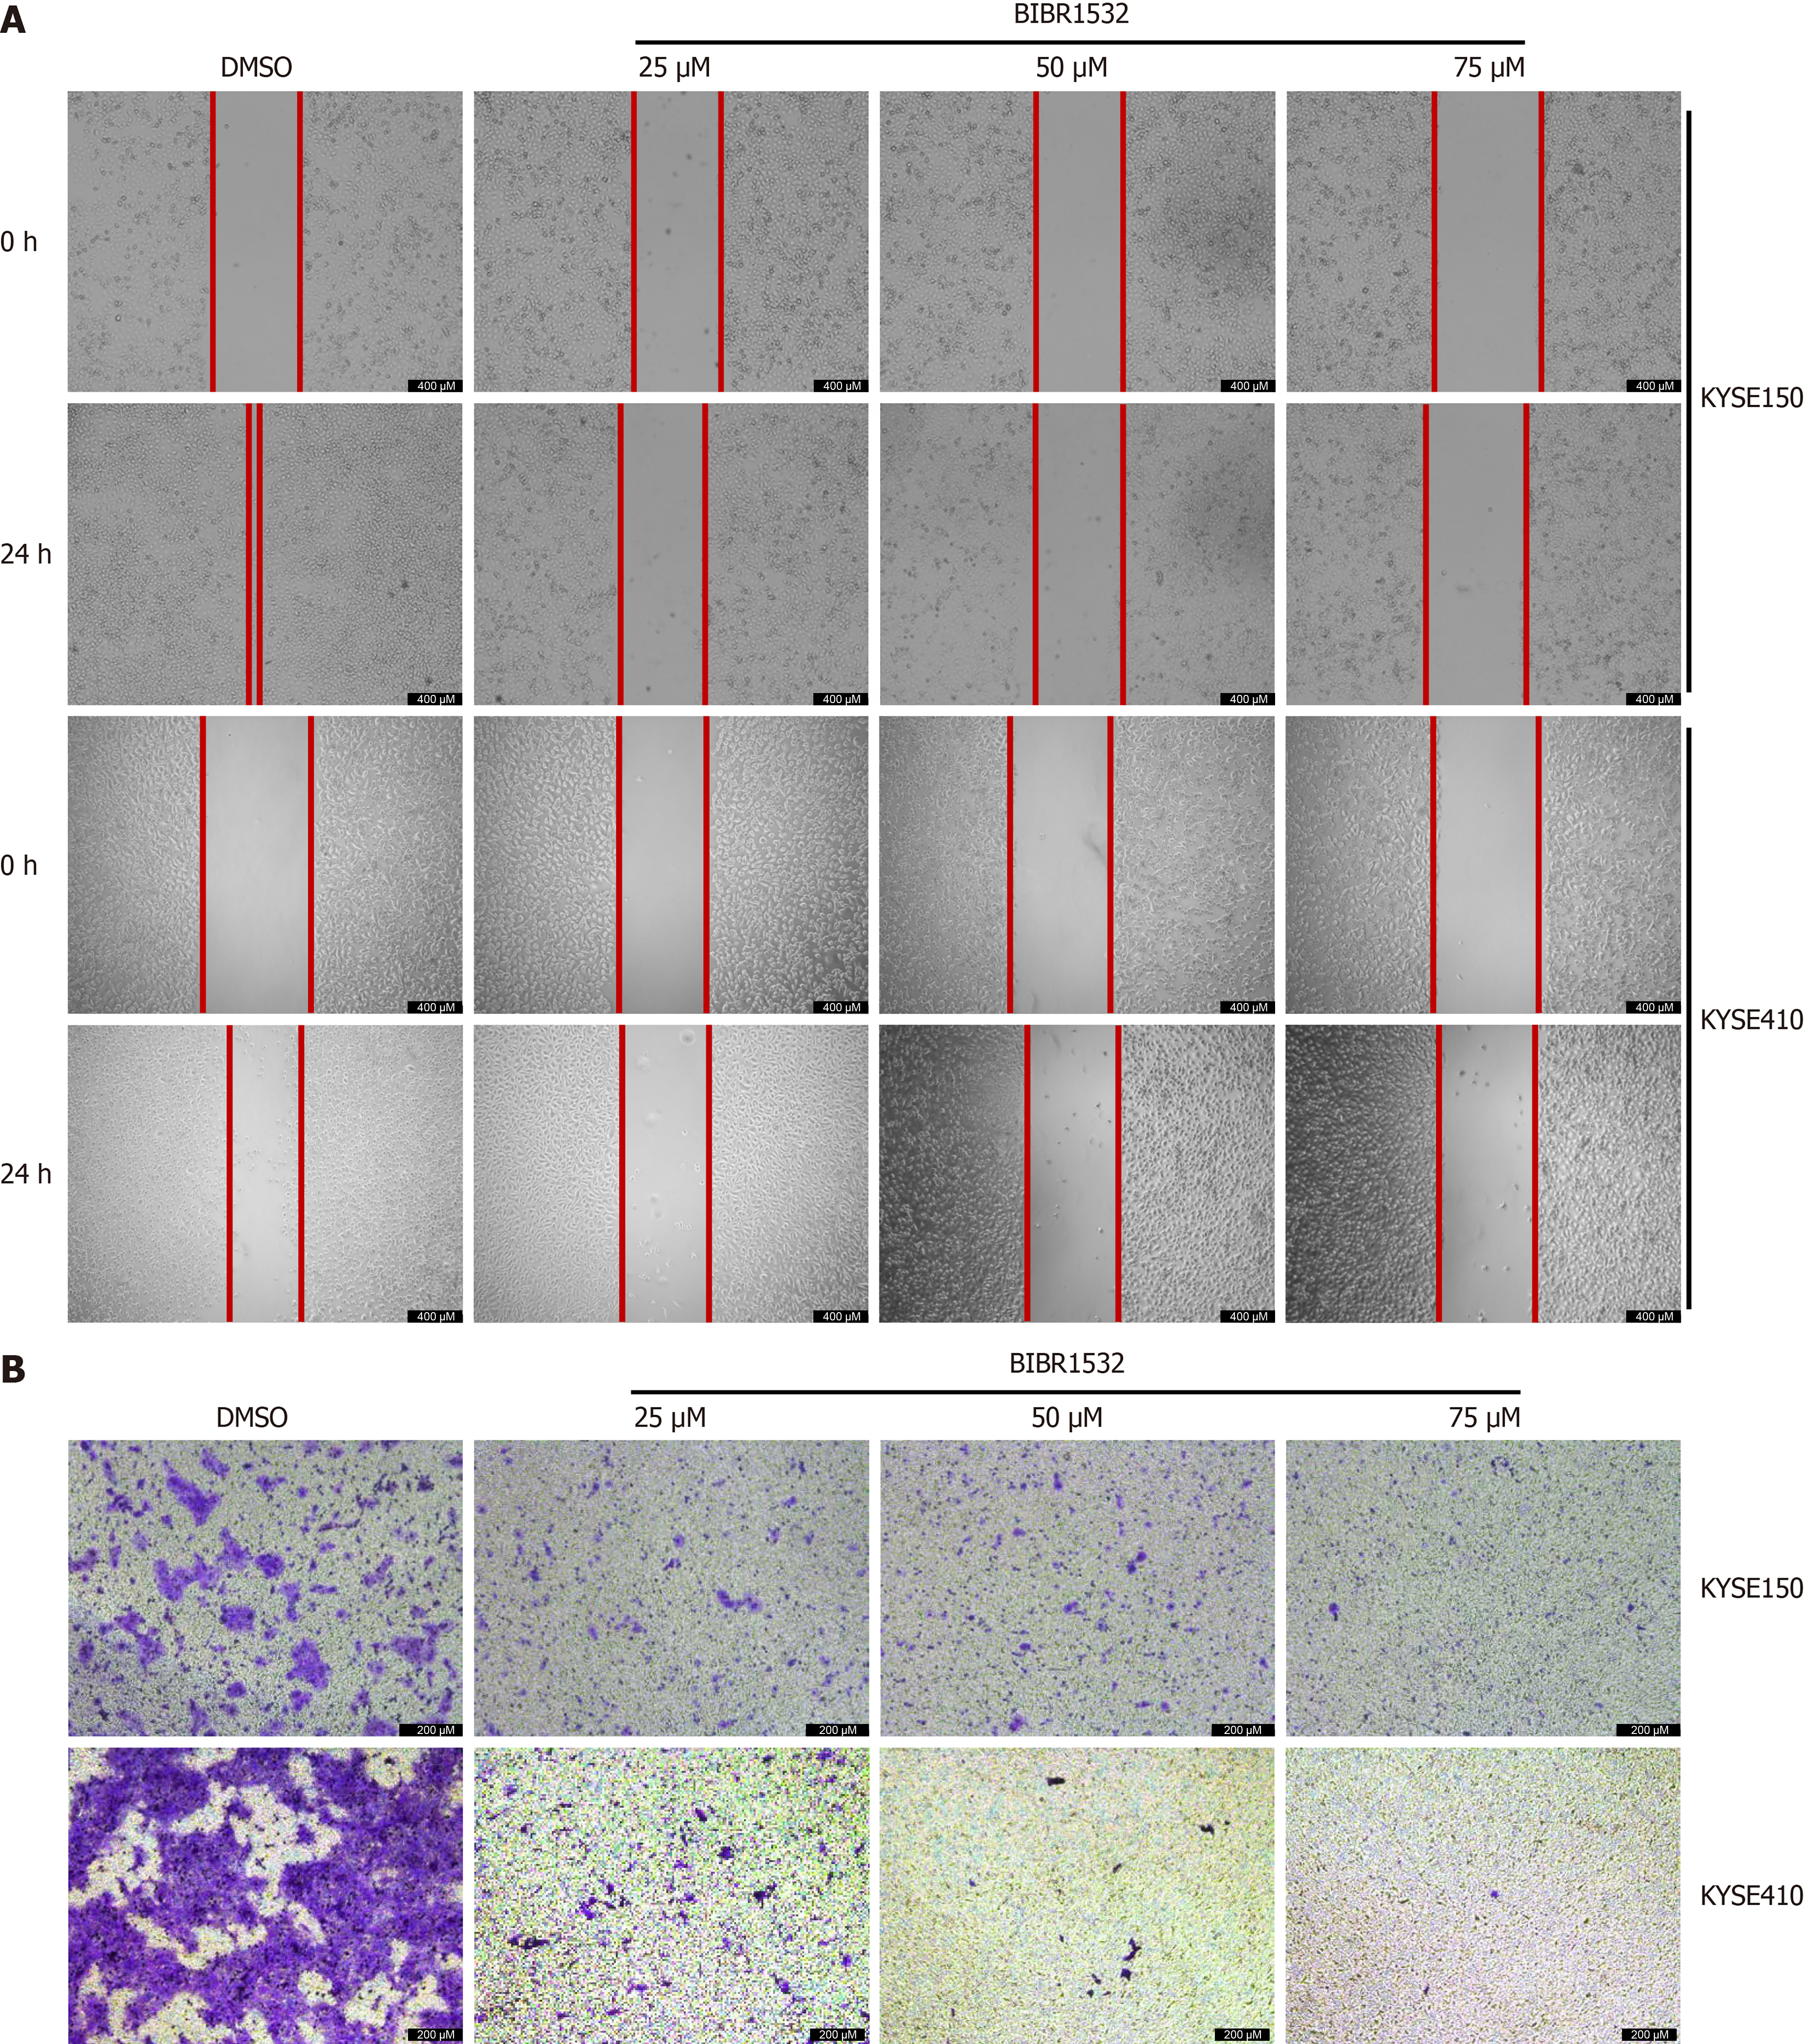
Figure 3 Effect of BIBR1532 on the migration of KYSE150 and KYSE410 cells.
A: Migration of KYSE150 and KYSE410 cells after treatment with various concentrations of BIBR1532 for 24 hours, as evaluated by scratch assay; B: Migration of KYSE150 and KYSE410 cells after treatment with various concentrations of BIBR1532 for 24 hours, as evaluated by the transwell assay.
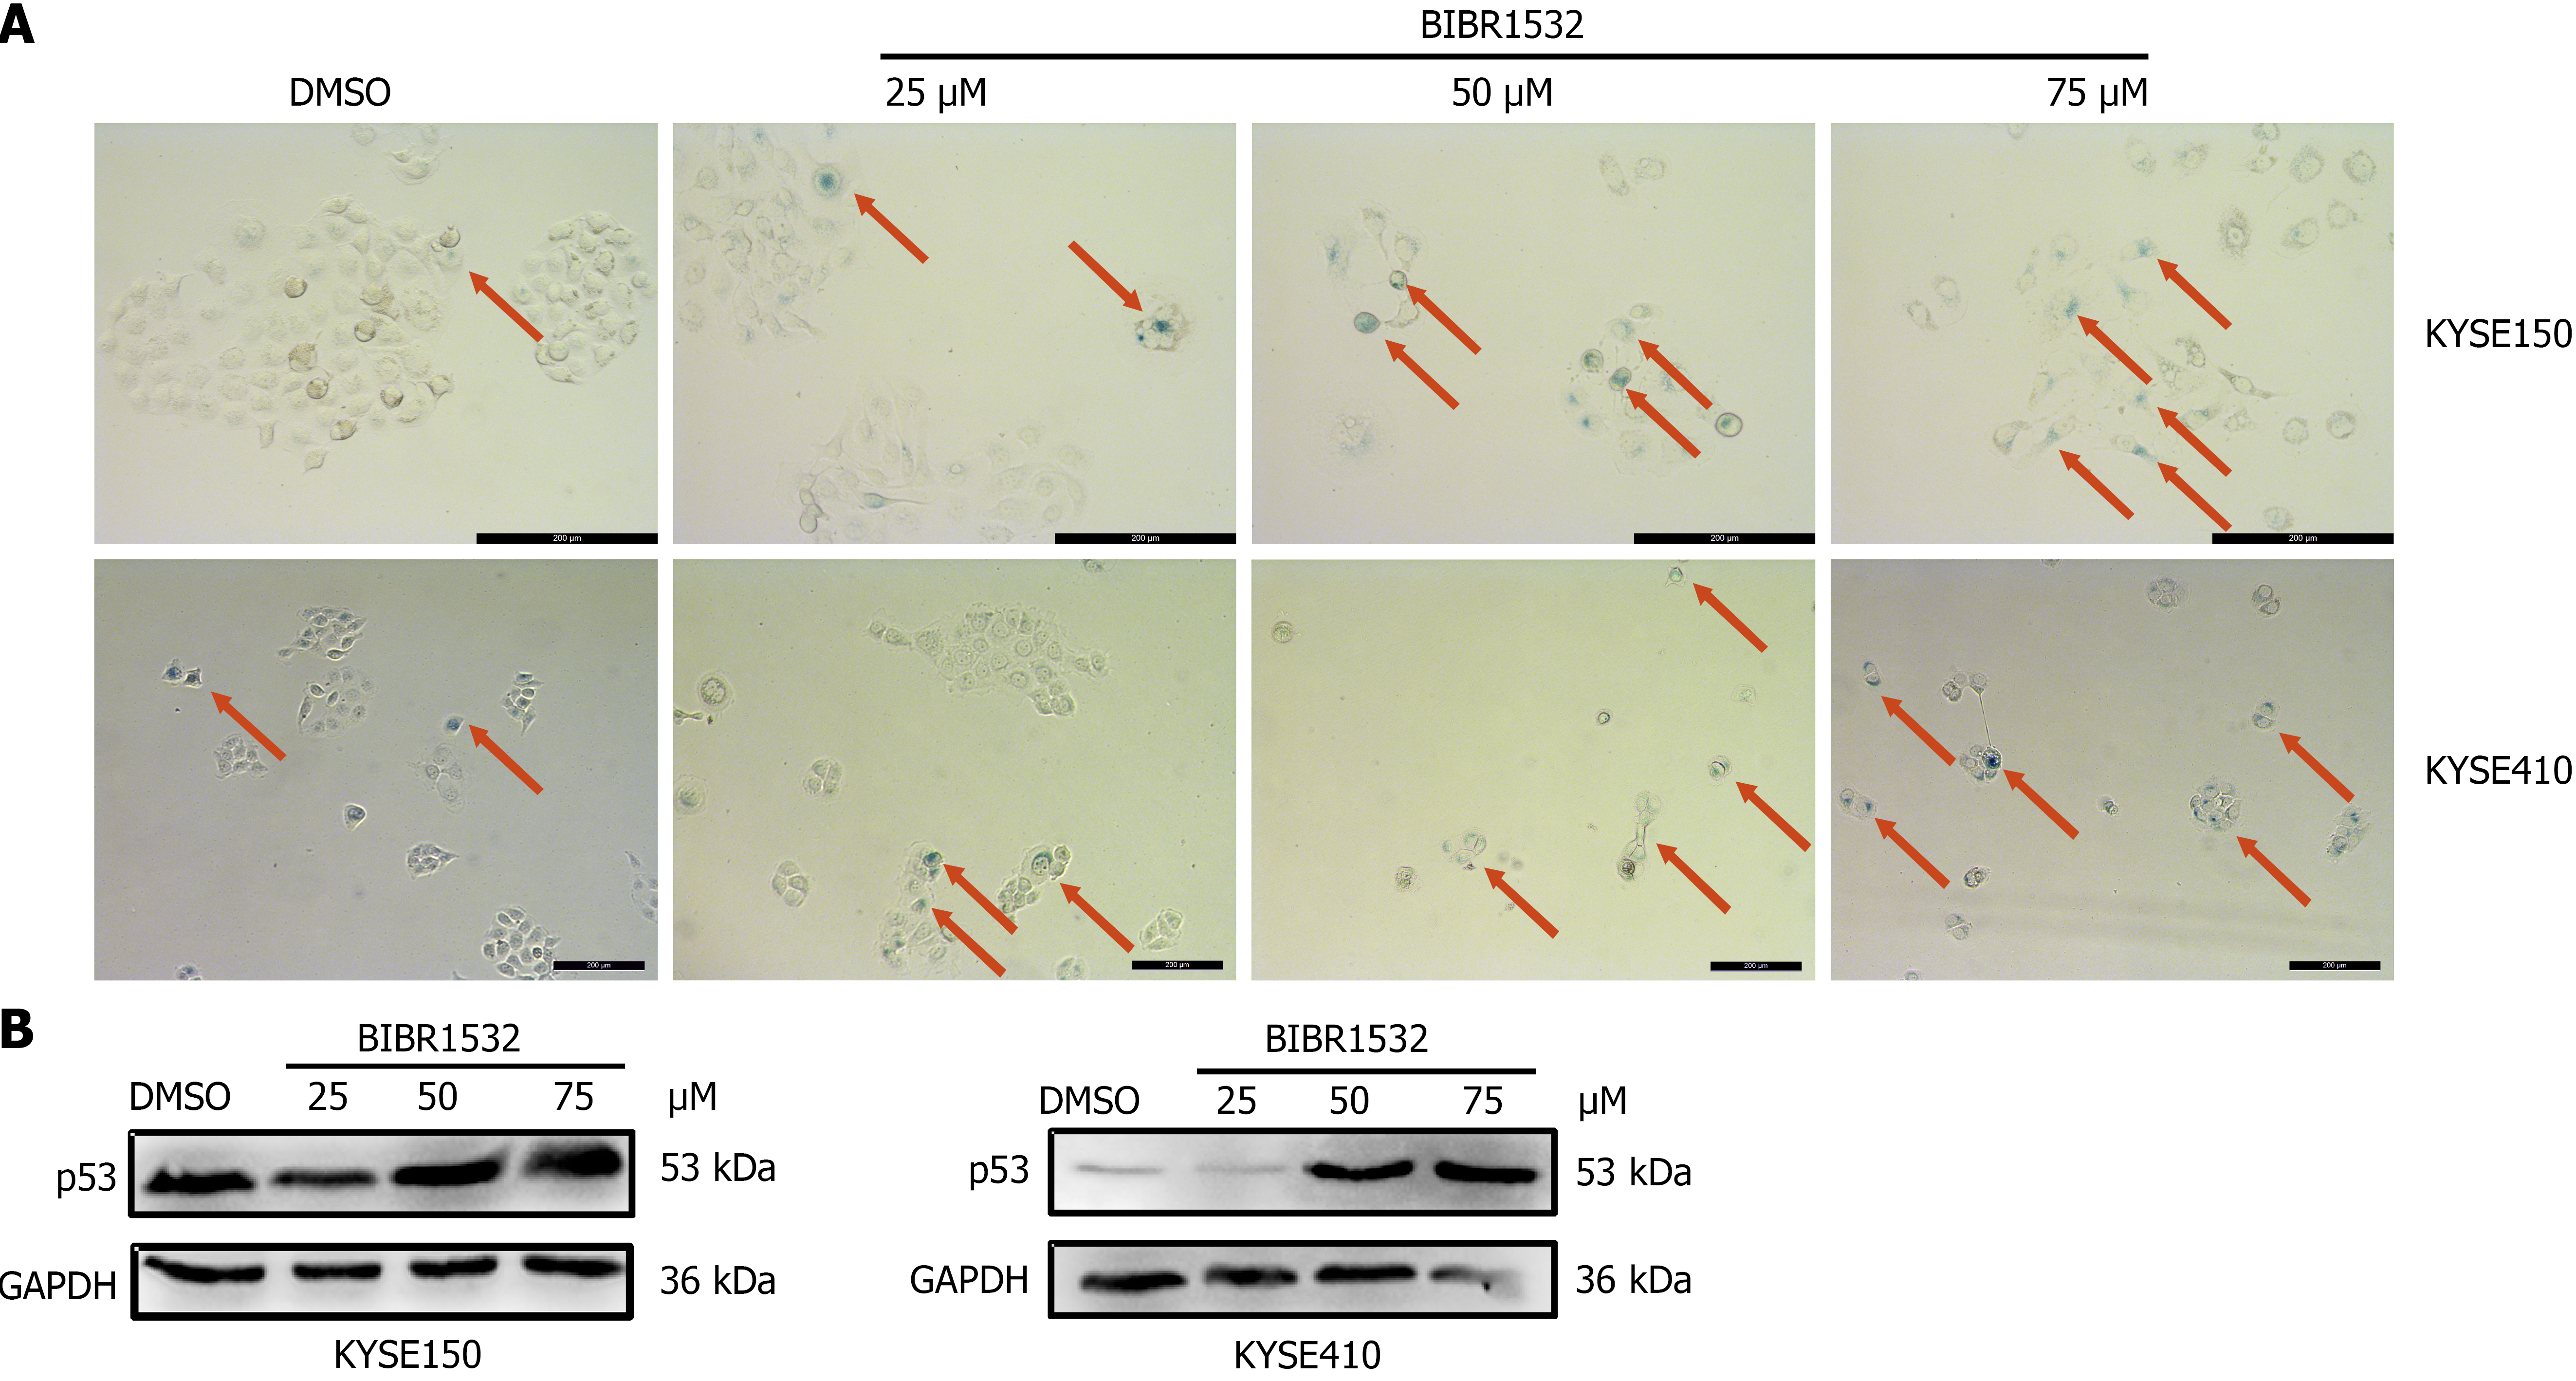
Figure 4 Effect of BIBR1532 on the senescence of KYSE150 and KYSE410 cells.
A: Senescence of KYSE150 and KYSE410 cells after treatment with various concentrations of BIBR1532 for 48 hours; B: Expression of the cell senescence biomarker p53 in KYSE150 and KYSE410 cells after treatment with various BIBR1532 concentrations for 48 hours.
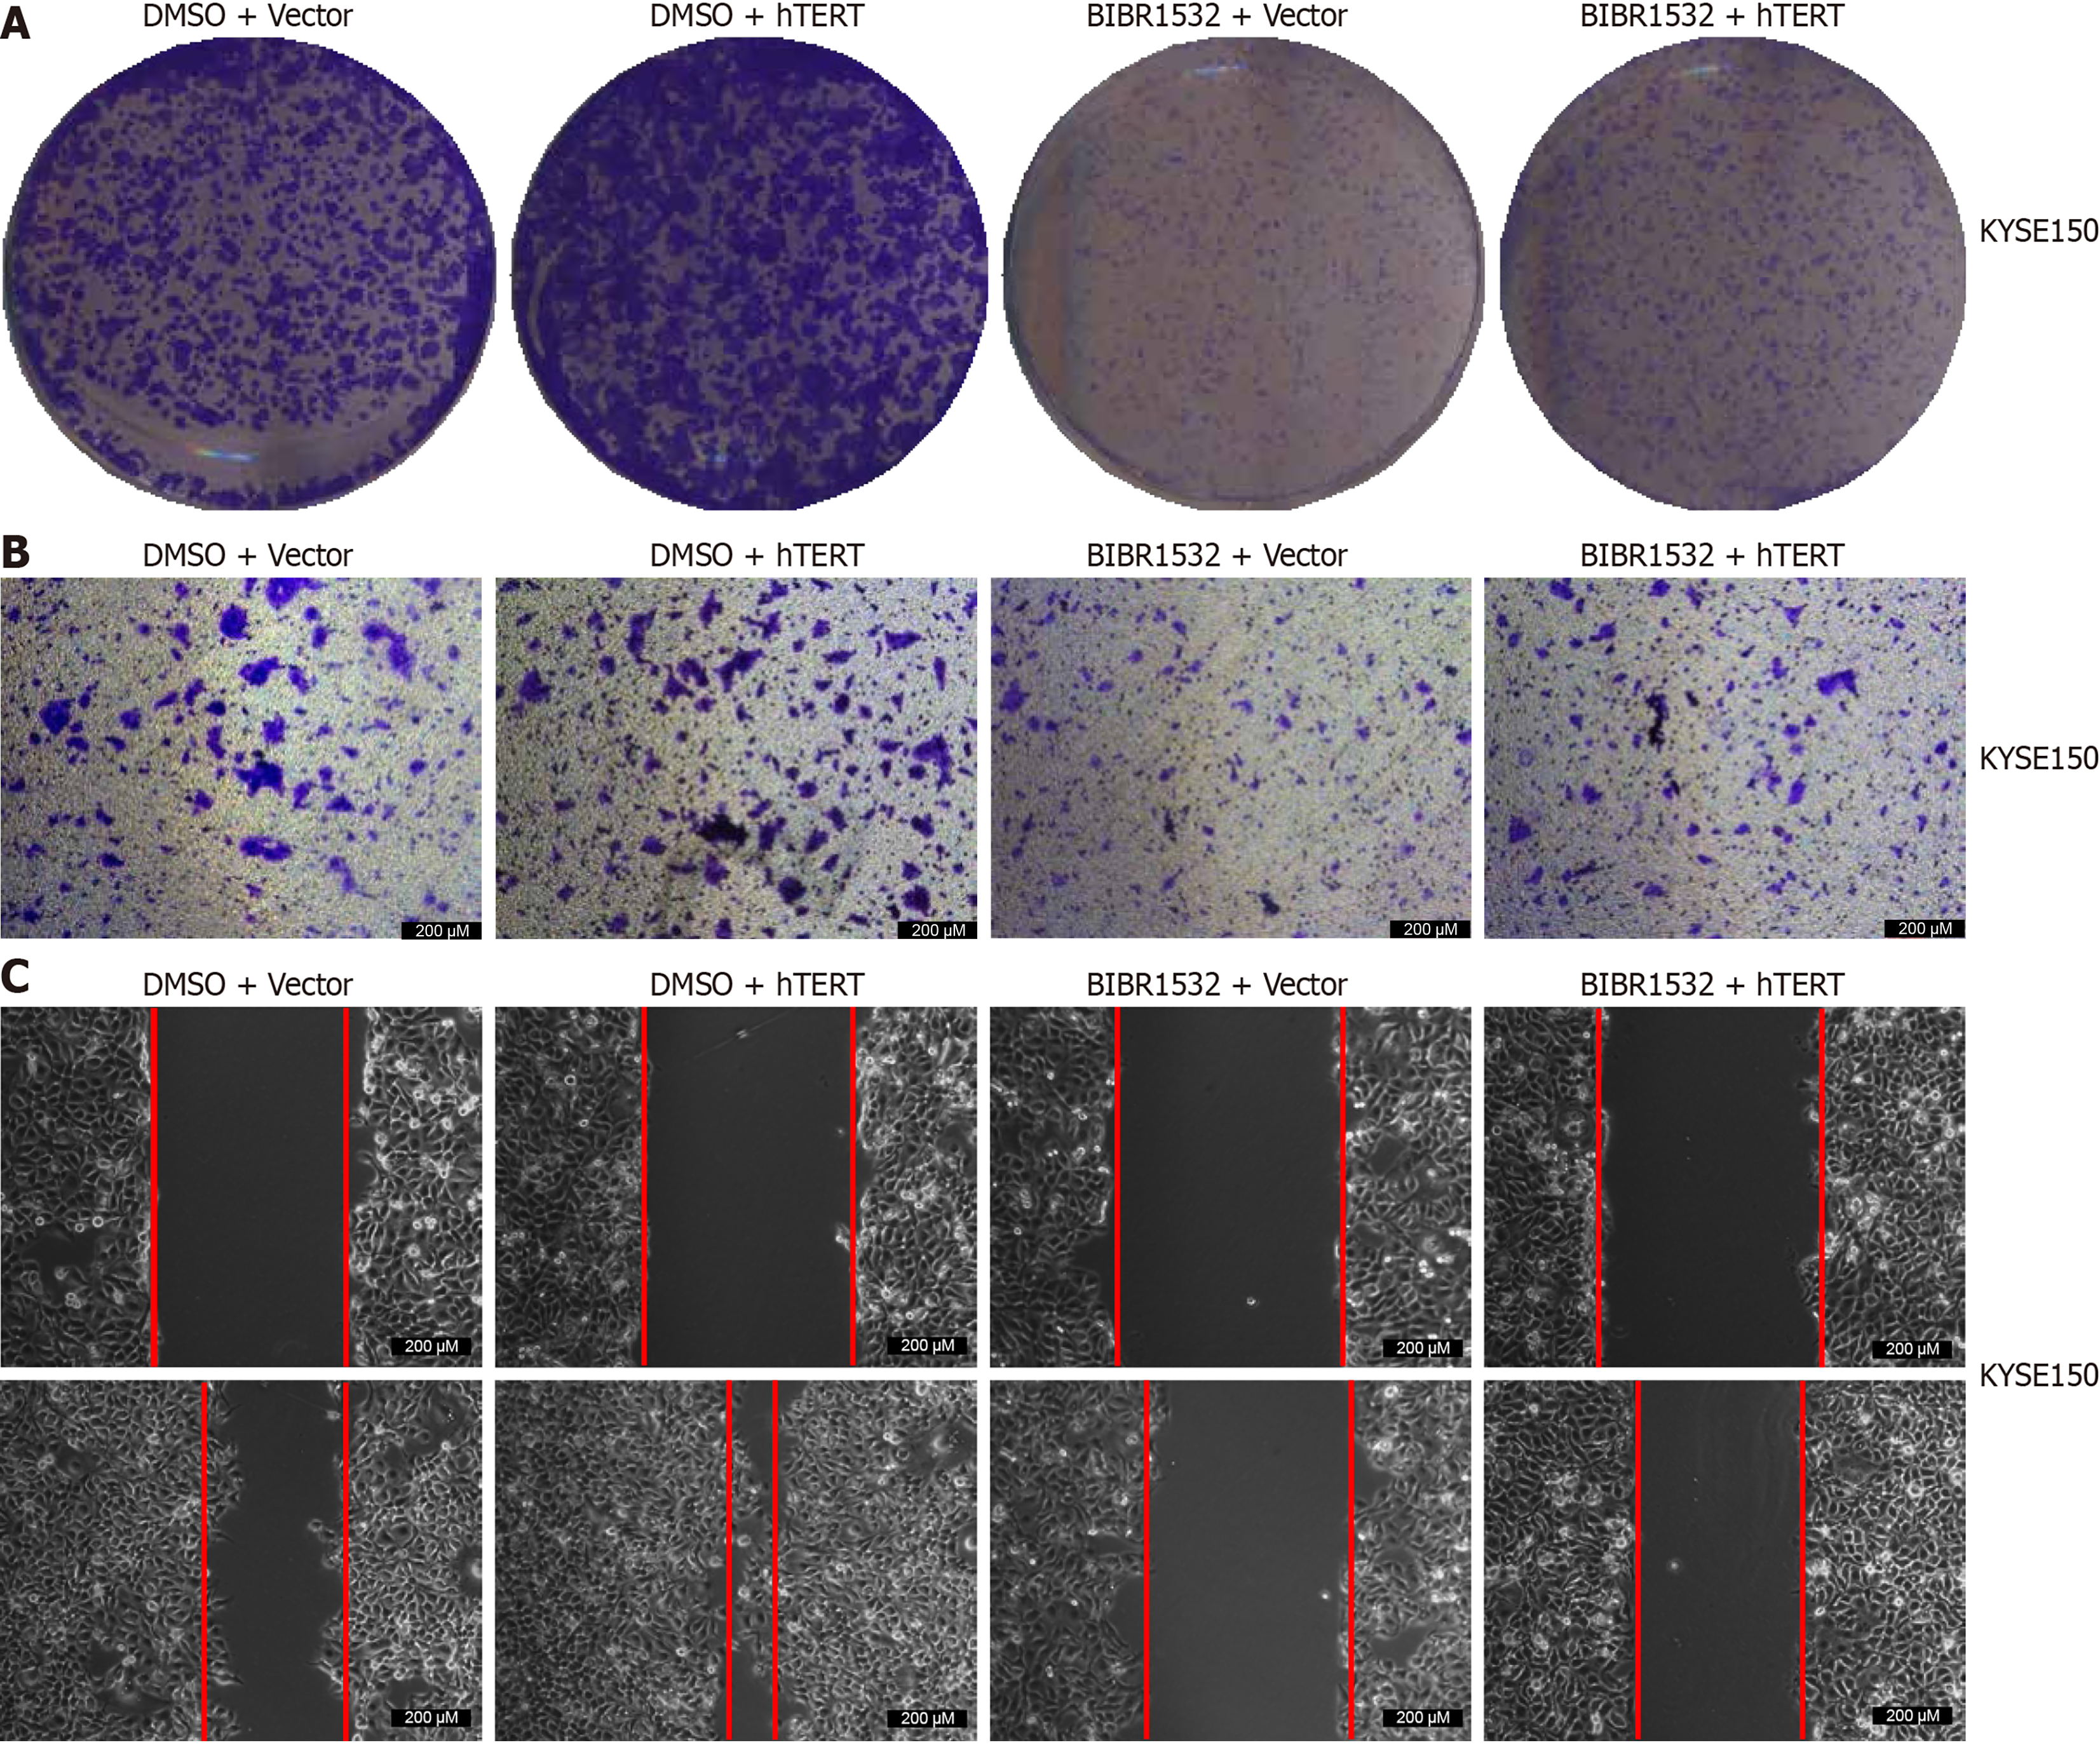
Figure 5 Proliferation and migration of KYSE150 cells after treatment with BIBR1532 combined with human telomerase reverse transcriptase overexpression.
A: Plate colony formation by KYSE150 cells after treatment with BIBR1532 (50 μM) and/or human telomerase reverse transcriptase (hTERT) overexpression for 48 hours; B: Migration evaluated by transwell assay of KYSE150 cells after treatment with BIBR1532 (50 μM) and/or hTERT overexpression for 48 hours; C: Migration evaluated by the scratch assay of KYSE150 cells after treatment with BIBR1532 (50 μM) and/or hTERT overexpression for 48 hours. hTERT: Human telomerase reverse transcriptase.
Figure 6 Effect of BIBR1532 on shelterin protein and key proteins in the DNA damage response pathway expression in KYSE150 and KYSE410 cells.
A and B: Expression of telomeric-repeat binding factor 1 (TRF1), TRF2, TIN2-interacting protein 1, protection of telomeres 1, TIN2, and repressor activation protein 1 in KYSE150 (A) and KYSE410 (B) cells after treatment with indicated concentrations of BIBR1532 for 48 hours; C and D: Expression of γ-H2AX, p-ATM, CHK2, p-ATR, and CHK1 in KYSE150 (C) and KYSE410 (D) cells after treatment with the indicated concentrations of BIBR1532 for 48 hours. TRF1: Telomeric-repeat binding factor 1; TRF2: Telomeric-repeat binding factor 2; TPP1: TIN2-interacting protein 1; POT1: Protection of telomeres 1; TIN2: TRF1-interacting nuclear protein 2; RAP1: Repressor activation protein 1; γ-H2AX: Phosphorylated histone H2AX; p-ATM: Phosphorylated ataxia-telangiectasia mutated gene; p-ATR: Phosphorylated ataxia telangiectasia and Rad3-related protein; CHK2: Check point kinase 2; CHK1: Check point kinase 1.
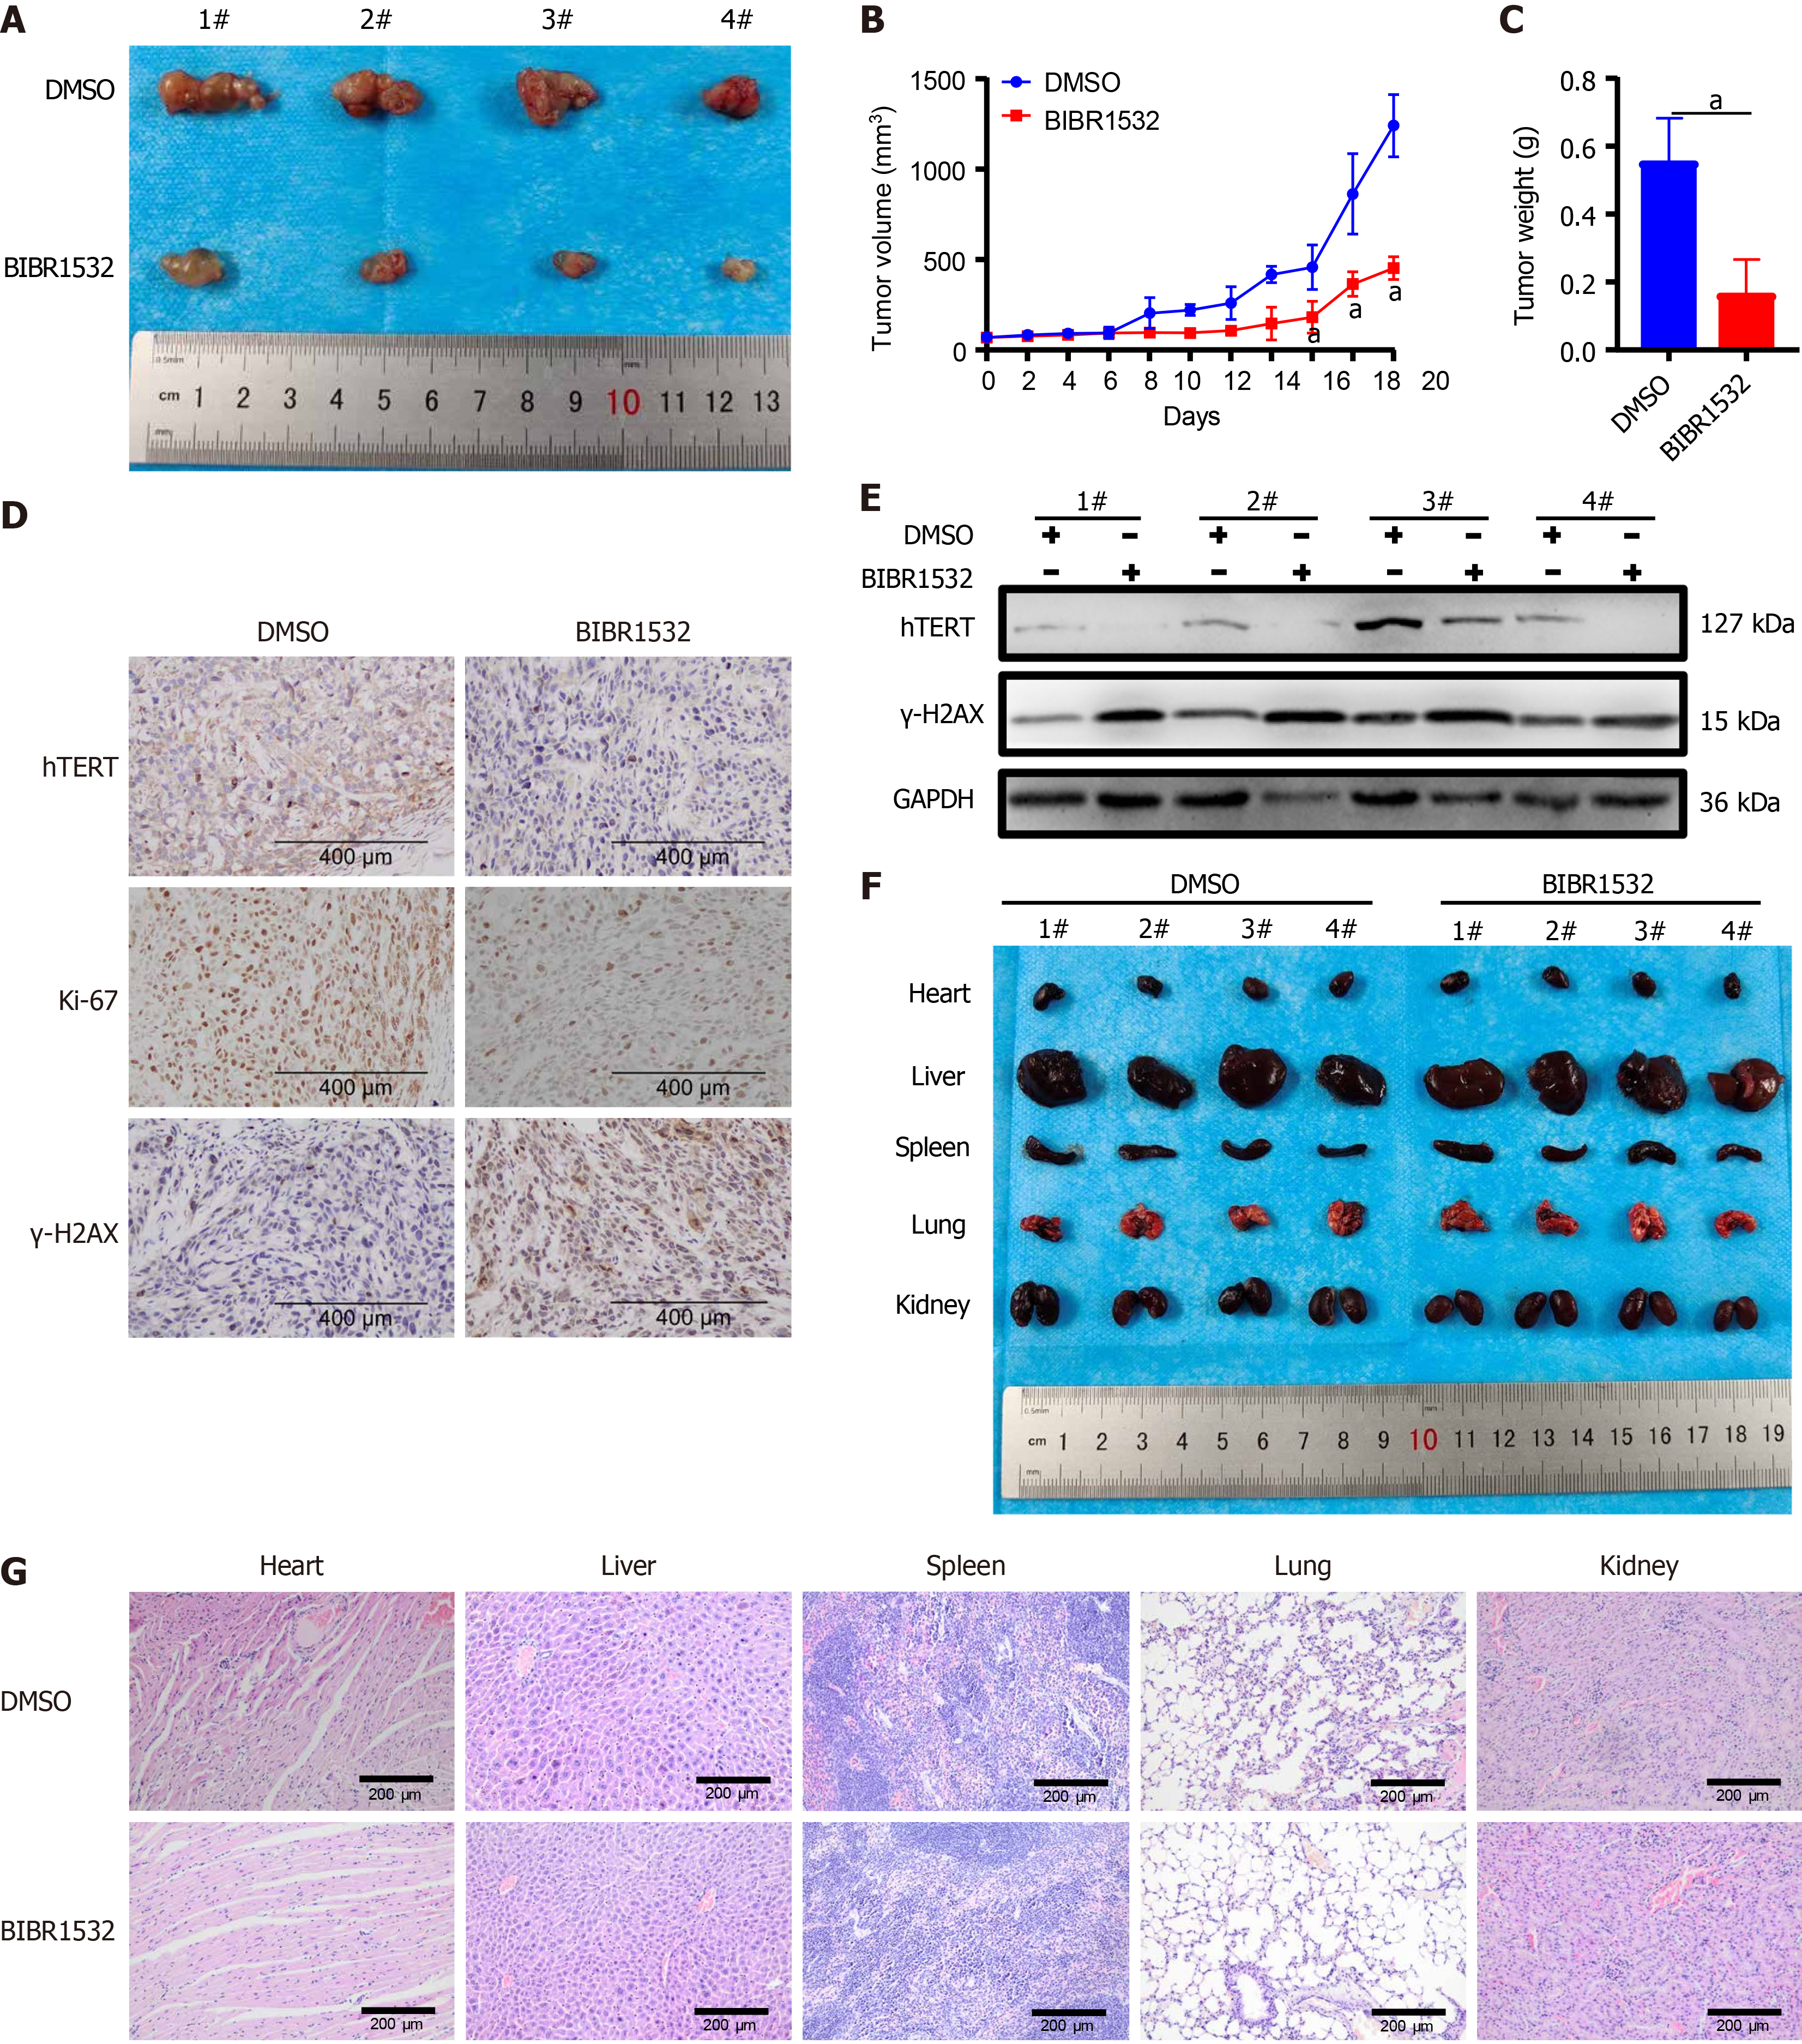
Figure 7 Anti-cancer effect of BIBR1532 in an esophageal squamous cell carcinoma xenograft mouse model.
A-C: Tumor images (A), growth curves (B), and tumor weights (C) obtained from xenograft tumors derived from KYSE150 cells treated with BIBR1532 (50 mg/kg); D and E: Expression of human telomerase reverse transcriptase, Ki-67, and γ-H2AX in xenografted tumor tissues evaluated by immunohistochemistry (D) and Western blotting (E); F: Macroscopic images of the heart, liver, spleen, lungs, and kidneys of nude mice treated with BIBR1532 or DMSO; G: Hematoxylin and eosin staining of the heart, liver, spleen, lung, and kidney tissues from nude mice treated with BIBR1532 or DMSO. aP < 0.05 was compared with the control group respectively. P < 0.05 was considered statistically significant. hTERT: Human telomerase reverse transcriptase; γ-H2AX: Phosphorylated histone H2AX.
- Citation: Wang Q, Li QR, Xu L, Yuan ZC, Liu X, Tang MJ, Luo M, Zhong XW, Ma Q, Guo XL. BIBR1532 inhibits proliferation and metastasis of esophageal squamous cancer cells by inducing telomere dysregulation. World J Gastrointest Oncol 2025; 17(1): 99376
- URL: https://www.wjgnet.com/1948-5204/full/v17/i1/99376.htm
- DOI: https://dx.doi.org/10.4251/wjgo.v17.i1.99376


